OPEN-SOURCE SCRIPT
Güncellendi EMA200 REGIME + BOS/CHoCH + 2x FVG Strategy
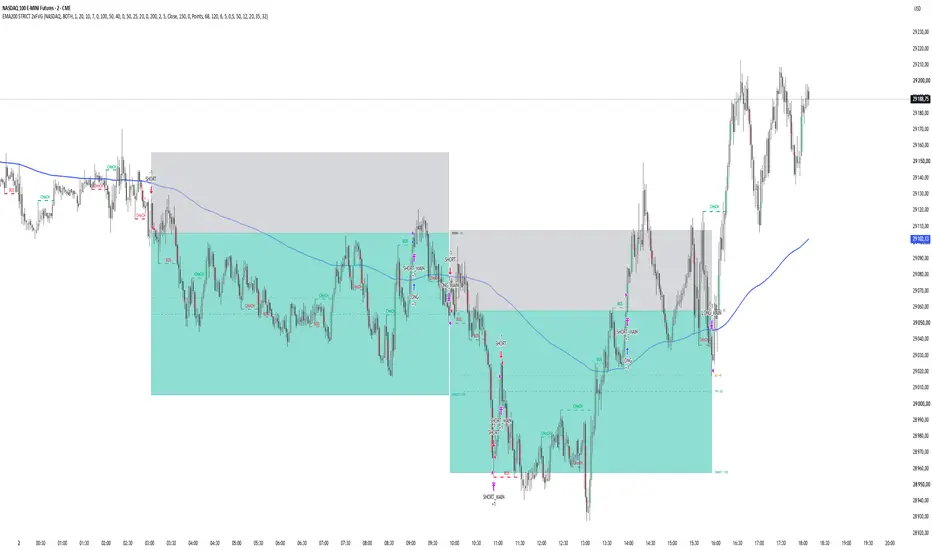
EMA200 Regime + BOS/CHoCH + 2x FVG Strategy
Overview
EMA200 Regime + BOS/CHoCH + 2x FVG Strategy is a rule-based TradingView strategy designed primarily for 2-minute intraday trading.
The strategy combines four core concepts:
EMA200 directional regime
Market Structure: BOS and CHoCH
Two-FVG confirmation logic
Limit entry at 50% of the body of the signal candle
The main objective is to identify continuation or reversal setups that develop while price remains on the correct side of the EMA200.
Unlike a simple EMA crossover strategy, the EMA200 is used mainly as a directional regime filter. A crossover activates either LONG or SHORT mode, but the strategy still requires market structure and Fair Value Gap confirmation before an entry can be created.
This script is a full strategy() implementation and is intended for use with TradingView's Strategy Tester.
1. EMA200 Regime Logic
The EMA200 determines the allowed trading direction.
SHORT regime
A SHORT regime begins when price crosses the EMA200 from above to below.
The regime remains active as long as price continues to close below the EMA200.
A SHORT regime is cancelled when:
Close > EMA200
A wick above the EMA200 alone does not necessarily invalidate the regime when structure confirmation is based on candle close.
During an active SHORT regime, the strategy searches for:
bearish BOS or bearish CHoCH
bearish 2x FVG
a valid signal candle
a retracement to the calculated limit-entry price
LONG regime
A LONG regime begins when price crosses the EMA200 from below to above.
The regime remains active while price closes above the EMA200.
The LONG regime is cancelled when:
Close < EMA200
During the active LONG regime, the strategy searches for:
bullish BOS or bullish CHoCH
bullish 2x FVG
a valid signal candle
a retracement to the limit-entry price
Important
The EMA regime does not expire after a fixed number of candles.
For example, if price remains below the EMA200 for 40 candles on the 2-minute chart, the SHORT regime may remain active for the entire period.
This is intentional.
The time limit applies to the relationship between the market-structure event and the 2x FVG confirmation, not to the EMA regime itself.
2. Market Structure
The strategy uses confirmed swing highs and swing lows to detect market-structure breaks.
Swing sensitivity is controlled by:
Swing Length
The default value is:
5
The script uses confirmed pivots and therefore does not require future data beyond the normal pivot-confirmation process.
3. BOS — Break of Structure
A bullish structure break occurs when price breaks above the most recent valid swing high.
A bearish structure break occurs when price breaks below the most recent valid swing low.
The user can select whether a structure break is confirmed using:
Close
Wick
The default setting is:
Close
This means that by default a wick through a swing level is not enough. The selected confirmation source must actually break the swing level.
Bullish BOS
If the current market structure is already bullish and another swing high is broken, the event is classified as:
Bullish BOS
Bearish BOS
If the current market structure is already bearish and another swing low is broken, the event is classified as:
Bearish BOS
4. CHoCH — Change of Character
CHoCH represents a break against the previously established market-structure direction.
Bullish CHoCH
If the previous structure was bearish and price breaks a valid swing high, the strategy classifies the event as:
Bullish CHoCH
Bearish CHoCH
If the previous structure was bullish and price breaks a valid swing low, the event is classified as:
Bearish CHoCH
The structure engine also handles newly confirmed pivots that may already have been broken by the time the pivot becomes confirmed.
This helps keep the strategy's BOS/CHoCH logic consistent with the structure displayed on the chart.
5. Fair Value Gap Definition
The strategy uses a classic three-candle FVG definition.
Bullish FVG
A bullish FVG exists when:
low > high[2]
This means that the current candle's low is above the high from two candles earlier.
The gap is located between:
high[2] and low
Bearish FVG
A bearish FVG exists when:
high < low[2]
The gap is located between:
high and low[2]
An optional minimum FVG-size filter can also be enabled.
The minimum size can be expressed in:
points
ticks
6. 2x FVG Logic
The strategy does not simply count every two consecutive FVG labels as a valid 2x FVG.
Instead, same-direction FVGs are grouped into clusters.
For example, several bullish FVGs that overlap each other can be treated as part of the same imbalance cluster.
A new same-direction FVG that does not overlap the existing cluster, while still occurring within the allowed number of bars, creates the second imbalance required for the:
2x FVG condition
The maximum allowed distance is controlled by:
Max bars between FVG
Default:
5
This approach is intended to prevent several overlapping gaps from being incorrectly counted as multiple independent imbalances.
7. Matching BOS/CHoCH With 2x FVG
During an active EMA regime, the strategy remembers the most recent valid structure event and 2x FVG event in the same direction.
For SHORT:
bearish BOS or bearish CHoCH
bearish 2x FVG
For LONG:
bullish BOS or bullish CHoCH
bullish 2x FVG
The two events must occur within the user-defined setup window.
Default:
Max bars: BOS/CHoCH ↔ 2x FVG = 15
On a 2-minute chart this represents a maximum separation of approximately:
30 minutes
Importantly, the two conditions do not have to occur in one fixed order.
Both sequences may qualify:
BOS/CHoCH → 2x FVG
or:
2x FVG → BOS/CHoCH
The script compares the distance between the two events.
If they are sufficiently close, the setup becomes:
SETUP READY
8. Signal Candle
Once the structure condition and 2x FVG condition have both been completed, the strategy waits for the next candle to close.
That candle becomes the:
Signal Candle
The strategy does not enter during an unfinished signal candle.
This avoids using information that would not have been known at the time.
9. Entry Price
The entry is calculated from the body of the signal candle.
The formula is:
Entry = (Open + Close) / 2
This is the midpoint of the candle body.
It is not:
(High + Low) / 2
After the signal candle closes, the strategy submits a LIMIT order at this body midpoint.
Example:
Open:
25,020
Close:
25,000
Entry:
25,010
The entry price is fixed after the signal candle closes and is not moved afterward.
10. Limit Order Validity
The market must retrace back to the calculated 50% body level.
The pending order remains valid for:
LIMIT Entry Validity Bars
Default:
5
If price does not reach the entry level during this period, the pending setup expires.
Importantly, expiration of the individual setup does not cancel the entire EMA regime.
For example:
price remains below EMA200
SHORT mode remains active
one limit entry expires
the strategy can continue searching for a new bearish BOS/CHoCH + 2x FVG setup
11. Multiple Setups Inside One EMA Regime
The strategy can detect more than one trade during the same directional EMA regime.
Example:
Price crosses below EMA200
↓
SHORT MODE
↓
Bearish BOS + bearish 2x FVG
↓
Trade #1
↓
Trade closes
↓
SHORT MODE remains active
↓
New bearish BOS/CHoCH + bearish 2x FVG
↓
Trade #2
This continues until the directional regime is invalidated.
For SHORT:
Close > EMA200
For LONG:
Close < EMA200
12. GOLD Preset
When the selected market is:
GOLD
the default values are:
Take Profit: 20 points
Stop Loss: 10 points
Break-Even Trigger: +15 points
Break-Even Offset: 0
Example SHORT:
Entry:
3800
Stop:
3810
Target:
3780
Break-even activates when price reaches:
3785
The stop is then moved to the entry price when the default BE Offset is zero.
13. NASDAQ Preset
When the selected market is:
NASDAQ
the default values are:
Take Profit: 100 points
Stop Loss: 50 points
Break-Even Trigger: +50 points
Break-Even Offset: 0
Example SHORT:
Entry:
25,000
Stop:
25,050
Target:
24,900
Break-even trigger:
24,950
These values represent actual price points, not ticks.
14. CUSTOM Market Mode
The CUSTOM preset allows manual configuration of:
Take Profit
Stop Loss
Break-Even Trigger
Break-Even Offset
This allows the strategy to be tested on other instruments or with different risk parameters.
15. Break-Even Logic
Break-even is handled automatically.
SHORT
If price reaches:
Entry - BE Trigger
the stop is moved to:
Entry + BE Offset
With:
BE Offset = 0
the stop moves exactly to the entry price.
LONG
If price reaches:
Entry + BE Trigger
the stop is moved to:
Entry - BE Offset
Once break-even has been activated, the stop is not intentionally moved back to the original stop-loss level.
16. TP1
The strategy also calculates an intermediate TP1 level.
Default:
50% of the distance between Entry and final Target
Example NASDAQ:
Main Target:
100 points
TP1:
50 points
Example GOLD:
Main Target:
20 points
TP1:
10 points
By default TP1 can be used as a visual reference.
The optional:
Enable Partial TP1
setting allows part of the position to be closed at TP1.
The percentage is controlled by:
TP1 Quantity %
17. Position Visualization
Active trades can be displayed using a risk/reward style box.
The visual structure includes:
Stop area
Entry line
TP1 line
Break-even trigger line
Main target
Trade labels
The STOP area is displayed above a SHORT entry and below a LONG entry.
The TARGET area is displayed below a SHORT entry and above a LONG entry.
The visualization is intended to resemble the logic of TradingView's Long/Short Position drawing tool.
18. Trade Direction
The strategy supports three directional modes:
SHORT ONLY
Only bearish setups are traded.
LONG ONLY
Only bullish setups are traded.
BOTH
Both bullish and bearish setups are allowed.
Default:
BOTH
19. Recommended Timeframe
The strategy is designed primarily around the:
2-minute timeframe
A visual warning can appear if another timeframe is selected.
The script is not technically locked to 2 minutes, but changing the timeframe changes the meaning of parameters expressed in bars.
For example:
15 bars
represents:
30 minutes on 2M
75 minutes on 5M
225 minutes on 15M
Users should therefore retest all parameters when changing timeframe.
20. Debug Mode
Debug Mode can be enabled to inspect the internal setup process.
It can show events such as:
SHORT MODE
LONG MODE
SETUP READY
LIMIT CREATED
The debug table can also display the current state of:
timeframe
EMA regime
BOS/CHoCH confirmation
2x FVG confirmation
setup readiness
pending limit
active position
This is particularly useful when reviewing historical setups that appear visually valid but did not produce a trade.
21. Backtesting
This script uses:
strategy()
rather than:
indicator()
and is therefore designed for TradingView's Strategy Tester.
It includes:
fixed contract quantity
configurable date range
stop loss
take profit
break-even
optional partial TP1
limit entries
Strategy Tester trade statistics
The strategy also uses:
calc_on_order_fills = true
calc_on_every_tick = true
use_bar_magnifier = true
Bar Magnifier can improve the realism of historical order execution when lower-timeframe data is available.
However, historical backtests can never perfectly reproduce live execution.
22. Futures Margin Configuration
The strategy includes:
margin_long = 10
and:
margin_short = 10
This represents a 10% simulated margin requirement in TradingView's broker emulator.
This setting is included primarily so that futures contracts with a high notional value are not automatically rejected simply because the simulated account does not contain 100% of the contract's notional value.
This is a backtesting configuration only.
It does not represent a specific broker's real margin requirement.
23. Non-Repainting Principles
The strategy is designed to avoid using future information for its trading decisions.
Important rules include:
structure breaks are evaluated only using available information
pivots are used only after confirmation
the signal candle must close before its midpoint can be calculated
the limit order is created only after the signal candle has closed
historical entry prices are not moved backward to make the backtest look better
the script does not intentionally use lookahead data
A confirmed pivot naturally requires candles to form after the actual swing point. This is standard pivot confirmation and should not be confused with repainting.
24. Entry Sequence Summary
SHORT
Price crosses below EMA200
↓
SHORT regime becomes active
↓
Bearish BOS or bearish CHoCH
↓
Bearish 2x FVG
↓
Conditions must be within allowed setup distance
↓
Next candle closes
↓
Entry = 50% of signal candle body
↓
SHORT limit order
↓
Price retraces to entry
↓
Position opened
↓
SL / BE / TP management
LONG
Price crosses above EMA200
↓
LONG regime becomes active
↓
Bullish BOS or bullish CHoCH
↓
Bullish 2x FVG
↓
Conditions must be within allowed setup distance
↓
Next candle closes
↓
Entry = 50% of signal candle body
↓
LONG limit order
↓
Price retraces to entry
↓
Position opened
↓
SL / BE / TP management
25. Main Inputs
Market Settings
Market
Trade Direction
Contracts
GOLD TP / SL / BE
NASDAQ TP / SL / BE
CUSTOM parameters
EMA Settings
Show EMA200
EMA Length
EMA Color
EMA Width
Structure Settings
Enable BOS
Enable CHoCH
Swing Length
Structure Break Confirmation
Structure labels
Structure lines
FVG Settings
Enable FVG
Show FVG
Maximum bars between FVGs
Minimum FVG filter
FVG size
FVG units
FVG colors
2x FVG markers
Setup Settings
Max bars between BOS/CHoCH and 2x FVG
Pre-cross event lookback
Entry Settings
LIMIT Entry Validity Bars
Risk Management
TP1 position
Partial TP1
TP1 quantity
Same-bar historical BE behavior
Visual Settings
Position box
Trade labels
EMA regime background
timeframe warning
26. Intended Use
This strategy is intended as a structured framework for researching a specific intraday trading model based on:
trend regime + market structure + imbalance + retracement entry
It is particularly useful for studying whether BOS/CHoCH and multiple Fair Value Gaps provide meaningful confirmation after price establishes direction relative to the EMA200.
The purpose of the script is not to predict every market move.
It is designed to convert a discretionary chart-reading process into explicit and testable rules.
Overview
EMA200 Regime + BOS/CHoCH + 2x FVG Strategy is a rule-based TradingView strategy designed primarily for 2-minute intraday trading.
The strategy combines four core concepts:
EMA200 directional regime
Market Structure: BOS and CHoCH
Two-FVG confirmation logic
Limit entry at 50% of the body of the signal candle
The main objective is to identify continuation or reversal setups that develop while price remains on the correct side of the EMA200.
Unlike a simple EMA crossover strategy, the EMA200 is used mainly as a directional regime filter. A crossover activates either LONG or SHORT mode, but the strategy still requires market structure and Fair Value Gap confirmation before an entry can be created.
This script is a full strategy() implementation and is intended for use with TradingView's Strategy Tester.
1. EMA200 Regime Logic
The EMA200 determines the allowed trading direction.
SHORT regime
A SHORT regime begins when price crosses the EMA200 from above to below.
The regime remains active as long as price continues to close below the EMA200.
A SHORT regime is cancelled when:
Close > EMA200
A wick above the EMA200 alone does not necessarily invalidate the regime when structure confirmation is based on candle close.
During an active SHORT regime, the strategy searches for:
bearish BOS or bearish CHoCH
bearish 2x FVG
a valid signal candle
a retracement to the calculated limit-entry price
LONG regime
A LONG regime begins when price crosses the EMA200 from below to above.
The regime remains active while price closes above the EMA200.
The LONG regime is cancelled when:
Close < EMA200
During the active LONG regime, the strategy searches for:
bullish BOS or bullish CHoCH
bullish 2x FVG
a valid signal candle
a retracement to the limit-entry price
Important
The EMA regime does not expire after a fixed number of candles.
For example, if price remains below the EMA200 for 40 candles on the 2-minute chart, the SHORT regime may remain active for the entire period.
This is intentional.
The time limit applies to the relationship between the market-structure event and the 2x FVG confirmation, not to the EMA regime itself.
2. Market Structure
The strategy uses confirmed swing highs and swing lows to detect market-structure breaks.
Swing sensitivity is controlled by:
Swing Length
The default value is:
5
The script uses confirmed pivots and therefore does not require future data beyond the normal pivot-confirmation process.
3. BOS — Break of Structure
A bullish structure break occurs when price breaks above the most recent valid swing high.
A bearish structure break occurs when price breaks below the most recent valid swing low.
The user can select whether a structure break is confirmed using:
Close
Wick
The default setting is:
Close
This means that by default a wick through a swing level is not enough. The selected confirmation source must actually break the swing level.
Bullish BOS
If the current market structure is already bullish and another swing high is broken, the event is classified as:
Bullish BOS
Bearish BOS
If the current market structure is already bearish and another swing low is broken, the event is classified as:
Bearish BOS
4. CHoCH — Change of Character
CHoCH represents a break against the previously established market-structure direction.
Bullish CHoCH
If the previous structure was bearish and price breaks a valid swing high, the strategy classifies the event as:
Bullish CHoCH
Bearish CHoCH
If the previous structure was bullish and price breaks a valid swing low, the event is classified as:
Bearish CHoCH
The structure engine also handles newly confirmed pivots that may already have been broken by the time the pivot becomes confirmed.
This helps keep the strategy's BOS/CHoCH logic consistent with the structure displayed on the chart.
5. Fair Value Gap Definition
The strategy uses a classic three-candle FVG definition.
Bullish FVG
A bullish FVG exists when:
low > high[2]
This means that the current candle's low is above the high from two candles earlier.
The gap is located between:
high[2] and low
Bearish FVG
A bearish FVG exists when:
high < low[2]
The gap is located between:
high and low[2]
An optional minimum FVG-size filter can also be enabled.
The minimum size can be expressed in:
points
ticks
6. 2x FVG Logic
The strategy does not simply count every two consecutive FVG labels as a valid 2x FVG.
Instead, same-direction FVGs are grouped into clusters.
For example, several bullish FVGs that overlap each other can be treated as part of the same imbalance cluster.
A new same-direction FVG that does not overlap the existing cluster, while still occurring within the allowed number of bars, creates the second imbalance required for the:
2x FVG condition
The maximum allowed distance is controlled by:
Max bars between FVG
Default:
5
This approach is intended to prevent several overlapping gaps from being incorrectly counted as multiple independent imbalances.
7. Matching BOS/CHoCH With 2x FVG
During an active EMA regime, the strategy remembers the most recent valid structure event and 2x FVG event in the same direction.
For SHORT:
bearish BOS or bearish CHoCH
bearish 2x FVG
For LONG:
bullish BOS or bullish CHoCH
bullish 2x FVG
The two events must occur within the user-defined setup window.
Default:
Max bars: BOS/CHoCH ↔ 2x FVG = 15
On a 2-minute chart this represents a maximum separation of approximately:
30 minutes
Importantly, the two conditions do not have to occur in one fixed order.
Both sequences may qualify:
BOS/CHoCH → 2x FVG
or:
2x FVG → BOS/CHoCH
The script compares the distance between the two events.
If they are sufficiently close, the setup becomes:
SETUP READY
8. Signal Candle
Once the structure condition and 2x FVG condition have both been completed, the strategy waits for the next candle to close.
That candle becomes the:
Signal Candle
The strategy does not enter during an unfinished signal candle.
This avoids using information that would not have been known at the time.
9. Entry Price
The entry is calculated from the body of the signal candle.
The formula is:
Entry = (Open + Close) / 2
This is the midpoint of the candle body.
It is not:
(High + Low) / 2
After the signal candle closes, the strategy submits a LIMIT order at this body midpoint.
Example:
Open:
25,020
Close:
25,000
Entry:
25,010
The entry price is fixed after the signal candle closes and is not moved afterward.
10. Limit Order Validity
The market must retrace back to the calculated 50% body level.
The pending order remains valid for:
LIMIT Entry Validity Bars
Default:
5
If price does not reach the entry level during this period, the pending setup expires.
Importantly, expiration of the individual setup does not cancel the entire EMA regime.
For example:
price remains below EMA200
SHORT mode remains active
one limit entry expires
the strategy can continue searching for a new bearish BOS/CHoCH + 2x FVG setup
11. Multiple Setups Inside One EMA Regime
The strategy can detect more than one trade during the same directional EMA regime.
Example:
Price crosses below EMA200
↓
SHORT MODE
↓
Bearish BOS + bearish 2x FVG
↓
Trade #1
↓
Trade closes
↓
SHORT MODE remains active
↓
New bearish BOS/CHoCH + bearish 2x FVG
↓
Trade #2
This continues until the directional regime is invalidated.
For SHORT:
Close > EMA200
For LONG:
Close < EMA200
12. GOLD Preset
When the selected market is:
GOLD
the default values are:
Take Profit: 20 points
Stop Loss: 10 points
Break-Even Trigger: +15 points
Break-Even Offset: 0
Example SHORT:
Entry:
3800
Stop:
3810
Target:
3780
Break-even activates when price reaches:
3785
The stop is then moved to the entry price when the default BE Offset is zero.
13. NASDAQ Preset
When the selected market is:
NASDAQ
the default values are:
Take Profit: 100 points
Stop Loss: 50 points
Break-Even Trigger: +50 points
Break-Even Offset: 0
Example SHORT:
Entry:
25,000
Stop:
25,050
Target:
24,900
Break-even trigger:
24,950
These values represent actual price points, not ticks.
14. CUSTOM Market Mode
The CUSTOM preset allows manual configuration of:
Take Profit
Stop Loss
Break-Even Trigger
Break-Even Offset
This allows the strategy to be tested on other instruments or with different risk parameters.
15. Break-Even Logic
Break-even is handled automatically.
SHORT
If price reaches:
Entry - BE Trigger
the stop is moved to:
Entry + BE Offset
With:
BE Offset = 0
the stop moves exactly to the entry price.
LONG
If price reaches:
Entry + BE Trigger
the stop is moved to:
Entry - BE Offset
Once break-even has been activated, the stop is not intentionally moved back to the original stop-loss level.
16. TP1
The strategy also calculates an intermediate TP1 level.
Default:
50% of the distance between Entry and final Target
Example NASDAQ:
Main Target:
100 points
TP1:
50 points
Example GOLD:
Main Target:
20 points
TP1:
10 points
By default TP1 can be used as a visual reference.
The optional:
Enable Partial TP1
setting allows part of the position to be closed at TP1.
The percentage is controlled by:
TP1 Quantity %
17. Position Visualization
Active trades can be displayed using a risk/reward style box.
The visual structure includes:
Stop area
Entry line
TP1 line
Break-even trigger line
Main target
Trade labels
The STOP area is displayed above a SHORT entry and below a LONG entry.
The TARGET area is displayed below a SHORT entry and above a LONG entry.
The visualization is intended to resemble the logic of TradingView's Long/Short Position drawing tool.
18. Trade Direction
The strategy supports three directional modes:
SHORT ONLY
Only bearish setups are traded.
LONG ONLY
Only bullish setups are traded.
BOTH
Both bullish and bearish setups are allowed.
Default:
BOTH
19. Recommended Timeframe
The strategy is designed primarily around the:
2-minute timeframe
A visual warning can appear if another timeframe is selected.
The script is not technically locked to 2 minutes, but changing the timeframe changes the meaning of parameters expressed in bars.
For example:
15 bars
represents:
30 minutes on 2M
75 minutes on 5M
225 minutes on 15M
Users should therefore retest all parameters when changing timeframe.
20. Debug Mode
Debug Mode can be enabled to inspect the internal setup process.
It can show events such as:
SHORT MODE
LONG MODE
SETUP READY
LIMIT CREATED
The debug table can also display the current state of:
timeframe
EMA regime
BOS/CHoCH confirmation
2x FVG confirmation
setup readiness
pending limit
active position
This is particularly useful when reviewing historical setups that appear visually valid but did not produce a trade.
21. Backtesting
This script uses:
strategy()
rather than:
indicator()
and is therefore designed for TradingView's Strategy Tester.
It includes:
fixed contract quantity
configurable date range
stop loss
take profit
break-even
optional partial TP1
limit entries
Strategy Tester trade statistics
The strategy also uses:
calc_on_order_fills = true
calc_on_every_tick = true
use_bar_magnifier = true
Bar Magnifier can improve the realism of historical order execution when lower-timeframe data is available.
However, historical backtests can never perfectly reproduce live execution.
22. Futures Margin Configuration
The strategy includes:
margin_long = 10
and:
margin_short = 10
This represents a 10% simulated margin requirement in TradingView's broker emulator.
This setting is included primarily so that futures contracts with a high notional value are not automatically rejected simply because the simulated account does not contain 100% of the contract's notional value.
This is a backtesting configuration only.
It does not represent a specific broker's real margin requirement.
23. Non-Repainting Principles
The strategy is designed to avoid using future information for its trading decisions.
Important rules include:
structure breaks are evaluated only using available information
pivots are used only after confirmation
the signal candle must close before its midpoint can be calculated
the limit order is created only after the signal candle has closed
historical entry prices are not moved backward to make the backtest look better
the script does not intentionally use lookahead data
A confirmed pivot naturally requires candles to form after the actual swing point. This is standard pivot confirmation and should not be confused with repainting.
24. Entry Sequence Summary
SHORT
Price crosses below EMA200
↓
SHORT regime becomes active
↓
Bearish BOS or bearish CHoCH
↓
Bearish 2x FVG
↓
Conditions must be within allowed setup distance
↓
Next candle closes
↓
Entry = 50% of signal candle body
↓
SHORT limit order
↓
Price retraces to entry
↓
Position opened
↓
SL / BE / TP management
LONG
Price crosses above EMA200
↓
LONG regime becomes active
↓
Bullish BOS or bullish CHoCH
↓
Bullish 2x FVG
↓
Conditions must be within allowed setup distance
↓
Next candle closes
↓
Entry = 50% of signal candle body
↓
LONG limit order
↓
Price retraces to entry
↓
Position opened
↓
SL / BE / TP management
25. Main Inputs
Market Settings
Market
Trade Direction
Contracts
GOLD TP / SL / BE
NASDAQ TP / SL / BE
CUSTOM parameters
EMA Settings
Show EMA200
EMA Length
EMA Color
EMA Width
Structure Settings
Enable BOS
Enable CHoCH
Swing Length
Structure Break Confirmation
Structure labels
Structure lines
FVG Settings
Enable FVG
Show FVG
Maximum bars between FVGs
Minimum FVG filter
FVG size
FVG units
FVG colors
2x FVG markers
Setup Settings
Max bars between BOS/CHoCH and 2x FVG
Pre-cross event lookback
Entry Settings
LIMIT Entry Validity Bars
Risk Management
TP1 position
Partial TP1
TP1 quantity
Same-bar historical BE behavior
Visual Settings
Position box
Trade labels
EMA regime background
timeframe warning
26. Intended Use
This strategy is intended as a structured framework for researching a specific intraday trading model based on:
trend regime + market structure + imbalance + retracement entry
It is particularly useful for studying whether BOS/CHoCH and multiple Fair Value Gaps provide meaningful confirmation after price establishes direction relative to the EMA200.
The purpose of the script is not to predict every market move.
It is designed to convert a discretionary chart-reading process into explicit and testable rules.
Sürüm Notları
upAçık kaynak kodlu komut dosyası
Gerçek TradingView ruhuyla, bu komut dosyasının mimarı, yatırımcıların işlevselliğini inceleyip doğrulayabilmesi için onu açık kaynaklı hale getirdi. Yazarı tebrik ederiz! Ücretsiz olarak kullanabilseniz de, kodu yeniden yayınlamanın Topluluk Kurallarımıza tabi olduğunu unutmayın.

Giving My Money Bro!!! Pan Bystry
Feragatname
Bilgiler ve yayınlar, TradingView tarafından sağlanan veya onaylanan finansal, yatırım, alım satım veya diğer türden tavsiye veya öneriler anlamına gelmez ve teşkil etmez. Kullanım Koşulları bölümünde daha fazlasını okuyun.
Açık kaynak kodlu komut dosyası
Gerçek TradingView ruhuyla, bu komut dosyasının mimarı, yatırımcıların işlevselliğini inceleyip doğrulayabilmesi için onu açık kaynaklı hale getirdi. Yazarı tebrik ederiz! Ücretsiz olarak kullanabilseniz de, kodu yeniden yayınlamanın Topluluk Kurallarımıza tabi olduğunu unutmayın.
Giving My Money Bro!!! Pan Bystry
Feragatname
Bilgiler ve yayınlar, TradingView tarafından sağlanan veya onaylanan finansal, yatırım, alım satım veya diğer türden tavsiye veya öneriler anlamına gelmez ve teşkil etmez. Kullanım Koşulları bölümünde daha fazlasını okuyun.