Güncellendi
TF: BB/KC and Potential Reversals (BBKC)
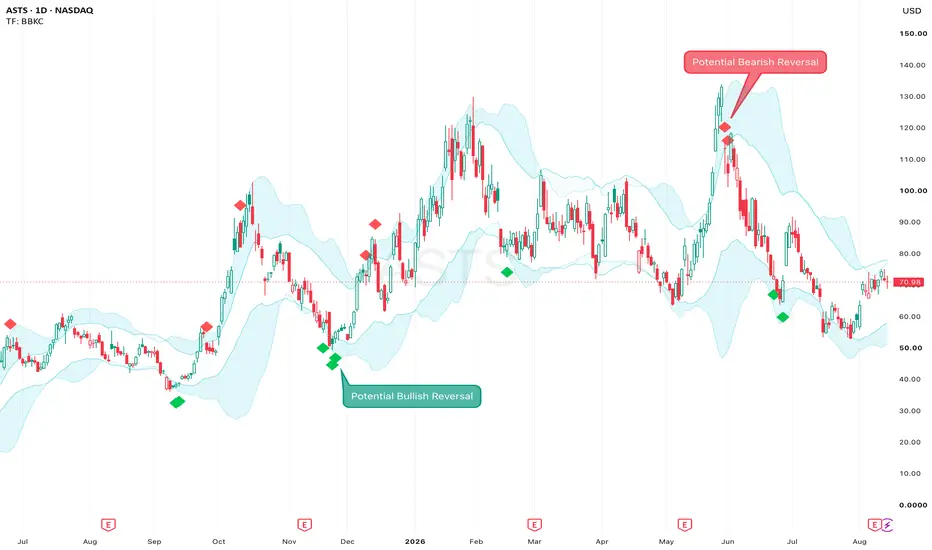
TradingFlow: BB/KC and Potential Reversals (BBKC)
BBKC combines Bollinger Bands (BB) and a Keltner Channel (KC) in one clean overlay, then uses band re-entry and momentum conditions to highlight potential bullish and bearish reversals. Its purpose is to make volatility structure, trend behaviour, compression, expansion, and possible turning points easier to read without covering the chart with separate indicators.
The diamond markers are hints that price may be reacting after an extended move or that momentum may be fading. They are not automatic trade instructions, and they do not mean a reversal is confirmed.
A Unified BB / KC View
Bollinger Bands and Keltner Channels describe volatility in different ways:
• Bollinger Bands: use standard deviation, so their width changes as price movement expands or contracts.
• Keltner Channel: uses ATR around an EMA to create a smoother channel for reading trends and pullbacks.
BBKC plots both structures with one visual theme rather than stacking two unrelated indicators. The more visible aqua boundaries are the KC, while the lighter boundaries are the BB. Subtle shading makes it easier to see how the two envelopes contract and expand around price, and the full KC area can also be lightly shaded if preferred.
This merged presentation is useful even without the reversal markers. The slope and direction of the channels, the side of the channel where price is holding, and the way price reacts at the boundaries can all provide trend context.
Why the Default KC Multiplier Is 1.6
By default, the KC uses a 20-period EMA and an ATR multiplier of 1.6. Many modern Keltner Channel implementations use a 2.0 ATR setting. BBKC uses 1.6 to keep the boundaries somewhat closer to price, making routine pullbacks, boundary tests, and re-entry behaviour easier to see. This is a visual design choice, not a claim that 1.6 is inherently more accurate.
The multiplier is adjustable. Different instruments and trading styles may benefit from a wider or narrower channel, so 1.6 should be understood as a useful default rather than a universal optimum.
How to Read the Potential Reversal Markers
• Green diamond: a bullish potential reversal. Price has reacted from a lower volatility boundary and passed the enabled filters.
• Red diamond: a bearish potential reversal. Price has reacted from an upper volatility boundary and passed the enabled filters.
By default, the script looks for the close to cross back inside a lower or upper KC or BB boundary. An optional rejection rule also checks whether the current or preceding candle touched or pierced a Bollinger Band before the current candle closed back inside.
The optional filters are designed to reduce ordinary boundary crossings:
• Volatility context: one of the two preceding closes must have been outside the corresponding boundary of a separate ATR-based Volatility Channel.
• RSI momentum: RSI must be below the bullish threshold or above the bearish threshold. Both levels are adjustable.
• Stoch RSI extreme: within a recent validity window, at least one completed bar must have both smoothed K and D in the 90/10 extreme zone. The window is adjustable and defaults to the two bars before the potential reversal; the current re-entry bar is excluded.
Potential reversal conditions are confirmed at bar close. The separate Volatility Channel can remain hidden while its values are still used by the filter; display it when you want to inspect those boundaries on the chart.
What a Marker Can and Cannot Mean
A potential reversal may become a major trend reversal, but it may also be only a small pullback, a pause within the existing trend, or a failed signal followed by continuation. The script detects a filtered move back from a volatility boundary; it cannot know in advance which outcome will follow.
The marker is therefore more useful as a prompt to investigate the chart than as a standalone entry command. A marker appearing against a strong trend should generally require more evidence than one appearing at a well-established structural level after an exhausted move.
Practical Reading Process
1. Read the slope and position of the BB / KC structure to understand the current trend and volatility regime.
2. Note whether the BB is compressing inside the KC or expanding beyond it.
3. When a diamond appears, check whether it is located near meaningful market structure rather than evaluating the marker in isolation.
4. Look for confirmation through price action, trend structure, support and resistance, or a failed breakout.
5. Add independent context such as volume profile, high- and low-volume areas, and the reaction around important support or resistance levels.
6. Define invalidation and risk before considering an entry.
Alerts
Alerts can be created for bullish potential reversals, bearish potential reversals, or either direction. They use the same final confirmed conditions and remain available when chart markers are hidden. For live use, “Once Per Bar Close” is recommended.
Important
BBKC is a chart-reading and opportunity-screening tool. Its markers are filtered potential reversals, not probabilities, guaranteed turning points, or complete trading systems. Settings behave differently across instruments and timeframes. Always combine the output with broader trend analysis, market structure, volume context, support and resistance, and appropriate risk management.
---
TradingFlow: BB/KC and Potential Reversals (BBKC)
BBKC 把布林通道(Bollinger Bands,BB)與肯特納通道(Keltner Channel,KC)整合在同一張主圖,並根據價格重新進入通道及動能條件,標示潛在的多頭和空頭反轉。它讓波動、趨勢、收縮、擴張和可能的轉折位置更容易判讀,不用另外疊加兩個指標。
菱形標記只是一個提示:價格經過一段延伸後,可能開始回頭,或原有動能正在減弱。它不是自動交易指令,也不代表反轉已經確認。
整合的 BB / KC 顯示
BB 與 KC 以不同方式描述波動:
• 布林通道:使用標準差,會隨價格波動的擴大和收窄而改變。
• 肯特納通道:以 EMA 為中心,利用 ATR 建立較平滑的通道,適合觀察趨勢與回調。
BBKC 用統一的配色呈現兩者。較清晰的水藍色邊界是 KC,較淡的邊界是 BB。淡色填充可幫助觀察兩組通道如何隨價格收縮和擴張,也可選擇顯示整個 KC 範圍。
即使不看反轉標記,這組通道本身也能幫助判斷趨勢。可留意通道斜率、價格主要停留在哪一側,以及價格接近邊界時的反應。
為何 KC 預設倍數是 1.6
KC 預設使用 20 週期 EMA 和 1.6 倍 ATR。現代 KC 指標常見的 ATR 設定是 2.0;BBKC 改用 1.6,讓邊界稍微靠近價格,更容易看到一般回調、邊界測試及價格重新進入通道的情況。這是為了方便讀圖,並不代表 1.6 本身更準確。
倍數可以自行修改。不同市場、時間週期和交易方式可能適合不同寬度,因此 1.6 只是實用的起始設定,並非所有情況下的最佳值。
如何閱讀潛在反轉標記
• 綠色菱形:多頭潛在反轉。價格從下方邊界回升,並通過已啟用的過濾條件。
• 紅色菱形:空頭潛在反轉。價格從上方邊界回落,並通過已啟用的過濾條件。
預設會尋找收盤價重新進入 KC 或 BB 邊界的情況。也可加入額外條件:目前或前一根 K 線先觸及/突破 BB,然後目前 K 線收回通道內。
各項過濾器用於減少普通邊界穿越造成的雜訊:
• 波動背景:前兩根 K 線中,至少一根的收盤價必須曾位於另一組 ATR 波動通道的相應邊界之外。
• RSI 動能:多頭標記要求 RSI 偏低,空頭標記要求 RSI 偏高;門檻可自行調整。
• Stoch RSI 極端值:在近期有效期內,至少一根已完成 K 線的平滑 K、D 必須同時進入 90/10 極端區域。有效期可以調整;預設檢查潛在反轉前的兩根 K 線,不包括目前重新進入通道的 K 線。
潛在反轉條件只會在 K 線收盤後確認。另一組 Volatility Channel 即使隱藏,其數值仍可用於過濾;如想直接查看這些邊界,可在設定中顯示它。
標記可能代表甚麼
潛在反轉可能最終發展成主要趨勢反轉,也可能只是一個小型回調、原有趨勢中的短暫停頓,甚至是錯誤提示,之後價格繼續沿原方向運行。這套判斷只能找出價格從波動邊界回頭的跡象,無法預先知道之後會出現哪一種結果。
標記的作用是提醒你多看一眼,而不是叫你立即進場。逆著強勁趨勢出現時,通常需要更多確認;若它出現在明確的支撐、阻力或區間邊緣,而且此前走勢已有明顯延伸,才更值得留意。
實用判讀流程
1. 先閱讀 BB / KC 的斜率及價格位置,判斷目前趨勢與波動狀態。
2. 觀察 BB 正在 KC 內部收縮,還是向 KC 外部擴張。
3. 菱形出現時,先看它是否接近支撐、阻力或區間邊緣,不要只看標記本身。
4. 利用價格行為、趨勢結構、支撐阻力或假突破尋找確認。
5. 配合成交量分布(Volume Profile)、高/低成交量區,以及重要支撐阻力附近的反應。
6. 考慮進場前,先定義失效位置及風險。
警報
如需追蹤,可分別在多頭潛在反轉、空頭潛在反轉,或兩者任一出現時建立警報。警報只會在收盤條件確認後觸發;隱藏圖表上的菱形標記不會影響警報。即時使用時,建議選擇「Once Per Bar Close」。
重要說明
BBKC 是圖表判讀及機會篩選工具。標記只表示經過條件過濾的潛在反轉,不代表任何勝率,也不是必然轉折或完整交易系統。不同市場和時間週期的表現可能不同。使用時仍要結合趨勢、市場結構、成交量、支撐阻力和風險管理。
---
TradingFlow: BB/KC and Potential Reversals (BBKC)
BBKCは、ボリンジャーバンド(BB)とケルトナーチャネル(KC)を1つの見やすいオーバーレイに統合し、バンドへの再進入とモメンタム条件から、強気・弱気の潜在的な反転を表示します。複数の指標を重ねてチャートを複雑にすることなく、ボラティリティ構造、トレンド、収縮、拡大、転換候補を読みやすくすることが目的です。
ひし形のマーカーは、伸びた値動きが反応し始めた、またはモメンタムが弱まりつつある可能性を知らせるヒントです。自動売買の指示ではなく、反転が確定したことも意味しません。
BBとKCを統合した表示
BBとKCは異なる方法でボラティリティを表します。
• ボリンジャーバンド:標準偏差を使うため、価格のばらつきの変化に反応します。
• ケルトナーチャネル:EMAを中心にATRで幅を作る、より滑らかなチャネルです。トレンドや押し戻りの確認に使えます。
BBKCは両者を共通の配色で整理して表示します。より明瞭なアクア色の境界がKC、薄い境界がBBです。控えめな色付けにより、2つのチャネルが価格の周囲で収縮・拡大する様子を見やすくし、必要に応じてKC全体の範囲も薄く表示できます。
この統合表示は、反転マーカーを使わない場合にも有用です。チャネルの傾き、価格が維持されている側、境界での反応から、トレンドの背景を読み取れます。
KCのデフォルト倍率が1.6である理由
KCは、デフォルトで20期間EMAと1.6倍のATRを使用します。現代的なKCでは2.0倍のATRもよく使われますが、BBKCは境界を価格に少し近づけ、通常の押し戻り、境界テスト、チャネルへの再進入を見やすくするために1.6倍を採用しています。これは見やすさのための設計であり、1.6倍のほうが本質的に正確という意味ではありません。
倍率は調整可能です。銘柄、時間軸、取引スタイルによって適切な幅は異なるため、1.6は実用的な初期値であり、すべての市場に共通する最適値ではありません。
潜在リバーサル・マーカーの見方
• 緑のひし形:強気の潜在リバーサル。価格が下側のボラティリティ境界から反応し、有効なフィルターを通過した状態です。
• 赤のひし形:弱気の潜在リバーサル。価格が上側のボラティリティ境界から反応し、有効なフィルターを通過した状態です。
デフォルトでは、終値がKCまたはBBの境界内へ戻る動きを検出します。追加条件では、現在または直前の足がBBに到達・突破し、その後に現在の終値がバンド内へ戻った場合も候補にできます。
各フィルターは、通常の境界通過によるノイズを抑えるために使用します。
• ボラティリティ背景:直前2本のうち少なくとも1本の終値が、別のATRベースのVolatility Channelの対応する境界より外側であることを要求します。
• RSIモメンタム:強気ではRSIが下側しきい値未満、弱気では上側しきい値を超えていることを要求します。どちらもしきい値を調整できます。
• Stoch RSIの極端値:直近の有効期間内で、少なくとも1本の確定足において平滑化されたKとDが同時に90/10の極端ゾーンへ入っていることを要求します。有効期間は調整でき、デフォルトでは潜在リバーサル前の2本を確認します。現在の再進入足は含めません。
潜在リバーサルの条件は足の確定時にのみ成立します。Volatility Channelは非表示でもフィルターに使われ、必要に応じてチャート上に境界を表示できます。
マーカーが意味する可能性
潜在的な反転は、大きなトレンド転換につながる場合もあれば、小さな押し戻り、既存トレンド内の一時停止、または誤ったシグナルとなってそのままトレンドが継続する場合もあります。検出しているのは、フィルターを通過したボラティリティ境界からの戻りです。その後の結果を事前に判断することはできません。
そのため、マーカーは単独のエントリー指示ではなく、チャートを詳しく確認するためのヒントとして使うのが適切です。強いトレンドに逆らうマーカーには、明確な構造水準で伸び切った後に出るマーカーよりも多くの確認が必要です。
実践的な読み方
1. BB / KCの傾きと価格位置から、現在のトレンドとボラティリティ状態を確認します。
2. BBがKCの内側で収縮しているか、外側へ拡大しているかを確認します。
3. ひし形が出たら、重要な市場構造の近くにあるかを確認し、マーカーだけで判断しないようにします。
4. プライスアクション、トレンド構造、サポートとレジスタンス、または失敗したブレイクから確認を探します。
5. ボリュームプロファイル、高・低出来高帯、重要なサポート/レジスタンスでの反応など、独立した情報を組み合わせます。
6. エントリーを検討する前に、無効化水準とリスクを定義します。
アラート
強気、弱気、またはいずれかの方向に潜在リバーサルが現れた場合のアラートを作成できます。どれも同じ足の確定条件で作動し、チャート上のマーカーを非表示にしても機能します。リアルタイムでは「Once Per Bar Close」の使用を推奨します。
重要
BBKCはチャート分析と候補抽出のためのツールです。マーカーはフィルターを通過した潜在的な反転を示すものであり、確率、保証された転換点、または完全な売買システムではありません。銘柄や時間軸によって挙動は異なります。より広いトレンド分析、市場構造、出来高、サポートとレジスタンス、適切なリスク管理と組み合わせて使用してください。
BBKC combines Bollinger Bands (BB) and a Keltner Channel (KC) in one clean overlay, then uses band re-entry and momentum conditions to highlight potential bullish and bearish reversals. Its purpose is to make volatility structure, trend behaviour, compression, expansion, and possible turning points easier to read without covering the chart with separate indicators.
The diamond markers are hints that price may be reacting after an extended move or that momentum may be fading. They are not automatic trade instructions, and they do not mean a reversal is confirmed.
A Unified BB / KC View
Bollinger Bands and Keltner Channels describe volatility in different ways:
• Bollinger Bands: use standard deviation, so their width changes as price movement expands or contracts.
• Keltner Channel: uses ATR around an EMA to create a smoother channel for reading trends and pullbacks.
BBKC plots both structures with one visual theme rather than stacking two unrelated indicators. The more visible aqua boundaries are the KC, while the lighter boundaries are the BB. Subtle shading makes it easier to see how the two envelopes contract and expand around price, and the full KC area can also be lightly shaded if preferred.
This merged presentation is useful even without the reversal markers. The slope and direction of the channels, the side of the channel where price is holding, and the way price reacts at the boundaries can all provide trend context.
Why the Default KC Multiplier Is 1.6
By default, the KC uses a 20-period EMA and an ATR multiplier of 1.6. Many modern Keltner Channel implementations use a 2.0 ATR setting. BBKC uses 1.6 to keep the boundaries somewhat closer to price, making routine pullbacks, boundary tests, and re-entry behaviour easier to see. This is a visual design choice, not a claim that 1.6 is inherently more accurate.
The multiplier is adjustable. Different instruments and trading styles may benefit from a wider or narrower channel, so 1.6 should be understood as a useful default rather than a universal optimum.
How to Read the Potential Reversal Markers
• Green diamond: a bullish potential reversal. Price has reacted from a lower volatility boundary and passed the enabled filters.
• Red diamond: a bearish potential reversal. Price has reacted from an upper volatility boundary and passed the enabled filters.
By default, the script looks for the close to cross back inside a lower or upper KC or BB boundary. An optional rejection rule also checks whether the current or preceding candle touched or pierced a Bollinger Band before the current candle closed back inside.
The optional filters are designed to reduce ordinary boundary crossings:
• Volatility context: one of the two preceding closes must have been outside the corresponding boundary of a separate ATR-based Volatility Channel.
• RSI momentum: RSI must be below the bullish threshold or above the bearish threshold. Both levels are adjustable.
• Stoch RSI extreme: within a recent validity window, at least one completed bar must have both smoothed K and D in the 90/10 extreme zone. The window is adjustable and defaults to the two bars before the potential reversal; the current re-entry bar is excluded.
Potential reversal conditions are confirmed at bar close. The separate Volatility Channel can remain hidden while its values are still used by the filter; display it when you want to inspect those boundaries on the chart.
What a Marker Can and Cannot Mean
A potential reversal may become a major trend reversal, but it may also be only a small pullback, a pause within the existing trend, or a failed signal followed by continuation. The script detects a filtered move back from a volatility boundary; it cannot know in advance which outcome will follow.
The marker is therefore more useful as a prompt to investigate the chart than as a standalone entry command. A marker appearing against a strong trend should generally require more evidence than one appearing at a well-established structural level after an exhausted move.
Practical Reading Process
1. Read the slope and position of the BB / KC structure to understand the current trend and volatility regime.
2. Note whether the BB is compressing inside the KC or expanding beyond it.
3. When a diamond appears, check whether it is located near meaningful market structure rather than evaluating the marker in isolation.
4. Look for confirmation through price action, trend structure, support and resistance, or a failed breakout.
5. Add independent context such as volume profile, high- and low-volume areas, and the reaction around important support or resistance levels.
6. Define invalidation and risk before considering an entry.
Alerts
Alerts can be created for bullish potential reversals, bearish potential reversals, or either direction. They use the same final confirmed conditions and remain available when chart markers are hidden. For live use, “Once Per Bar Close” is recommended.
Important
BBKC is a chart-reading and opportunity-screening tool. Its markers are filtered potential reversals, not probabilities, guaranteed turning points, or complete trading systems. Settings behave differently across instruments and timeframes. Always combine the output with broader trend analysis, market structure, volume context, support and resistance, and appropriate risk management.
---
TradingFlow: BB/KC and Potential Reversals (BBKC)
BBKC 把布林通道(Bollinger Bands,BB)與肯特納通道(Keltner Channel,KC)整合在同一張主圖,並根據價格重新進入通道及動能條件,標示潛在的多頭和空頭反轉。它讓波動、趨勢、收縮、擴張和可能的轉折位置更容易判讀,不用另外疊加兩個指標。
菱形標記只是一個提示:價格經過一段延伸後,可能開始回頭,或原有動能正在減弱。它不是自動交易指令,也不代表反轉已經確認。
整合的 BB / KC 顯示
BB 與 KC 以不同方式描述波動:
• 布林通道:使用標準差,會隨價格波動的擴大和收窄而改變。
• 肯特納通道:以 EMA 為中心,利用 ATR 建立較平滑的通道,適合觀察趨勢與回調。
BBKC 用統一的配色呈現兩者。較清晰的水藍色邊界是 KC,較淡的邊界是 BB。淡色填充可幫助觀察兩組通道如何隨價格收縮和擴張,也可選擇顯示整個 KC 範圍。
即使不看反轉標記,這組通道本身也能幫助判斷趨勢。可留意通道斜率、價格主要停留在哪一側,以及價格接近邊界時的反應。
為何 KC 預設倍數是 1.6
KC 預設使用 20 週期 EMA 和 1.6 倍 ATR。現代 KC 指標常見的 ATR 設定是 2.0;BBKC 改用 1.6,讓邊界稍微靠近價格,更容易看到一般回調、邊界測試及價格重新進入通道的情況。這是為了方便讀圖,並不代表 1.6 本身更準確。
倍數可以自行修改。不同市場、時間週期和交易方式可能適合不同寬度,因此 1.6 只是實用的起始設定,並非所有情況下的最佳值。
如何閱讀潛在反轉標記
• 綠色菱形:多頭潛在反轉。價格從下方邊界回升,並通過已啟用的過濾條件。
• 紅色菱形:空頭潛在反轉。價格從上方邊界回落,並通過已啟用的過濾條件。
預設會尋找收盤價重新進入 KC 或 BB 邊界的情況。也可加入額外條件:目前或前一根 K 線先觸及/突破 BB,然後目前 K 線收回通道內。
各項過濾器用於減少普通邊界穿越造成的雜訊:
• 波動背景:前兩根 K 線中,至少一根的收盤價必須曾位於另一組 ATR 波動通道的相應邊界之外。
• RSI 動能:多頭標記要求 RSI 偏低,空頭標記要求 RSI 偏高;門檻可自行調整。
• Stoch RSI 極端值:在近期有效期內,至少一根已完成 K 線的平滑 K、D 必須同時進入 90/10 極端區域。有效期可以調整;預設檢查潛在反轉前的兩根 K 線,不包括目前重新進入通道的 K 線。
潛在反轉條件只會在 K 線收盤後確認。另一組 Volatility Channel 即使隱藏,其數值仍可用於過濾;如想直接查看這些邊界,可在設定中顯示它。
標記可能代表甚麼
潛在反轉可能最終發展成主要趨勢反轉,也可能只是一個小型回調、原有趨勢中的短暫停頓,甚至是錯誤提示,之後價格繼續沿原方向運行。這套判斷只能找出價格從波動邊界回頭的跡象,無法預先知道之後會出現哪一種結果。
標記的作用是提醒你多看一眼,而不是叫你立即進場。逆著強勁趨勢出現時,通常需要更多確認;若它出現在明確的支撐、阻力或區間邊緣,而且此前走勢已有明顯延伸,才更值得留意。
實用判讀流程
1. 先閱讀 BB / KC 的斜率及價格位置,判斷目前趨勢與波動狀態。
2. 觀察 BB 正在 KC 內部收縮,還是向 KC 外部擴張。
3. 菱形出現時,先看它是否接近支撐、阻力或區間邊緣,不要只看標記本身。
4. 利用價格行為、趨勢結構、支撐阻力或假突破尋找確認。
5. 配合成交量分布(Volume Profile)、高/低成交量區,以及重要支撐阻力附近的反應。
6. 考慮進場前,先定義失效位置及風險。
警報
如需追蹤,可分別在多頭潛在反轉、空頭潛在反轉,或兩者任一出現時建立警報。警報只會在收盤條件確認後觸發;隱藏圖表上的菱形標記不會影響警報。即時使用時,建議選擇「Once Per Bar Close」。
重要說明
BBKC 是圖表判讀及機會篩選工具。標記只表示經過條件過濾的潛在反轉,不代表任何勝率,也不是必然轉折或完整交易系統。不同市場和時間週期的表現可能不同。使用時仍要結合趨勢、市場結構、成交量、支撐阻力和風險管理。
---
TradingFlow: BB/KC and Potential Reversals (BBKC)
BBKCは、ボリンジャーバンド(BB)とケルトナーチャネル(KC)を1つの見やすいオーバーレイに統合し、バンドへの再進入とモメンタム条件から、強気・弱気の潜在的な反転を表示します。複数の指標を重ねてチャートを複雑にすることなく、ボラティリティ構造、トレンド、収縮、拡大、転換候補を読みやすくすることが目的です。
ひし形のマーカーは、伸びた値動きが反応し始めた、またはモメンタムが弱まりつつある可能性を知らせるヒントです。自動売買の指示ではなく、反転が確定したことも意味しません。
BBとKCを統合した表示
BBとKCは異なる方法でボラティリティを表します。
• ボリンジャーバンド:標準偏差を使うため、価格のばらつきの変化に反応します。
• ケルトナーチャネル:EMAを中心にATRで幅を作る、より滑らかなチャネルです。トレンドや押し戻りの確認に使えます。
BBKCは両者を共通の配色で整理して表示します。より明瞭なアクア色の境界がKC、薄い境界がBBです。控えめな色付けにより、2つのチャネルが価格の周囲で収縮・拡大する様子を見やすくし、必要に応じてKC全体の範囲も薄く表示できます。
この統合表示は、反転マーカーを使わない場合にも有用です。チャネルの傾き、価格が維持されている側、境界での反応から、トレンドの背景を読み取れます。
KCのデフォルト倍率が1.6である理由
KCは、デフォルトで20期間EMAと1.6倍のATRを使用します。現代的なKCでは2.0倍のATRもよく使われますが、BBKCは境界を価格に少し近づけ、通常の押し戻り、境界テスト、チャネルへの再進入を見やすくするために1.6倍を採用しています。これは見やすさのための設計であり、1.6倍のほうが本質的に正確という意味ではありません。
倍率は調整可能です。銘柄、時間軸、取引スタイルによって適切な幅は異なるため、1.6は実用的な初期値であり、すべての市場に共通する最適値ではありません。
潜在リバーサル・マーカーの見方
• 緑のひし形:強気の潜在リバーサル。価格が下側のボラティリティ境界から反応し、有効なフィルターを通過した状態です。
• 赤のひし形:弱気の潜在リバーサル。価格が上側のボラティリティ境界から反応し、有効なフィルターを通過した状態です。
デフォルトでは、終値がKCまたはBBの境界内へ戻る動きを検出します。追加条件では、現在または直前の足がBBに到達・突破し、その後に現在の終値がバンド内へ戻った場合も候補にできます。
各フィルターは、通常の境界通過によるノイズを抑えるために使用します。
• ボラティリティ背景:直前2本のうち少なくとも1本の終値が、別のATRベースのVolatility Channelの対応する境界より外側であることを要求します。
• RSIモメンタム:強気ではRSIが下側しきい値未満、弱気では上側しきい値を超えていることを要求します。どちらもしきい値を調整できます。
• Stoch RSIの極端値:直近の有効期間内で、少なくとも1本の確定足において平滑化されたKとDが同時に90/10の極端ゾーンへ入っていることを要求します。有効期間は調整でき、デフォルトでは潜在リバーサル前の2本を確認します。現在の再進入足は含めません。
潜在リバーサルの条件は足の確定時にのみ成立します。Volatility Channelは非表示でもフィルターに使われ、必要に応じてチャート上に境界を表示できます。
マーカーが意味する可能性
潜在的な反転は、大きなトレンド転換につながる場合もあれば、小さな押し戻り、既存トレンド内の一時停止、または誤ったシグナルとなってそのままトレンドが継続する場合もあります。検出しているのは、フィルターを通過したボラティリティ境界からの戻りです。その後の結果を事前に判断することはできません。
そのため、マーカーは単独のエントリー指示ではなく、チャートを詳しく確認するためのヒントとして使うのが適切です。強いトレンドに逆らうマーカーには、明確な構造水準で伸び切った後に出るマーカーよりも多くの確認が必要です。
実践的な読み方
1. BB / KCの傾きと価格位置から、現在のトレンドとボラティリティ状態を確認します。
2. BBがKCの内側で収縮しているか、外側へ拡大しているかを確認します。
3. ひし形が出たら、重要な市場構造の近くにあるかを確認し、マーカーだけで判断しないようにします。
4. プライスアクション、トレンド構造、サポートとレジスタンス、または失敗したブレイクから確認を探します。
5. ボリュームプロファイル、高・低出来高帯、重要なサポート/レジスタンスでの反応など、独立した情報を組み合わせます。
6. エントリーを検討する前に、無効化水準とリスクを定義します。
アラート
強気、弱気、またはいずれかの方向に潜在リバーサルが現れた場合のアラートを作成できます。どれも同じ足の確定条件で作動し、チャート上のマーカーを非表示にしても機能します。リアルタイムでは「Once Per Bar Close」の使用を推奨します。
重要
BBKCはチャート分析と候補抽出のためのツールです。マーカーはフィルターを通過した潜在的な反転を示すものであり、確率、保証された転換点、または完全な売買システムではありません。銘柄や時間軸によって挙動は異なります。より広いトレンド分析、市場構造、出来高、サポートとレジスタンス、適切なリスク管理と組み合わせて使用してください。
Sürüm Notları
Fixed small mistakes.
Feragatname
Bilgiler ve yayınlar, TradingView tarafından sağlanan veya onaylanan finansal, yatırım, alım satım veya diğer türden tavsiye veya öneriler anlamına gelmez ve teşkil etmez. Kullanım Koşulları bölümünde daha fazlasını okuyun.
Feragatname
Bilgiler ve yayınlar, TradingView tarafından sağlanan veya onaylanan finansal, yatırım, alım satım veya diğer türden tavsiye veya öneriler anlamına gelmez ve teşkil etmez. Kullanım Koşulları bölümünde daha fazlasını okuyun.