False Breakout Trap Scanner [AlgoChief]
🔵 Overview
In liquid markets, price frequently makes a deceptive move beyond a key structural level — a swing high or swing low — only to reverse sharply. These moves, commonly called liquidity sweeps or stop hunts, collect resting orders before the real directional move begins.
This open-source screener detects these traps automatically across multiple symbols and timeframes simultaneously. It combines three technical filters — structural breakout detection, price reclaim confirmation, and Fibonacci retracement entry zones — and fires a signal only when all three align.
⚡ Trap Classification
Trap-A — Aggressive Rejection Price breaks a structural level and fully reclaims it within the very next candle. This is the sharpest and most decisive form of false breakout, indicating strong absorption of liquidity.
Trap-B — Gradual Return Price reclaims the broken level over 2 to 5 candles. This slower return still confirms structural failure but with softer momentum. Both types offer valid entry opportunities — Trap-A simply carries more urgency.
🟠 Long Setup (Bull Trap Logic)
Price sweeps below a confirmed swing low, triggering sell-side stop losses
Price closes back above the swept level within 5 candles — the move is classified as a false breakdown
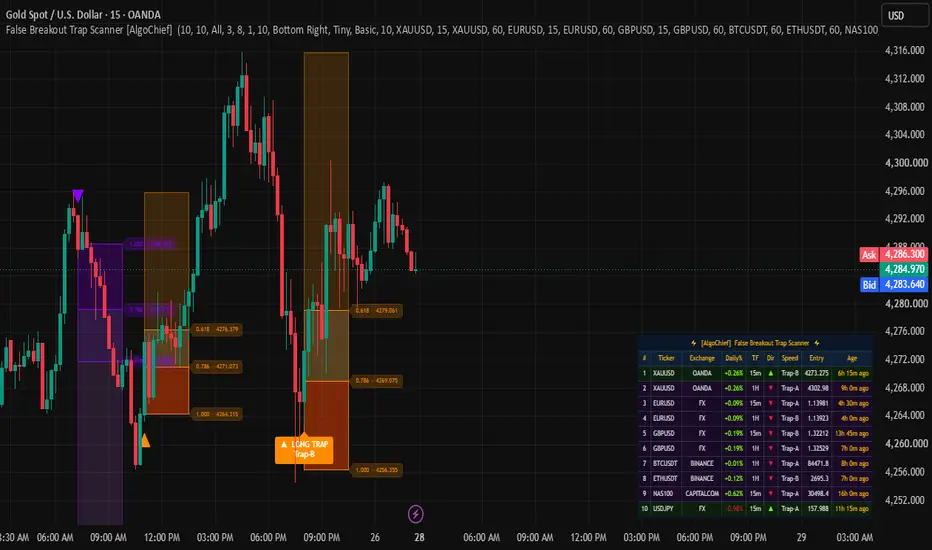
Price pulls back into the 0.618 to 1.0 Fibonacci retracement zone drawn from the recent swing high to the new sweep low
A long entry signal fires at this retracement
Stop loss is placed just below the 1.0 level (below the sweep low). Target is the previous structural high or a predefined risk-reward ratio such as 1:2 or 1:3.
🟣 Short Setup (Bear Trap Logic)
Price sweeps above a confirmed swing high, triggering buy-side stop losses
Price closes back below the swept level within 5 candles — the move is classified as a false breakout
Price pulls back into the 0.618 to 1.0 Fibonacci retracement zone drawn from the recent swing low to the new sweep high
A short entry signal fires at this retracement
Stop loss is placed just above the 1.0 level (above the sweep high). Target is the previous structural low or a predefined reward ratio.
📡 Screener Table
Monitors up to 10 user-defined symbol and timeframe pairs simultaneously. For each slot the table displays:
• Ticker and Exchange • Daily % change (color-coded green/red) • Timeframe • Trap Direction — ▲ Long or ▼ Short • Trap Speed — Trap-A or Trap-B • Entry Price at signal • Signal Age — how long ago the trap fired (e.g. 2h 15m ago)
Layout can be set to Basic (single column) or Compact (two columns side-by-side) to fit different screen setups.
🎨 Visual Features
• Amber-orange Fibonacci zones for long traps • Violet-purple Fibonacci zones for short traps • All historical zones remain visible on the chart — you can set the maximum number to display • Fibonacci level labels at 0.618, 0.786, and 1.000 with exact price printed on the zone • Triangle signal markers on the chart at each entry point • Fully customizable table position, size, and layout
⚙️ Settings Guide
Detection Settings → Pivot Lookback Period: Controls how sensitive swing high and low detection is. Lower values detect shorter-term pivots. Default is 10. → Fib Entry Window (Bars): How many candles after trap confirmation the Fibonacci zone remains active. Default is 10. → Pivot Scan Mode: All scans every detected pivot. Limited restricts scanning to the N most recent pivots only.
Visual Settings → Toggle zones, level labels, and signal markers independently → Max Historical Zones: How many past Fibonacci zones stay visible on the chart → Table on Chart: Toggle between overlay on chart or pinned to corner → Table Position, Size, and Layout: Full control over screener table appearance
Symbol Watchlist → 10 slots with independently configurable symbol and timeframe per slot → Works on any asset class — forex, crypto, commodities, indices, stocks
Alerts → Fires when all three conditions are met — sweep, reclaim, and Fibonacci entry → Frequency options: All, Once Per Bar, Once Per Bar Close
📌 How to Use
- Add the indicator to your chart on any symbol
- Open Settings → Symbol Watchlist and configure your 10 symbols and timeframes
- Watch the screener table for active signals (▲ or ▼ with entry price)
- When a row lights up, switch to that symbol's chart to see the Fibonacci zone
- Enter near the 0.618 to 0.786 area with stop beyond the 1.0 level
- Enable alerts to be notified automatically without watching the screen
⚠️ Disclaimer
This tool is for educational and analytical purposes only. It does not constitute financial advice. All trading decisions are the sole responsibility of the trader. Past performance of any pattern does not guarantee future results. Always apply proper risk management before entering any trade.
In liquid markets, price frequently makes a deceptive move beyond a key structural level — a swing high or swing low — only to reverse sharply. These moves, commonly called liquidity sweeps or stop hunts, collect resting orders before the real directional move begins.
This open-source screener detects these traps automatically across multiple symbols and timeframes simultaneously. It combines three technical filters — structural breakout detection, price reclaim confirmation, and Fibonacci retracement entry zones — and fires a signal only when all three align.
⚡ Trap Classification
Trap-A — Aggressive Rejection Price breaks a structural level and fully reclaims it within the very next candle. This is the sharpest and most decisive form of false breakout, indicating strong absorption of liquidity.
Trap-B — Gradual Return Price reclaims the broken level over 2 to 5 candles. This slower return still confirms structural failure but with softer momentum. Both types offer valid entry opportunities — Trap-A simply carries more urgency.
🟠 Long Setup (Bull Trap Logic)
Price sweeps below a confirmed swing low, triggering sell-side stop losses
Price closes back above the swept level within 5 candles — the move is classified as a false breakdown
Price pulls back into the 0.618 to 1.0 Fibonacci retracement zone drawn from the recent swing high to the new sweep low
A long entry signal fires at this retracement
Stop loss is placed just below the 1.0 level (below the sweep low). Target is the previous structural high or a predefined risk-reward ratio such as 1:2 or 1:3.
🟣 Short Setup (Bear Trap Logic)
Price sweeps above a confirmed swing high, triggering buy-side stop losses
Price closes back below the swept level within 5 candles — the move is classified as a false breakout
Price pulls back into the 0.618 to 1.0 Fibonacci retracement zone drawn from the recent swing low to the new sweep high
A short entry signal fires at this retracement
Stop loss is placed just above the 1.0 level (above the sweep high). Target is the previous structural low or a predefined reward ratio.
📡 Screener Table
Monitors up to 10 user-defined symbol and timeframe pairs simultaneously. For each slot the table displays:
• Ticker and Exchange • Daily % change (color-coded green/red) • Timeframe • Trap Direction — ▲ Long or ▼ Short • Trap Speed — Trap-A or Trap-B • Entry Price at signal • Signal Age — how long ago the trap fired (e.g. 2h 15m ago)
Layout can be set to Basic (single column) or Compact (two columns side-by-side) to fit different screen setups.
🎨 Visual Features
• Amber-orange Fibonacci zones for long traps • Violet-purple Fibonacci zones for short traps • All historical zones remain visible on the chart — you can set the maximum number to display • Fibonacci level labels at 0.618, 0.786, and 1.000 with exact price printed on the zone • Triangle signal markers on the chart at each entry point • Fully customizable table position, size, and layout
⚙️ Settings Guide
Detection Settings → Pivot Lookback Period: Controls how sensitive swing high and low detection is. Lower values detect shorter-term pivots. Default is 10. → Fib Entry Window (Bars): How many candles after trap confirmation the Fibonacci zone remains active. Default is 10. → Pivot Scan Mode: All scans every detected pivot. Limited restricts scanning to the N most recent pivots only.
Visual Settings → Toggle zones, level labels, and signal markers independently → Max Historical Zones: How many past Fibonacci zones stay visible on the chart → Table on Chart: Toggle between overlay on chart or pinned to corner → Table Position, Size, and Layout: Full control over screener table appearance
Symbol Watchlist → 10 slots with independently configurable symbol and timeframe per slot → Works on any asset class — forex, crypto, commodities, indices, stocks
Alerts → Fires when all three conditions are met — sweep, reclaim, and Fibonacci entry → Frequency options: All, Once Per Bar, Once Per Bar Close
📌 How to Use
- Add the indicator to your chart on any symbol
- Open Settings → Symbol Watchlist and configure your 10 symbols and timeframes
- Watch the screener table for active signals (▲ or ▼ with entry price)
- When a row lights up, switch to that symbol's chart to see the Fibonacci zone
- Enter near the 0.618 to 0.786 area with stop beyond the 1.0 level
- Enable alerts to be notified automatically without watching the screen
⚠️ Disclaimer
This tool is for educational and analytical purposes only. It does not constitute financial advice. All trading decisions are the sole responsibility of the trader. Past performance of any pattern does not guarantee future results. Always apply proper risk management before entering any trade.

For access & queries: algochiefsupport@gmail.com
Feragatname
Bilgiler ve yayınlar, TradingView tarafından sağlanan veya onaylanan finansal, yatırım, alım satım veya diğer türden tavsiye veya öneriler anlamına gelmez ve teşkil etmez. Kullanım Koşulları bölümünde daha fazlasını okuyun.
For access & queries: algochiefsupport@gmail.com
Feragatname
Bilgiler ve yayınlar, TradingView tarafından sağlanan veya onaylanan finansal, yatırım, alım satım veya diğer türden tavsiye veya öneriler anlamına gelmez ve teşkil etmez. Kullanım Koşulları bölümünde daha fazlasını okuyun.