Donato Trend Stength Index
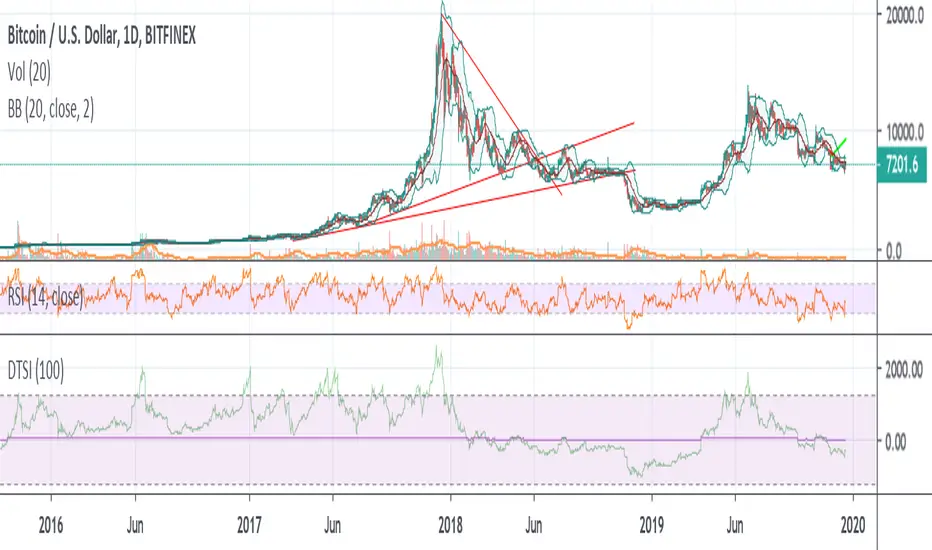
This indicator is a basic way to look at longer periods of time and look for exhaustion based on closes above or below RSI50. The first output is RSI14 the second is a rolling 100 day aggregate of closes where 50 acts as 0. As of now it appears totals of 1200+ /-1200- could be considered overbought / oversold, respectively. Totals near or above / below 2000 / -2000 (respectively) could be great indicators of extreme trend exhaustion and impending reversal.

Charts and ratios nobody else publishes: livebtcnews.com and make sure to check out Sleepless Markets (YouTube) for live price tracking and volatility alerts.
Feragatname
Bilgiler ve yayınlar, TradingView tarafından sağlanan veya onaylanan finansal, yatırım, alım satım veya diğer türden tavsiye veya öneriler anlamına gelmez ve teşkil etmez. Kullanım Koşulları bölümünde daha fazlasını okuyun.
Charts and ratios nobody else publishes: livebtcnews.com and make sure to check out Sleepless Markets (YouTube) for live price tracking and volatility alerts.
Feragatname
Bilgiler ve yayınlar, TradingView tarafından sağlanan veya onaylanan finansal, yatırım, alım satım veya diğer türden tavsiye veya öneriler anlamına gelmez ve teşkil etmez. Kullanım Koşulları bölümünde daha fazlasını okuyun.