OPEN-SOURCE SCRIPT
Order Blocks FVG & BOS
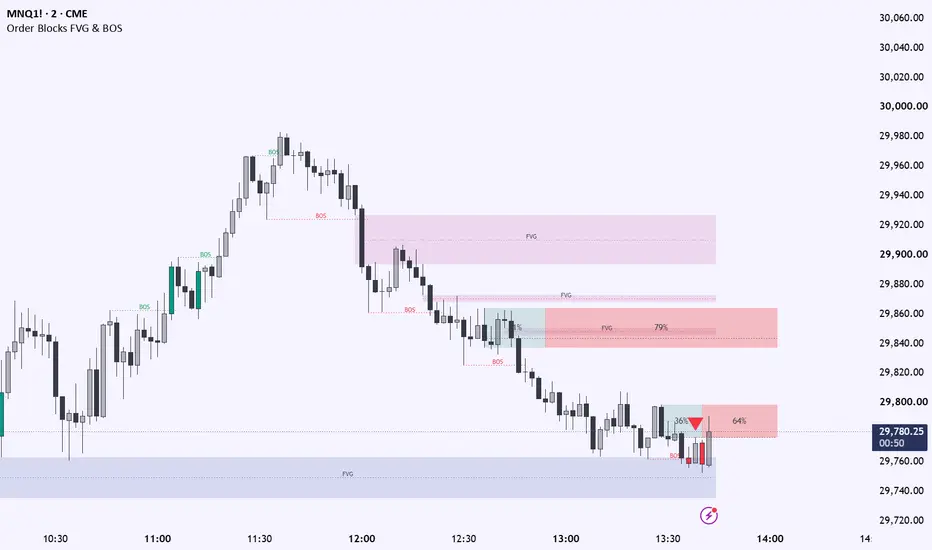
Order Block FVG BOS Toolkit
SHORT SUMMARY
An ICT-style price-action toolkit that identifies order blocks, fair value gaps, and break-of-structure events on the chart. Includes configurable zones, labels, lines, mitigation behavior, retest markers, equal highs and lows, candle-coloring options, and visual controls for bullish and bearish structures.
FULL DESCRIPTION
Order Block FVG BOS Toolkit is an ICT-style price-action indicator designed to help traders visually organize three common market-structure concepts: order blocks, fair value gaps, and breaks of structure.
The indicator is intended as a chart-analysis and decision-support tool. It does not place trades, manage positions, or guarantee future market outcomes.
FEATURES
Order Blocks
The indicator identifies bullish and bearish order-block areas based on directional price delivery and subsequent market-structure confirmation. Order blocks are displayed as configurable chart zones with separate bullish and bearish colors.
Users can adjust:
- Bullish and bearish order-block visibility
- Historical zone display
- Invalidated-zone behavior
- Order-block sensitivity or pivot settings
- Invalidation method
- Zone extension
- Volumetric information when available
- Midline display
- Retest labels or markers
- Order-block label visibility
- Zone colors and transparency
Fair Value Gaps
The indicator identifies bullish and bearish fair value gaps created by price inefficiency between candles. Each gap can be displayed as a projected zone and labeled directly on the chart.
Users can configure:
- Bullish and bearish fair value gaps
- Invalidation method
- Historical gap visibility
- Visible extended zones
- FVG labels
- Label color and size
- Midline display
- Zone combination behavior
- Inversion-gap display when enabled
Break of Structure
The indicator marks bullish and bearish breaks of structure using horizontal lines and chart labels. The line begins at the relevant swing point and extends toward the structure-breaking event so the reference level remains visible.
Users can configure:
- Break-of-structure visibility
- Bullish and bearish BOS colors
- BOS line type
- BOS line width
- BOS label size
- BOS label visibility
- Candle-coloring options associated with structure events
Equal Highs and Equal Lows
When enabled, the indicator identifies nearby swing highs and swing lows that form relatively equal price levels. These levels are displayed using horizontal reference lines and labels.
Equal-high and equal-low detection is controlled by the pivot or swing-length settings and the allowed price relationship between the two swing points. The result is a visual reference for potential liquidity areas rather than a prediction that liquidity will necessarily be taken.
Retests
Retest markers identify candles that revisit a previously detected order block, fair value gap, or related structure zone, depending on the enabled settings and the specific zone state.
Retest markers can be configured with:
- Visibility
- Marker size
- Marker color
- Retest label or marker behavior
A retest does not automatically represent a trade entry. It only identifies interaction with a previously detected chart zone.
Visual Configuration
The indicator includes controls for:
- Bullish and bearish colors
- Zone transparency
- Line type
- Line width
- Label size
- Label color
- Midline display
- Chart visibility
- Historical-zone visibility
- Invalidated-zone handling
- Candle coloring
The visual settings are independent of the underlying detection logic. Changing colors, line styles, label sizes, or transparency does not change how the zones or structure events are identified.
HOW TO USE
1. Add the indicator to a candlestick chart.
2. Select the market and timeframe appropriate for your analysis.
3. Enable only the market-structure components needed for the current chart.
4. Adjust pivot length, sensitivity, invalidation, and extension settings to match the timeframe and market.
5. Use order blocks and fair value gaps as areas of interest rather than automatic entries.
6. Use BOS lines to provide structural context and directional confirmation.
7. Review retests, equal highs, equal lows, and liquidity interaction together with price action.
8. Confirm any potential setup with your own risk-management and trade-planning process.
INTERPRETATION
Bullish zones generally represent areas associated with prior bullish order flow or bullish price imbalance.
Bearish zones generally represent areas associated with prior bearish order flow or bearish price imbalance.
A BOS line represents a break beyond a previously identified structural reference. It is not, by itself, a complete trade signal.
A fair value gap represents a price-inefficiency area. Price may revisit, partially fill, fully fill, or ignore a gap.
An order block may become invalid when price violates the selected invalidation condition. The exact behavior depends on the selected invalidation method and whether invalidated zones are retained or removed.
LIMITATIONS
This indicator is not a strategy and does not provide guaranteed entries, exits, profitability, accuracy, or investment results.
Displayed zones and labels are dependent on the selected timeframe, symbol, chart history, pivot settings, invalidation rules, and available data.
Signals and zones may appear differently across timeframes because market structure is timeframe-dependent.
Historical chart markings should not be interpreted as proof of future performance.
Developing candles can change before they close. Users should distinguish between confirmed events and conditions forming on the current candle.
The indicator should be used with independent analysis, appropriate risk management, and an understanding of the market being traded.
This script is provided for educational and analytical purposes only and is not financial advice.
OPTIONAL RELEASE NOTES
Updated the visual controls for order blocks, fair value gaps, and break-of-structure events.
Changes include:
- Added configurable line-width controls.
- Improved swept-level visibility.
- Applied label-size controls consistently across chart labels.
- Added separate color controls for bullish structures, bearish structures, midpoint lines, and swept levels.
- Improved tooltips for visual settings.
- Preserved the existing detection and alert logic.
Açık kaynak kodlu komut dosyası
Gerçek TradingView ruhuyla, bu komut dosyasının mimarı, yatırımcıların işlevselliğini inceleyip doğrulayabilmesi için onu açık kaynaklı hale getirdi. Yazarı tebrik ederiz! Ücretsiz olarak kullanabilseniz de, kodu yeniden yayınlamanın Topluluk Kurallarımıza tabi olduğunu unutmayın.

Feragatname
Bilgiler ve yayınlar, TradingView tarafından sağlanan veya onaylanan finansal, yatırım, alım satım veya diğer türden tavsiye veya öneriler anlamına gelmez ve teşkil etmez. Kullanım Koşulları bölümünde daha fazlasını okuyun.
Açık kaynak kodlu komut dosyası
Gerçek TradingView ruhuyla, bu komut dosyasının mimarı, yatırımcıların işlevselliğini inceleyip doğrulayabilmesi için onu açık kaynaklı hale getirdi. Yazarı tebrik ederiz! Ücretsiz olarak kullanabilseniz de, kodu yeniden yayınlamanın Topluluk Kurallarımıza tabi olduğunu unutmayın.
Feragatname
Bilgiler ve yayınlar, TradingView tarafından sağlanan veya onaylanan finansal, yatırım, alım satım veya diğer türden tavsiye veya öneriler anlamına gelmez ve teşkil etmez. Kullanım Koşulları bölümünde daha fazlasını okuyun.