RSI of Ratio
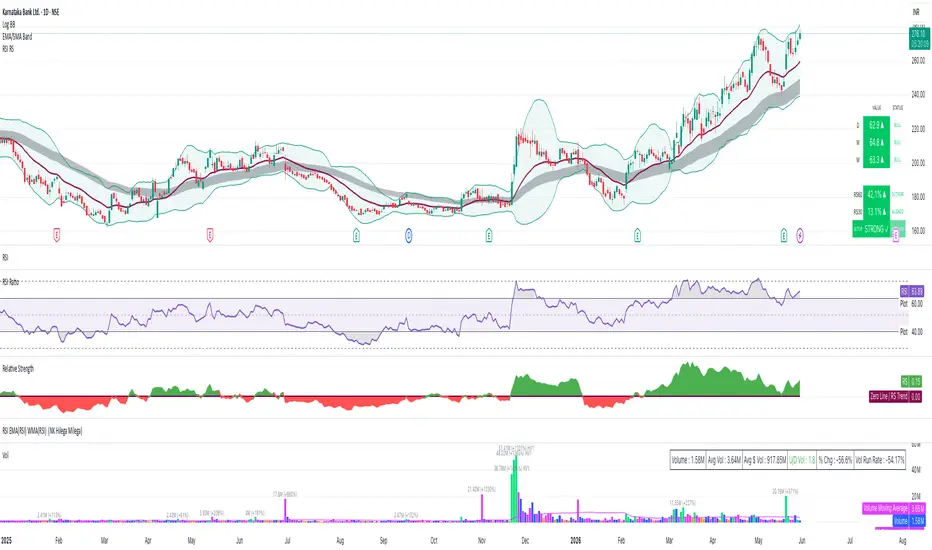
What it does:
Calculates RSI on the ratio of current symbol vs a user-selected compare symbol
(default: NSE:NIFTY). This shows whether the stock is strong or weak relative
to the index.
How to use:
- RSI above 60 → stock outperforming the index (gray dark fill)
- RSI 50–60 → mildly outperforming
- RSI 40–50 → mildly underperforming
- RSI below 40 → stock underperforming the index (gray dark fill)
Settings:
- RSI Length: default 30
- Compare Symbol: any TradingView symbol (Nifty, BTC, SPX, Gold etc)
- All levels adjustable: 70/60/50/40/30
Calculates RSI on the ratio of current symbol vs a user-selected compare symbol
(default: NSE:NIFTY). This shows whether the stock is strong or weak relative
to the index.
How to use:
- RSI above 60 → stock outperforming the index (gray dark fill)
- RSI 50–60 → mildly outperforming
- RSI 40–50 → mildly underperforming
- RSI below 40 → stock underperforming the index (gray dark fill)
Settings:
- RSI Length: default 30
- Compare Symbol: any TradingView symbol (Nifty, BTC, SPX, Gold etc)
- All levels adjustable: 70/60/50/40/30

Feragatname
Bilgiler ve yayınlar, TradingView tarafından sağlanan veya onaylanan finansal, yatırım, alım satım veya diğer türden tavsiye veya öneriler anlamına gelmez ve teşkil etmez. Kullanım Koşulları bölümünde daha fazlasını okuyun.
Feragatname
Bilgiler ve yayınlar, TradingView tarafından sağlanan veya onaylanan finansal, yatırım, alım satım veya diğer türden tavsiye veya öneriler anlamına gelmez ve teşkil etmez. Kullanım Koşulları bölümünde daha fazlasını okuyun.