Liquidity Volume Profile
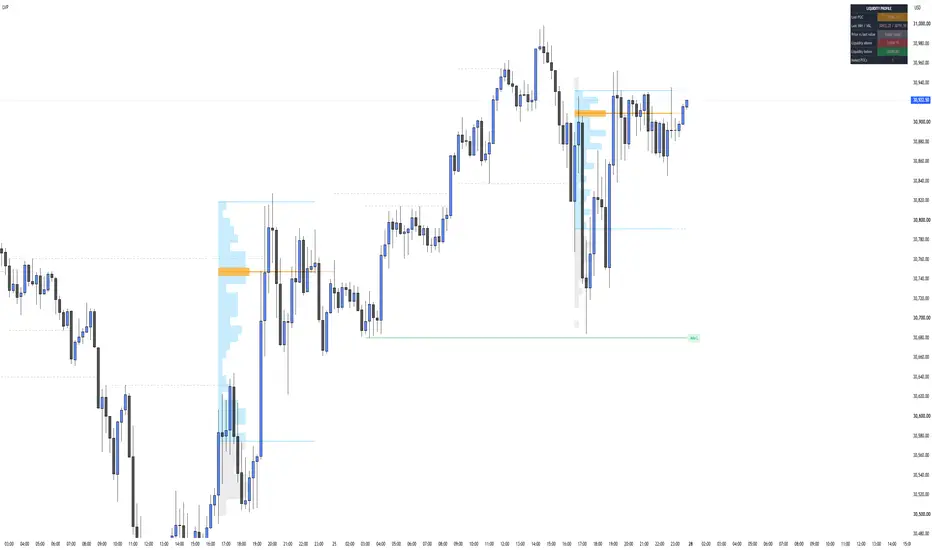
Liquidity Volume Profile builds a session volume profile and combines it with the liquidity levels intraday traders watch most, in one clean indicator.
Session profile:
- Volume profile for each NY session (09:30-16:00) or the full day
- Point of Control (POC), Value Area High and Low (default 70%)
- Developing profile for the current session, updated in real time
- Volume is distributed using a lower timeframe (1 minute by default) for better precision than chart bars alone
Profile levels:
- Previous session VAH / VAL extended into the next session
- Naked POCs: each POC stays extended until price trades back to it
Liquidity:
- Asia high/low, London high/low and previous day high/low
- Unswept levels stay active with a label; once price trades through a level it turns into a short dashed line
Dashboard:
- Developing and last POC / VAH / VAL
- Price position relative to the last value area (above, inside, below)
- Nearest unswept liquidity above and below
- Number of active naked POCs
Alerts:
- Buy-side liquidity swept
- Sell-side liquidity swept
- Naked POC touched
Settings:
Session times, timezone, number of rows, value area %, precision timeframe, histogram width, colors and which liquidity levels to show can all be changed.
Notes:
- Volume is distributed evenly across each lower-timeframe bar's range, so the profile is an approximation of true tick-level volume.
- Designed for index futures such as NQ/MNQ and ES/MES on intraday charts, but it works on any symbol with volume data.
- This is an analysis tool, not financial advice or a trading signal.
Session profile:
- Volume profile for each NY session (09:30-16:00) or the full day
- Point of Control (POC), Value Area High and Low (default 70%)
- Developing profile for the current session, updated in real time
- Volume is distributed using a lower timeframe (1 minute by default) for better precision than chart bars alone
Profile levels:
- Previous session VAH / VAL extended into the next session
- Naked POCs: each POC stays extended until price trades back to it
Liquidity:
- Asia high/low, London high/low and previous day high/low
- Unswept levels stay active with a label; once price trades through a level it turns into a short dashed line
Dashboard:
- Developing and last POC / VAH / VAL
- Price position relative to the last value area (above, inside, below)
- Nearest unswept liquidity above and below
- Number of active naked POCs
Alerts:
- Buy-side liquidity swept
- Sell-side liquidity swept
- Naked POC touched
Settings:
Session times, timezone, number of rows, value area %, precision timeframe, histogram width, colors and which liquidity levels to show can all be changed.
Notes:
- Volume is distributed evenly across each lower-timeframe bar's range, so the profile is an approximation of true tick-level volume.
- Designed for index futures such as NQ/MNQ and ES/MES on intraday charts, but it works on any symbol with volume data.
- This is an analysis tool, not financial advice or a trading signal.

Feragatname
Bilgiler ve yayınlar, TradingView tarafından sağlanan veya onaylanan finansal, yatırım, alım satım veya diğer türden tavsiye veya öneriler anlamına gelmez ve teşkil etmez. Kullanım Koşulları bölümünde daha fazlasını okuyun.
Feragatname
Bilgiler ve yayınlar, TradingView tarafından sağlanan veya onaylanan finansal, yatırım, alım satım veya diğer türden tavsiye veya öneriler anlamına gelmez ve teşkil etmez. Kullanım Koşulları bölümünde daha fazlasını okuyun.