Mag7 vs RSP Rotation Intensity Z-Score
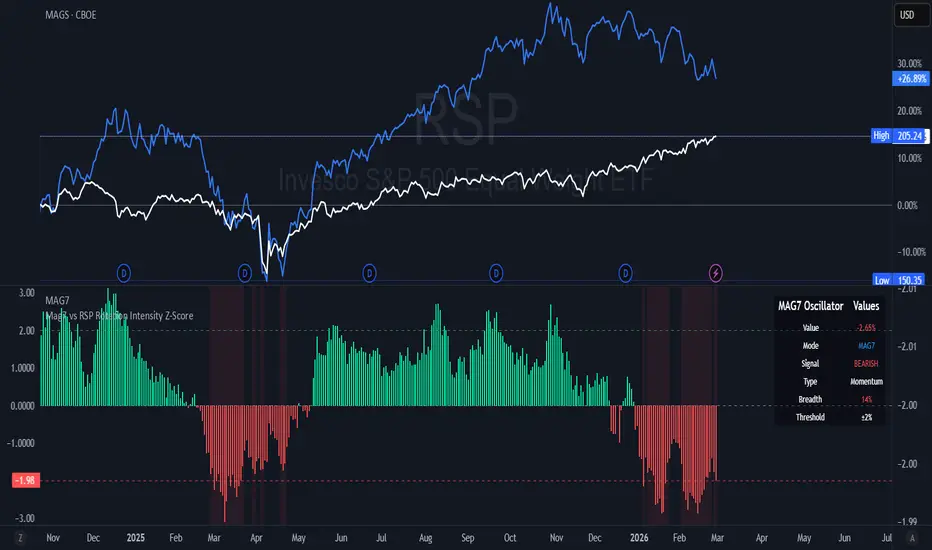
Calculates how extreme the current Mag7 underperformance is compared to the last 63 trading days (~3 months).
Formula (standard statistical Z-score): ratio = log(Mag7 price / RSP price)
mean = average of that ratio over the last 63 days
stdev = standard deviation of that ratio over the last 63 days
Z = (today’s ratio – mean) / stdev
Result plotted as colored columns (green = Mag7 outperforming, red = underperforming).
Horizontal lines at +2 and –2 mark the “extreme” zones.
Formula (standard statistical Z-score): ratio = log(Mag7 price / RSP price)
mean = average of that ratio over the last 63 days
stdev = standard deviation of that ratio over the last 63 days
Z = (today’s ratio – mean) / stdev
Result plotted as colored columns (green = Mag7 outperforming, red = underperforming).
Horizontal lines at +2 and –2 mark the “extreme” zones.

Feragatname
Bilgiler ve yayınlar, TradingView tarafından sağlanan veya onaylanan finansal, yatırım, alım satım veya diğer türden tavsiye veya öneriler anlamına gelmez ve teşkil etmez. Kullanım Koşulları bölümünde daha fazlasını okuyun.
Feragatname
Bilgiler ve yayınlar, TradingView tarafından sağlanan veya onaylanan finansal, yatırım, alım satım veya diğer türden tavsiye veya öneriler anlamına gelmez ve teşkil etmez. Kullanım Koşulları bölümünde daha fazlasını okuyun.