OPEN-SOURCE SCRIPT
Güncellendi RSI Divergence Detector
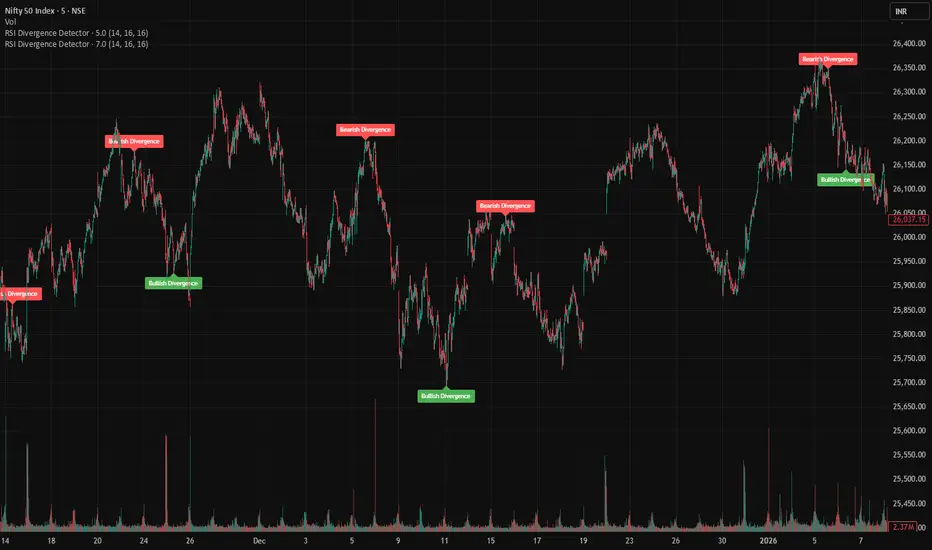
This indicator automatically detects bullish and bearish RSI divergences and displays them directly on the price chart.
A bullish divergence occurs when price forms a lower low while RSI forms a higher low, which may indicate weakening bearish momentum and a potential upward reversal.
A bearish divergence occurs when price forms a higher high while RSI forms a lower high, which may signal weakening bullish momentum and a possible downward reversal.
The script uses pivot highs and lows on both price and RSI to identify confirmed divergences and plots labels on the chart when they occur.
Inputs
RSI Length – period used to calculate RSI
Pivot Left Bars – bars required on the left to confirm a pivot
Pivot Right Bars – bars required on the right to confirm a pivot
Because pivots require confirmation, signals appear after several bars.
A bullish divergence occurs when price forms a lower low while RSI forms a higher low, which may indicate weakening bearish momentum and a potential upward reversal.
A bearish divergence occurs when price forms a higher high while RSI forms a lower high, which may signal weakening bullish momentum and a possible downward reversal.
The script uses pivot highs and lows on both price and RSI to identify confirmed divergences and plots labels on the chart when they occur.
Inputs
RSI Length – period used to calculate RSI
Pivot Left Bars – bars required on the left to confirm a pivot
Pivot Right Bars – bars required on the right to confirm a pivot
Because pivots require confirmation, signals appear after several bars.
Sürüm Notları
UpdateSürüm Notları
updatesSürüm Notları
updateSürüm Notları
updatesSürüm Notları
update: added alertAçık kaynak kodlu komut dosyası
Gerçek TradingView ruhuyla, bu komut dosyasının mimarı, yatırımcıların işlevselliğini inceleyip doğrulayabilmesi için onu açık kaynaklı hale getirdi. Yazarı tebrik ederiz! Ücretsiz olarak kullanabilseniz de, kodu yeniden yayınlamanın Topluluk Kurallarımıza tabi olduğunu unutmayın.

Feragatname
Bilgiler ve yayınlar, TradingView tarafından sağlanan veya onaylanan finansal, yatırım, alım satım veya diğer türden tavsiye veya öneriler anlamına gelmez ve teşkil etmez. Kullanım Koşulları bölümünde daha fazlasını okuyun.
Açık kaynak kodlu komut dosyası
Gerçek TradingView ruhuyla, bu komut dosyasının mimarı, yatırımcıların işlevselliğini inceleyip doğrulayabilmesi için onu açık kaynaklı hale getirdi. Yazarı tebrik ederiz! Ücretsiz olarak kullanabilseniz de, kodu yeniden yayınlamanın Topluluk Kurallarımıza tabi olduğunu unutmayın.
Feragatname
Bilgiler ve yayınlar, TradingView tarafından sağlanan veya onaylanan finansal, yatırım, alım satım veya diğer türden tavsiye veya öneriler anlamına gelmez ve teşkil etmez. Kullanım Koşulları bölümünde daha fazlasını okuyun.