OPEN-SOURCE SCRIPT
Dealing Range by EonMetrics
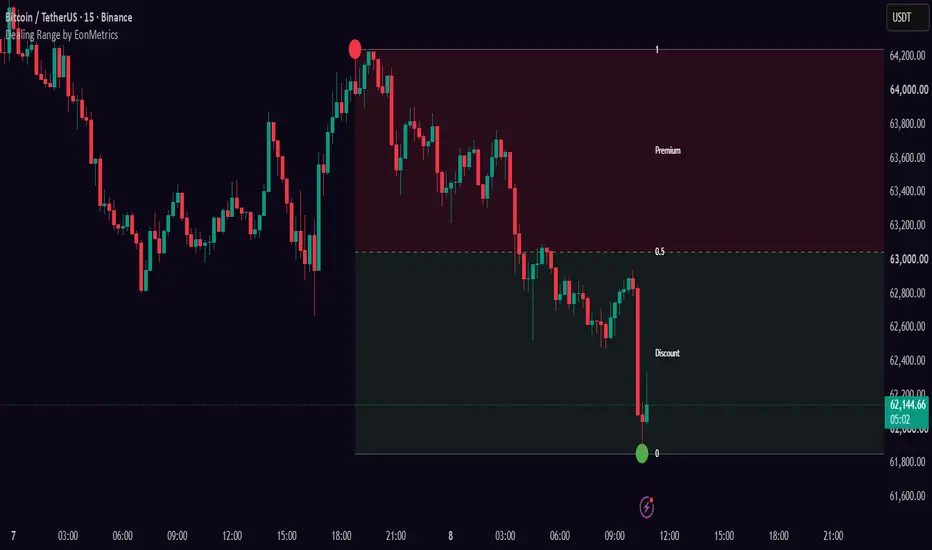
Dealing Range by EonMetrics
WHAT IT DOES
This indicator draws one box around the exact price range you're currently trading inside — from the most recent significant low up to the most recent significant high (or vice versa). It then splits that box into two halves at the exact middle: the top half is labeled "Premium" (price here is relatively expensive — a place to look for selling opportunities) and the bottom half is labeled "Discount" (price here is relatively cheap — a place to look for buying opportunities). The exact halfway line is called "Equilibrium" — a common point where price pauses or reverses.

Instead of waiting for both ends of the range to fully finish forming (which most similar tools do, and which makes the box lag behind price), one end of this box is locked to the last confirmed turning point, while the other end keeps following the live price in real time. This means the box always contains the current candle and never leaves it stranded outside — you're never looking at a stale, outdated range.
HOW TO ACTUALLY USE IT (STEP BY STEP)
1. Decide which side you want to trade, then wait for price to come to you — don't chase it in the middle of the box.
- Looking to buy (go long)? Wait for price to fall all the way down into the green Discount zone before considering an entry.
- Looking to sell (go short)? Wait for price to rise all the way up into the red Premium zone before considering an entry.
2. Once price reaches the zone you're waiting for, look for an actual trigger before entering — a reversal candle, a price gap, a small break of structure — rather than buying or selling the instant price merely touches the colored area.
3. Treat the Equilibrium (halfway) line as a "fair value" reference — price often reacts around this line before deciding its next move, so it can act as a first target or a place price pauses on the way to the far zone.
4. Watch the two dots marking the range's boundaries (0 = the low, 1 = the high) — these are the exact swing points the box is built from.
5. The box updates and can shift over time as new swings form — that's expected behavior, not a bug; it means the range is following the market's current structure.

EVERY SETTING EXPLAINED
Range Detection group
- Swing Length — how many candles on each side must be smaller/bigger for a point to count as a real turning point. A bigger number only catches major, important swings (slower-updating, bigger ranges); a smaller number catches minor ones (faster-updating, smaller ranges).
- Lock Range Until Band Break — when ON (recommended), the box stays fixed in place while price bounces around inside it, and only redraws once price actually breaks all the way out through the top or bottom. When OFF, the box updates every time a new turning point confirms, which reacts faster but can shift the box around more while you're watching it.
Visualization group
- Premium Zone — fill color of the top (expensive) half.
- Discount Zone — fill color of the bottom (cheap) half.
- Boundary Lines (0 / 1) — color of the lines marking the very top and bottom of the box.
- Show Equilibrium (50%) — turns the halfway line on or off.
- Equilibrium Color.
- Equilibrium Style — solid, dashed, or dotted line.
- Extend Right — stretches the box and lines all the way to the right edge of your chart. Turn off to have them stop at the current candle instead.
Swing Markers group
- Show Swing Points — turns on two small dots marking exactly where the box's high and low come from.
- High Swing (1) / Low Swing (0) — colors for those two dots.
Labels group
- Show Fib Levels (0 / 0.5 / 1) — labels the bottom of the box as "0", the middle as "0.5", and the top as "1" (standard reference numbers used to describe where price sits inside the range).
- Show Premium / Discount Labels — writes the words "Premium" and "Discount" inside each half.
- Show Prices — adds the actual price number next to the 0 / 0.5 / 1 labels.
- Label Position — puts the text labels on the right side (following the current candle) or the left side (where the range originally started).
- Label Text Color.
WHAT IT DOES
This indicator draws one box around the exact price range you're currently trading inside — from the most recent significant low up to the most recent significant high (or vice versa). It then splits that box into two halves at the exact middle: the top half is labeled "Premium" (price here is relatively expensive — a place to look for selling opportunities) and the bottom half is labeled "Discount" (price here is relatively cheap — a place to look for buying opportunities). The exact halfway line is called "Equilibrium" — a common point where price pauses or reverses.
Instead of waiting for both ends of the range to fully finish forming (which most similar tools do, and which makes the box lag behind price), one end of this box is locked to the last confirmed turning point, while the other end keeps following the live price in real time. This means the box always contains the current candle and never leaves it stranded outside — you're never looking at a stale, outdated range.
HOW TO ACTUALLY USE IT (STEP BY STEP)
1. Decide which side you want to trade, then wait for price to come to you — don't chase it in the middle of the box.
- Looking to buy (go long)? Wait for price to fall all the way down into the green Discount zone before considering an entry.
- Looking to sell (go short)? Wait for price to rise all the way up into the red Premium zone before considering an entry.
2. Once price reaches the zone you're waiting for, look for an actual trigger before entering — a reversal candle, a price gap, a small break of structure — rather than buying or selling the instant price merely touches the colored area.
3. Treat the Equilibrium (halfway) line as a "fair value" reference — price often reacts around this line before deciding its next move, so it can act as a first target or a place price pauses on the way to the far zone.
4. Watch the two dots marking the range's boundaries (0 = the low, 1 = the high) — these are the exact swing points the box is built from.
5. The box updates and can shift over time as new swings form — that's expected behavior, not a bug; it means the range is following the market's current structure.
EVERY SETTING EXPLAINED
Range Detection group
- Swing Length — how many candles on each side must be smaller/bigger for a point to count as a real turning point. A bigger number only catches major, important swings (slower-updating, bigger ranges); a smaller number catches minor ones (faster-updating, smaller ranges).
- Lock Range Until Band Break — when ON (recommended), the box stays fixed in place while price bounces around inside it, and only redraws once price actually breaks all the way out through the top or bottom. When OFF, the box updates every time a new turning point confirms, which reacts faster but can shift the box around more while you're watching it.
Visualization group
- Premium Zone — fill color of the top (expensive) half.
- Discount Zone — fill color of the bottom (cheap) half.
- Boundary Lines (0 / 1) — color of the lines marking the very top and bottom of the box.
- Show Equilibrium (50%) — turns the halfway line on or off.
- Equilibrium Color.
- Equilibrium Style — solid, dashed, or dotted line.
- Extend Right — stretches the box and lines all the way to the right edge of your chart. Turn off to have them stop at the current candle instead.
Swing Markers group
- Show Swing Points — turns on two small dots marking exactly where the box's high and low come from.
- High Swing (1) / Low Swing (0) — colors for those two dots.
Labels group
- Show Fib Levels (0 / 0.5 / 1) — labels the bottom of the box as "0", the middle as "0.5", and the top as "1" (standard reference numbers used to describe where price sits inside the range).
- Show Premium / Discount Labels — writes the words "Premium" and "Discount" inside each half.
- Show Prices — adds the actual price number next to the 0 / 0.5 / 1 labels.
- Label Position — puts the text labels on the right side (following the current candle) or the left side (where the range originally started).
- Label Text Color.
Açık kaynak kodlu komut dosyası
Gerçek TradingView ruhuyla, bu komut dosyasının mimarı, yatırımcıların işlevselliğini inceleyip doğrulayabilmesi için onu açık kaynaklı hale getirdi. Yazarı tebrik ederiz! Ücretsiz olarak kullanabilseniz de, kodu yeniden yayınlamanın Topluluk Kurallarımıza tabi olduğunu unutmayın.

Feragatname
Bilgiler ve yayınlar, TradingView tarafından sağlanan veya onaylanan finansal, yatırım, alım satım veya diğer türden tavsiye veya öneriler anlamına gelmez ve teşkil etmez. Kullanım Koşulları bölümünde daha fazlasını okuyun.
Açık kaynak kodlu komut dosyası
Gerçek TradingView ruhuyla, bu komut dosyasının mimarı, yatırımcıların işlevselliğini inceleyip doğrulayabilmesi için onu açık kaynaklı hale getirdi. Yazarı tebrik ederiz! Ücretsiz olarak kullanabilseniz de, kodu yeniden yayınlamanın Topluluk Kurallarımıza tabi olduğunu unutmayın.
Feragatname
Bilgiler ve yayınlar, TradingView tarafından sağlanan veya onaylanan finansal, yatırım, alım satım veya diğer türden tavsiye veya öneriler anlamına gelmez ve teşkil etmez. Kullanım Koşulları bölümünde daha fazlasını okuyun.