Support & Resistance Zones with Volume Profile and Anchor Levels
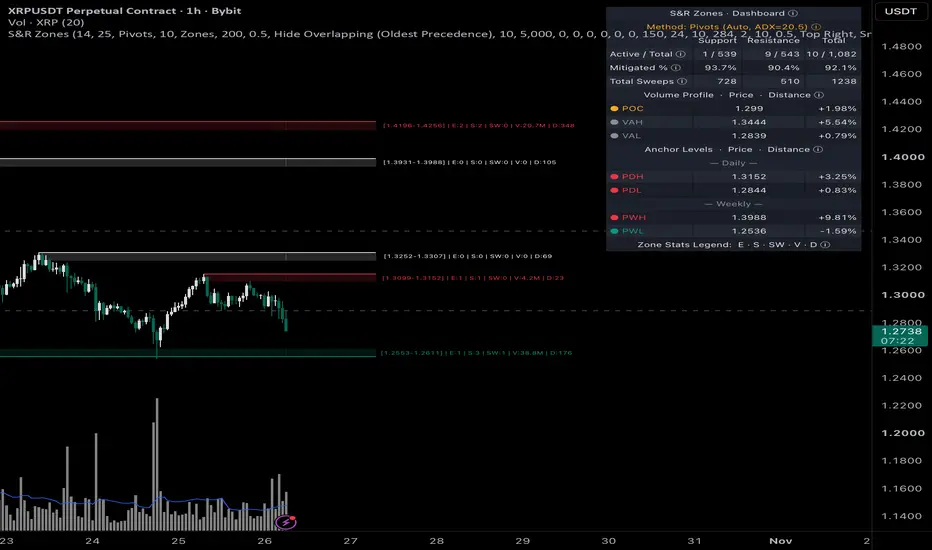
Support & Resistance Zones with Volume Profile and Anchor Levels.
Detects support and resistance zones from swing pivots or a Donchian channel, tracks how each zone is tested, swept and broken, and summarises the volume profile and previous day / week / month highs and lows in a single dashboard. Built for traders who want structural levels qualified by touches, sweeps and traded volume rather than by visual judgement.
How it works:
Zones are detected by one of two methods. Pivots marks confirmed swing highs and lows over the Swing Sensitivity window; Donchian tracks the running extreme of each channel leg and emits it as a pivot when the channel direction changes. In Auto mode the method is selected on every bar by ADX: Donchian at or above the threshold, Pivots below it. All pivot and channel series are evaluated on every bar regardless of the active method, so switching between methods does not produce pivots at stale prices. Each zone extends from the pivot price by Zone Depth x ATR. Overlapping zones of the same type are skipped, merged or hidden according to Overlap Handling, and zones created with a start bar in the past are replayed against history so that zones already broken by a close are not shown as active.
On every bar each stored zone is checked for a close beyond its boundary (mitigation), and active zones accumulate touches, sweeps and traded volume. Zones without traded volume are drawn in white as untested and switch to the support or resistance color once volume accumulates. Active zones can be extended to the right of the current bar using time-based anchors, with a statistics label at the end of the extension. The volume profile is calculated on the last bar over the POC Lookback window: each candle's volume is distributed across price buckets in proportion to the overlap of its body and wicks, with wicks weighted x2. Previous period highs and lows are requested with request.security(sym, "D" / "W" / "M", [high[1], low[1]], lookahead = barmerge.lookahead_on); when the chart timeframe exceeds the period, the values are rebuilt from request.security_lower_tf so they remain correct on any timeframe.
What it calculates:
- Support zones — areas below swing lows, depth set as an ATR multiple.
- Resistance zones — areas above swing highs, depth set as an ATR multiple.
- E (Entries) — number of touches of a zone with the close remaining inside or on the correct side.
- SW (Sweeps) — wicks beyond the zone edge with the close returning inside.
- S (Strength) — E + SW x 2.
- V (Volume) — total volume traded inside the zone over its lifetime.
- D (Duration) — zone age in bars, or its lifetime until it was broken.
- Active / Total — active zones and all zones detected over the loaded history, per side.
- Mitigated % — share of detected zones that have been broken, per side and in total.
- Total Sweeps — cumulative sweep count, per side and in total.
- POC — midpoint of the highest-volume bucket in the profile window.
- VAH / VAL — upper and lower boundaries of the area containing 70% of profile volume.
- PDH / PDL, PWH / PWL, PMH / PML — previous day, week and month highs and lows, with signed percentage distance to the current close.
- Secondary levels — pivot prices clustered within a corridor of the lookback range, shown as dashed lines on 1H and higher timeframes.
Key features:
- Automatic method selection by ADX, or a fixed manual method.
- Zones or plain levels display style.
- Overlap handling: none, merge, or hide by oldest or youngest precedence.
- Limit on the number of active zones, optional display of broken zones.
- Minimum-requirement filters by entries, strength, sweeps, traded volume and age.
- Optional swing, sweep and breakout markers.
- Right-side extension of active zones with a statistics label and an adjustable label spacing to avoid overlapping labels.
- Secondary levels that are suppressed when they duplicate an active zone within a configurable ATR radius.
- Volume profile values blanked automatically on instruments that report no volume.
- Previous day / week / month levels colored by price position relative to each level.
- Dashboard with three positions, five text sizes, zebra rows and explanatory tooltips on every section.
- Every color exposed as an input.
Who it's for:
Intraday and swing traders who work with support and resistance, liquidity sweeps and volume profile in price-action, SMC and ICT methodologies, and who want each level qualified by how the market has actually interacted with it. The result is a structured set of zones and reference prices on one chart, without the visual noise of several overlapping tools.
Detects support and resistance zones from swing pivots or a Donchian channel, tracks how each zone is tested, swept and broken, and summarises the volume profile and previous day / week / month highs and lows in a single dashboard. Built for traders who want structural levels qualified by touches, sweeps and traded volume rather than by visual judgement.
How it works:
Zones are detected by one of two methods. Pivots marks confirmed swing highs and lows over the Swing Sensitivity window; Donchian tracks the running extreme of each channel leg and emits it as a pivot when the channel direction changes. In Auto mode the method is selected on every bar by ADX: Donchian at or above the threshold, Pivots below it. All pivot and channel series are evaluated on every bar regardless of the active method, so switching between methods does not produce pivots at stale prices. Each zone extends from the pivot price by Zone Depth x ATR. Overlapping zones of the same type are skipped, merged or hidden according to Overlap Handling, and zones created with a start bar in the past are replayed against history so that zones already broken by a close are not shown as active.
On every bar each stored zone is checked for a close beyond its boundary (mitigation), and active zones accumulate touches, sweeps and traded volume. Zones without traded volume are drawn in white as untested and switch to the support or resistance color once volume accumulates. Active zones can be extended to the right of the current bar using time-based anchors, with a statistics label at the end of the extension. The volume profile is calculated on the last bar over the POC Lookback window: each candle's volume is distributed across price buckets in proportion to the overlap of its body and wicks, with wicks weighted x2. Previous period highs and lows are requested with request.security(sym, "D" / "W" / "M", [high[1], low[1]], lookahead = barmerge.lookahead_on); when the chart timeframe exceeds the period, the values are rebuilt from request.security_lower_tf so they remain correct on any timeframe.
What it calculates:
- Support zones — areas below swing lows, depth set as an ATR multiple.
- Resistance zones — areas above swing highs, depth set as an ATR multiple.
- E (Entries) — number of touches of a zone with the close remaining inside or on the correct side.
- SW (Sweeps) — wicks beyond the zone edge with the close returning inside.
- S (Strength) — E + SW x 2.
- V (Volume) — total volume traded inside the zone over its lifetime.
- D (Duration) — zone age in bars, or its lifetime until it was broken.
- Active / Total — active zones and all zones detected over the loaded history, per side.
- Mitigated % — share of detected zones that have been broken, per side and in total.
- Total Sweeps — cumulative sweep count, per side and in total.
- POC — midpoint of the highest-volume bucket in the profile window.
- VAH / VAL — upper and lower boundaries of the area containing 70% of profile volume.
- PDH / PDL, PWH / PWL, PMH / PML — previous day, week and month highs and lows, with signed percentage distance to the current close.
- Secondary levels — pivot prices clustered within a corridor of the lookback range, shown as dashed lines on 1H and higher timeframes.
Key features:
- Automatic method selection by ADX, or a fixed manual method.
- Zones or plain levels display style.
- Overlap handling: none, merge, or hide by oldest or youngest precedence.
- Limit on the number of active zones, optional display of broken zones.
- Minimum-requirement filters by entries, strength, sweeps, traded volume and age.
- Optional swing, sweep and breakout markers.
- Right-side extension of active zones with a statistics label and an adjustable label spacing to avoid overlapping labels.
- Secondary levels that are suppressed when they duplicate an active zone within a configurable ATR radius.
- Volume profile values blanked automatically on instruments that report no volume.
- Previous day / week / month levels colored by price position relative to each level.
- Dashboard with three positions, five text sizes, zebra rows and explanatory tooltips on every section.
- Every color exposed as an input.
Who it's for:
Intraday and swing traders who work with support and resistance, liquidity sweeps and volume profile in price-action, SMC and ICT methodologies, and who want each level qualified by how the market has actually interacted with it. The result is a structured set of zones and reference prices on one chart, without the visual noise of several overlapping tools.

Feragatname
Bilgiler ve yayınlar, TradingView tarafından sağlanan veya onaylanan finansal, yatırım, alım satım veya diğer türden tavsiye veya öneriler anlamına gelmez ve teşkil etmez. Kullanım Koşulları bölümünde daha fazlasını okuyun.
Feragatname
Bilgiler ve yayınlar, TradingView tarafından sağlanan veya onaylanan finansal, yatırım, alım satım veya diğer türden tavsiye veya öneriler anlamına gelmez ve teşkil etmez. Kullanım Koşulları bölümünde daha fazlasını okuyun.