Enhanced High-Scan RSI ProOverview
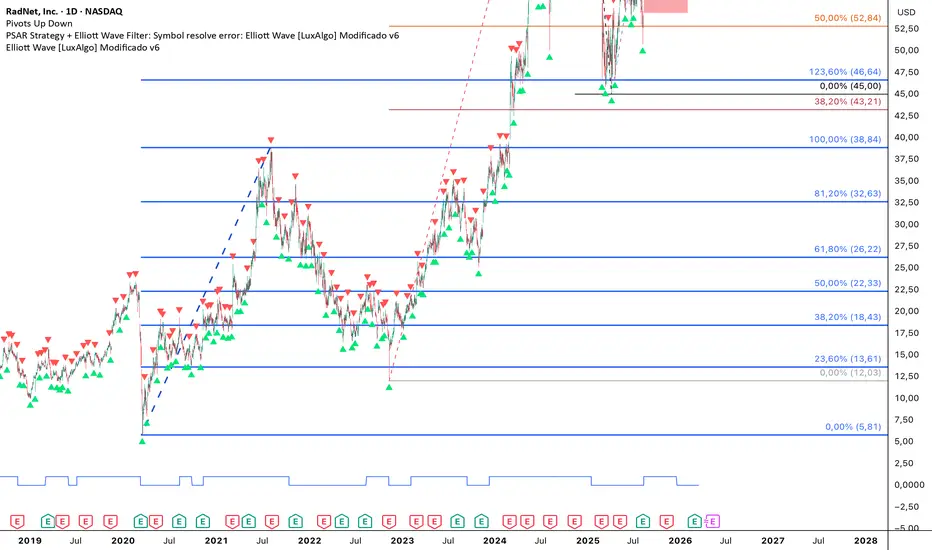
This indicator is designed for professional traders who require clean, high-precision Support and Resistance levels without the "staircase" clutter found in standard pivot indicators. It focuses on the "Tide and Waves" philosophy, distinguishing between major institutional levels and minor intraday hurdles.
Built for high-speed scanning, it features an Ingenious Polarity Flip engine that automatically detects when a "broken" level has overturned its role (Support becoming Resistance and vice versa), highlighting potential retest zones in real-time.
Key Features
Dynamic Polarity (Overture) Detection: Unlike static lines, this script monitors price interaction. When a major level is breached, the line color transforms (e.g., to Yellow) to signal an S/R Flip, identifying high-probability zones for "break and retest" strategies.
Institutional vs. Retail Hierarchy: * Major Levels (Solid Bold): Represent long-term historical significance (The Tide).
Minor Levels (Thin Dashed): Highlight recent intraday swings (The Waves).
Clean Geometry Engine: Uses advanced array management to delete old, irrelevant lines. The result is a clean chart where lines float forward into the future space, providing clear targets for Stop Loss and Take Profit.
Fully Refined Settings: Every aspect is customizable, including lookback periods, line limits, colors, and styles, allowing you to tailor the "strength" of the levels to any asset (Forex, Crypto, or Stocks).
How to Use
Identify the Trend: Watch the Major Levels to determine the primary market boundaries.
Spot the Reversal: Look for price exhaustion near the Major Support (Green).
The Retest Play: When a level turns Yellow, it indicates an S/R Flip. This is your cue to look for a retest of that level to confirm a breakout or a trend continuation.
Risk Management: Use Minor Levels (Dashed) for precise Stop Loss placement or as immediate intraday targets.
Technical Specifications
Version: Pine Script v6 (Latest)
Compatibility: Optimized for all timeframes (Best results on 1H, 4H, and Daily).
Performance: Uses lightweight array logic to ensure zero lag, even on lower-end machines. Gösterge

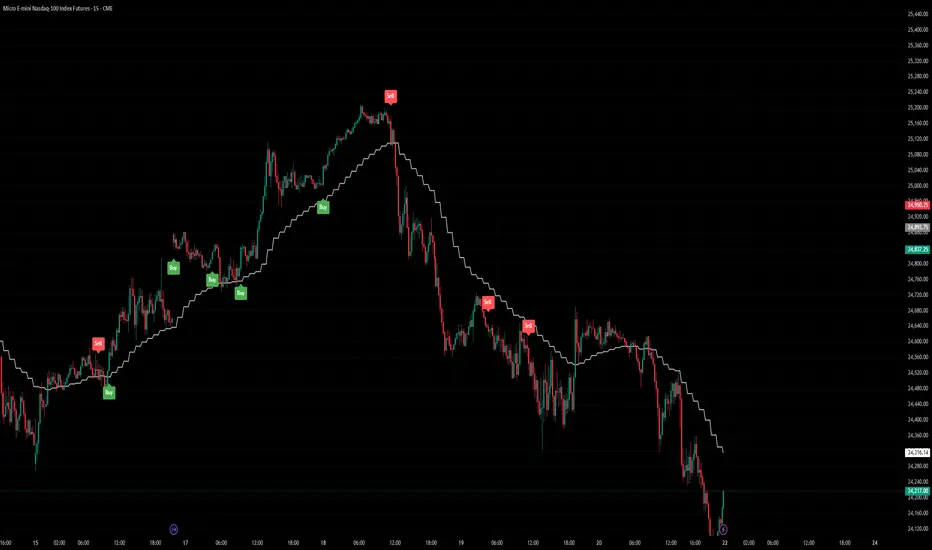
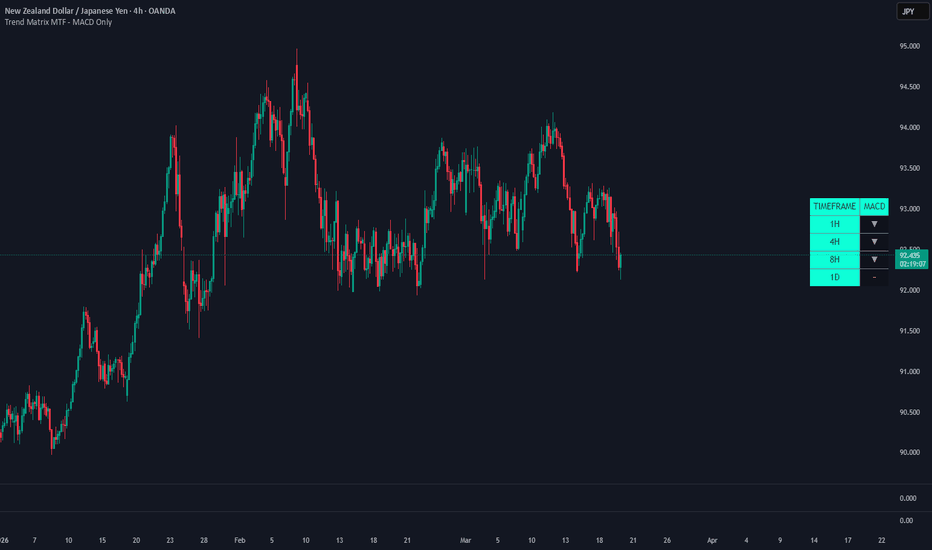
AYN-Replicated [Ryan] v4 + HTF BiasThe modified AYN Ryan script is a TradingView Pine Script strategy built to turn the original AYN-style visual trend and reversal logic into a testable, rules-based trading system. It is designed to identify bullish and bearish entry opportunities using the script’s custom trend calculations, cross or flip conditions, and confirmation filters, then automatically manage trades with defined stop-loss and take-profit rules rather than just plotting signals on the chart. In your versions, the script has been adjusted to improve stability, reduce false triggers, and better suit fast intraday futures trading by tuning sensitivity inputs such as cross strength, flip confirmation, ATR-based risk controls, and trade timing behaviour, while also focusing on practical issues like making sure both long and short setups work properly, avoiding over-filtering that kills all trades, and forcing positions to close within your session rules instead of holding overnight. Gösterge

Gösterge

Gösterge

Gösterge

Gösterge

Gösterge

Gösterge

Gösterge

Gösterge

Gösterge
Day-of-Week EffectWhat the script does
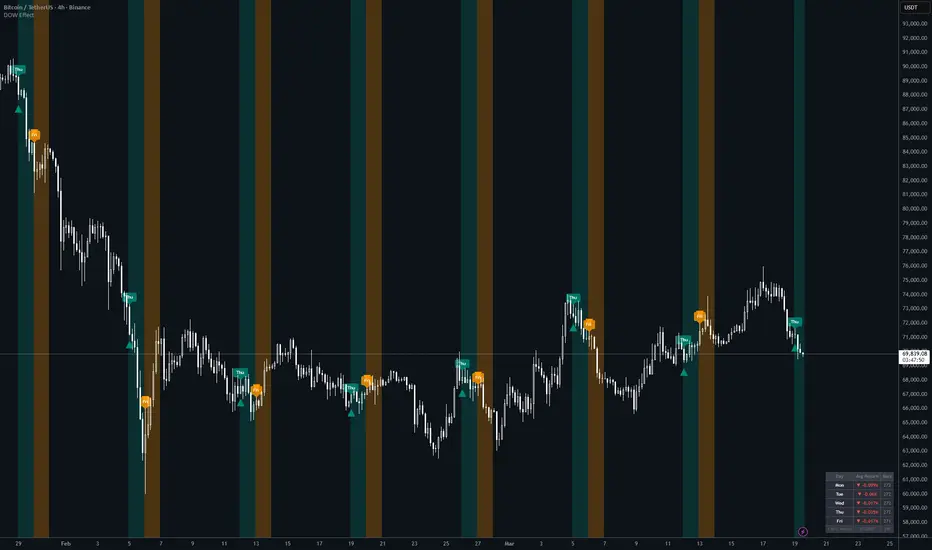
The Day-of-Week Effect indicator visualises a well-known market anomaly: certain days of the week produce statistically different average returns. The script identifies your chosen entry and exit days on any chart, highlights them visually, and calculates the historical average close-to-close return for every weekday — so you can see at a glance whether the effect actually holds on your chosen instrument.
How it works
On each bar, the script reads the day of the week using Pine Script's built-in dayofweek variable. It detects the first bar of each new trading day using ta.change(time("D")), which prevents signals from firing on every intraday bar if you're on a sub-daily timeframe. It then accumulates a running sum and count of close-to-close returns per weekday across the entire chart history, dividing them at the last bar to produce the average return table.
How to use it
Open TradingView, paste the script into the Pine Editor and click "Add to chart." The indicator works best on the 1D timeframe. In the Settings panel, toggle which days you want highlighted as entry days (teal) and exit days (orange)
Use the stats table in the bottom-right to identify which days have historically been strongest on your instrument
Tthen configure your entry/exit days accordingly
The display settings let you turn off labels, background shading, or the table independently
Why it's original
Most DOW indicators simply colour-code days. This one goes further by pairing the visual highlighting with a live per-weekday return breakdown calculated directly from your chart's own price history — so rather than applying a generic market assumption, you're validating the effect on your specific ticker and timeframe before acting on it.
Alerts
The script does not currently include alertcondition() calls. To add alerts, you can extend the script with:
alertcondition(is_new_day and is_entry_day, title="Entry Day", message="DOW entry day opened")
alertcondition(is_new_day and is_exit_day, title="Exit Day", message="DOW exit day opened")
Gösterge

Gösterge

Gösterge

Super AlligatorSuper Alligator 🐊 — A Bill Williams Tribute
Built on the shoulders of a legend.
The Origin
Bill Williams introduced the Alligator indicator in his 1995 book Trading Chaos as a way to identify trending markets and filter out the noise of consolidation. Three smoothed moving averages — offset forward in time — behave like the jaw, teeth, and lips of an alligator.
When the lines are intertwined, the alligator sleeps. The market is ranging, there is no edge, and most traders are losing money fighting the noise. When the lines fan apart, the alligator is awake and feeding — a trend is in motion and momentum is real. Williams argued that up to 70% of price action is consolidation. The Alligator's job is to keep you out of it.
In memory of Bill Williams (1932–2019) — trader, psychologist, and one of the most original thinkers in technical analysis.
What Super Alligator Adds
The classic Alligator tells you when a trend exists. Super Alligator adds two layers on top:
1. Gap-based momentum confirmation
The distance between the closing candle and the green (Lips) line acts as a confirmation gate. The alligator opening its mouth is the setup. Price pulling away from the green line is the confirmation. You control exactly how much distance is required — meaning you control the sensitivity.
2. Intraday trend filters
VWAP and a configurable SMA act as directional filters. Signals only fire when price is on the correct side of these levels, reducing counter-trend noise significantly.
Signal Logic
A BUY signal fires when all of the following are true:
Lips (green) is above Jaw (blue) — bullish fan
Close is above the green line by at least your gap threshold
Close is above VWAP (if enabled)
Close is above SMA (if enabled)
A SELL signal fires when the inverse is true:
Jaw (blue) is above Lips (green) — bearish fan
Close is below the green line by at least your gap threshold
Close is below VWAP (if enabled)
Close is below SMA (if enabled)
Signals fire once — on the first bar all conditions align. They do not repaint.
The Gap Setting — Your Sensitivity Control
The Min Gap (%) is the most important input. It scales automatically to whatever instrument you're trading.
Futures:
NQ (~25,000) — 0.10% = ~25 pts / 0.20% = ~50 pts / 0.30% = ~75 pts
ES (~5,500) — 0.10% = ~5.5 pts / 0.20% = ~11 pts / 0.30% = ~16.5 pts
Crypto:
Bitcoin (~85,000) — 0.10% = ~$85 / 0.20% = ~$170 / 0.30% = ~$255
Forex:
EUR/USD (~1.08) — 0.10% = ~10 pips / 0.20% = ~21 pips
Equities/ETFs:
SPY (~550) — 0.10% = ~$0.55 / 0.20% = ~$1.10
Start at 0.10% and adjust. Too many signals → increase. No signals → decrease.
NOTE: The above are just examples. Not limited to just those examples.
Filter Guide
VWAP Filter
Recommended ON for all intraday timeframes (1m through 1H). VWAP resets daily and represents the market's intraday fair value. Turn OFF on daily/weekly charts.
SMA Filter
OFF by default. Most useful on higher timeframes (4H, Daily) as a macro trend filter. On lower intraday timeframes a long-period SMA sits too far from price to be a useful signal filter — particularly for sells in instruments in long-term uptrends. If using intraday, reduce to 50–100.
Recommended Starting Settings
1m – 5m charts: VWAP on / SMA off / Gap 0.05–0.10%
15m – 1H charts: VWAP on / SMA optional (50–100) / Gap 0.10–0.20%
4H – Daily charts: VWAP off / SMA on (200) / Gap 0.15–0.30%
Notes
This is a signal tool, not a trading system. Use it alongside your own levels, risk management, and market context.
Signals do not repaint — they fire once and do not move.
Built-in alerts for both BUY and SELL. Set them up via TradingView's alert system after adding to your chart.
Works on all instruments and timeframes.
Gösterge

Gösterge

Gösterge

Gösterge
Gösterge

APEX ELITE . 2━━━━━━━━━━━━━━━━━━━━━━━━━━━━━━━━━━━━━━━━━━━━━━━━━━━━━━━━━━━━━
◈ APEX ELITE . 2
Open Source Pine Script v6 · Panel-Only Edition · Zero Chart Clutter
━━━━━━━━━━━━━━━━━━━━━━━━━━━━━━━━━━━━━━━━━━━━━━━━━━━━━━━━━━━━━
⚠️ NOT FINANCIAL ADVICE — See full disclaimer at the bottom.
━━━━━━━━━━━━━━━━━━━━━━━━━━━━━━━━━━━━━━━━━━━━━━━━━━━━━━━━━━━━━
WHAT IS APEX ELITE?
━━━━━━━━━━━━━━━━━━━━━━━━━━━━━━━━━━━━━━━━━━━━━━━━━━━━━━━━━━━━━
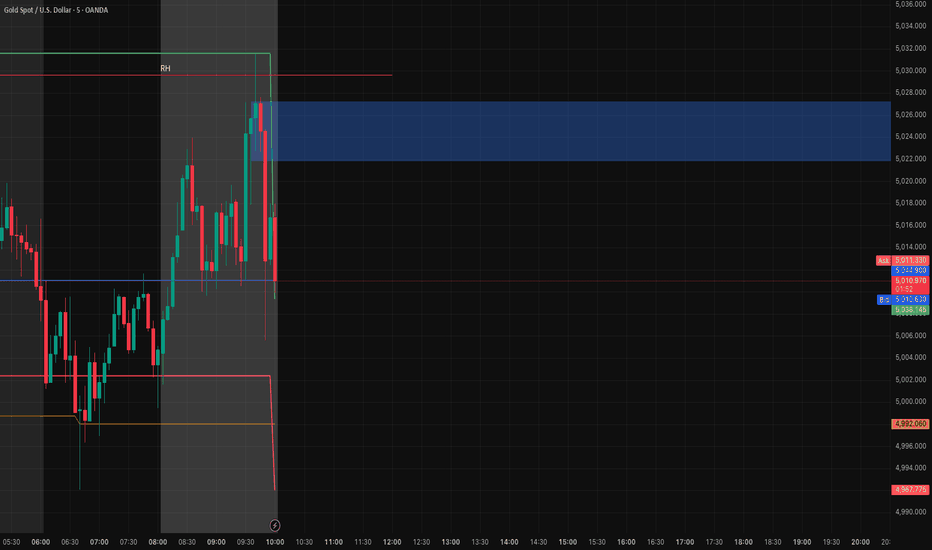
APEX ELITE is a single, unified intraday dashboard that replaces what would otherwise require 8 or more separate indicators. Everything runs internally and surfaces through one clean, color-coded panel. Your chart stays completely uncluttered — no extra lines, no overlapping boxes, no noise.
Built specifically for intraday traders who need instant situational awareness:
→ Is there a signal right now?
→ What is the trend across multiple timeframes?
→ Where are the key levels?
→ How strong is the current edge?
All of that — answered in a single glance at the panel.
🔑 Key principles:
• All signals fire on confirmed bars only — zero repainting
• 12+ factors combine into one composite score before any signal fires
• Session clock tracks 8 intraday phases so you always know the market context
• Compact Mode available for smaller screens
• 22 configurable alert conditions built in
━━━━━━━━━━━━━━━━━━━━━━━━━━━━━━━━━━━━━━━━━━━━━━━━━━━━━━━━━━━━━
THE 12 MODULES — COMPLETE BREAKDOWN
━━━━━━━━━━━━━━━━━━━━━━━━━━━━━━━━━━━━━━━━━━━━━━━━━━━━━━━━━━━━━
▸ BLOCK A — SIGNAL COMMAND
───────────────────────────
The top block of the panel. Shows the current signal state in large text — ▲ CALL SIGNAL, ▼ PUT SIGNAL, or ● WATCHING — along with the live composite edge score and directional bias.
• Signal State: CALL / PUT / WATCHING — updates every confirmed bar
• Edge Direction: BULL / BEAR / NEUT with score out of 100 (e.g. "BULL 82/100")
• Edge Bar: 10-block visual bar showing edge % (████████░░)
• Bull / Bear pts: Raw scores shown side-by-side for comparison
The background color of this row changes: green for CALL, red for PUT, neutral for watching.
▸ BLOCK B — INTRADAY LEVELS
────────────────────────────
Every key price level an intraday trader needs, all in one place.
• VWAP Zone: Which of 6 zones price is in — Above +2σ / +1→+2σ / VWAP→+1σ / -1→VWAP / -2→-1σ / Below -2σ
• VWAP Distance: Real-time % distance of close from VWAP (e.g. +0.42% dist)
• PMH / PML: Pre-Market High and Low — the most important intraday reference levels. A break of PMH or PML triggers the maximum +20 trigger points.
• FCH / FCL: First Candle High and Low (configurable: 1/2/3/5/15 min). Also shows the first candle's range as a %.
• Supply / Demand: Nearest unmitigated supply zone above price and demand zone below price — with total active zone count.
• Level Break: Live readout when PMH, PML, FCH, or FCL is broken on the current bar.
▸ BLOCK C — MOMENTUM STACK
───────────────────────────
A complete multi-timeframe picture of trend alignment.
• SMA 9 (cyan): Short-term momentum MA. Above = bullish micro trend.
• SMA 21 (gold): Medium momentum MA. The primary intraday trend filter.
• SMA 50 (orange): Intermediate trend. Pullback entries reference this level.
• SMA 200 (red): Long-term macro trend. Above = bull market context.
• MA Alignment: Count of MAs on each side (e.g. 4/4 bull). Full stack = strongest signal.
• MA Stack Order: Full Bull Stack confirmed when 9 > 21 > 50 > 200 all correctly ordered.
• EMA Ribbon: EMA 8 vs EMA 21 — ribbon direction shows short-term momentum.
• MTF Alignment: Per-timeframe arrows (▲5m ▲15m ▼1h) — instantly see each TF at a glance.
• Daily Context: Daily EMA 9 vs EMA 21 — trade with the daily trend for the highest quality setups.
Tip: MTF 3/3 aligned + MA 4/4 bull + daily EMA bull = the highest conviction entries.
▸ BLOCK D — MARKET STRUCTURE
──────────────────────────────
The highest-conviction trigger events in the system.
• Liquidity Sweep: Price briefly violates a 20-bar extreme before reversing — a classic stop hunt. Tracks age in bars (e.g. "▲ Bull (3b ago)").
• Structure Break (MSB): Close crosses a confirmed 10-bar pivot high or low. The strongest directional confirmation. Also tracks age.
• Squeeze: Bollinger Bands contracting inside Keltner Channels = coiling volatility. Shows bars coiling. Fires on expansion.
• Squeeze Momentum: Rising / Falling / Flat direction of momentum during the squeeze.
• ADX: Average Directional Index — Strong (>30) / Trending (20-30) / Choppy (<20).
• DI+ / DI-: Split readout showing directional pressure.
Both Sweeps and MSBs add the maximum trigger bonus (+20 pts) to the score.
▸ BLOCK E — RISK ENGINE
────────────────────────
Everything needed to size and manage a trade the moment a signal appears.
• ATR 14: 14-period Average True Range — raw volatility in price points.
• Stop 1× / 1.5× / 2×: Three stop-loss distances pre-calculated simultaneously. Choose based on your risk tolerance.
• Volume Ratio: Current volume as a multiple of the 20-bar average (e.g. 1.8× avg).
• Volume: "▲ SPIKE" label when volume clears your configured threshold. "Normal" otherwise.
• RSI 14: 14-period RSI with contextual labels — OB (>70), OS (<30), Elevated, Depressed, Neutral.
▸ BLOCK F — LIQUIDITY HEATMAP
( Inspired by BigBeluga — Dynamic Liquidity HeatMap Profile )
──────────────────────────────────────────────────────────────
This module is inspired by the methodology from BigBeluga's excellent Dynamic Liquidity HeatMap Profile indicator. It uses ATR-normalized, volume-weighted pivot analysis over a configurable lookback (default 300 bars) to determine whether buy-side or sell-side liquidity is dominant.
• Liq Bias: Buy-Side / Sell-Side / Balanced — with dominant side percentage (e.g. "Buy-Side 73%")
• Vol Intensity: Graphical bar (▓▓▓░░) showing current volume activity as % of the 300-bar max
• Score Impact: +5 bull score when buy-side > 60% · +5 bear score when sell-side > 60%
Full credit to BigBeluga for the original concept. Please visit and support their work.
▸ BLOCK G — REVERSAL PROBABILITY ZONE
( Inspired by LuxAlgo — Reversal Probability Zone & Levels )
──────────────────────────────────────────────────────────────
This module ports the exact algorithmic core of LuxAlgo's Reversal Probability Zone & Levels indicator. It builds two separate databases of historical swing moves — one bullish, one bearish — tracking both the price magnitude and bar duration of every confirmed pivot. From these it calculates statistical percentile targets for the most likely next move.
• Forecast Bias: ▲ Bull or ▼ Bear — direction expected after the last pivot
• 25th / 50th Percentile: Conservative and median price targets (e.g. 518.40 / 521.20)
• 75th / 90th Percentile: Aggressive and maximum targets (e.g. 524.80 / 528.50)
• Duration: Expected bar count to reach each target (e.g. "8 bars / 22 bars")
• Pivot Count: Total swings tracked — more pivots = more statistically reliable readings
Full credit to LuxAlgo for the original algorithm. Licensed under CC BY-NC-SA 4.0.
▸ BLOCK H — STANDARD DEVIATION CHANNEL
────────────────────────────────────────
A linear regression channel fitted to the last N bars (default 128). Shows where price sits statistically within the current trend.
• Channel Zone: One of 6 zones — Above +2σ / +1→+2σ / Mid→+1σ / -1→Mid / -2→-1σ / Below -2σ
• Trend Direction: Rising / Falling / Flat based on the regression slope
• Pearson R: Correlation coefficient. Above 0.8 = very clean trend. Below 0.5 = noisy/ranging.
• Midline Distance: % distance of close from the regression center line
Best CALL zone: "Mid → +1σ" on a rising channel.
Best PUT zone: "Mid → -1σ" on a falling channel.
Avoid entries when zone shows "Above +2σ" or "Below -2σ" — price is statistically extended.
▸ BLOCK I — RSI DIVERGENCE
( Libertus Method )
─────────────────────────────────────────────
Detects bull and bear RSI divergences by comparing price swing extremes against RSI swing extremes over a configurable lookback window (default 90 bars).
• Bull Divergence: Price makes lower low but RSI makes higher low — hidden strength, potential reversal up
• Bear Divergence: Price makes higher high but RSI makes lower high — hidden weakness, potential reversal down
• Age Tracking: "Bull Div (3b ago)" or "Bull Div ✦ NOW" — shows exactly how fresh the divergence is
• RSI Value: Current reading with OB / OS labels
• Score Bonus: +5 bull score on bull divergence · +5 bear score on bear divergence
Credit to Libertus for the divergence detection methodology.
▸ BLOCK J — SESSION CLOCK
──────────────────────────
Intraday trading is entirely timing-dependent. This block tracks 8 distinct market phases, each color-coded by typical volatility profile.
PRE-MKT → 4:00 – 9:30 AM ET (PMH/PML building)
OPEN (HOD/LOD) → 9:30 – 10:00 AM ET (highest volatility, initial direction)
AM SESSION → 10:00 – 11:30 AM ET (best signal quality window)
LUNCH APPROACH → 11:30 – 12:00 PM ET (momentum slowing)
LUNCH CHOP → 12:00 – 1:30 PM ET (avoid new entries)
PM SESSION → 1:30 – 2:30 PM ET (trend continuation or reversal)
POWER HOUR NEAR → 2:30 – 3:00 PM ET (institutional activity increasing)
POWER HOUR → 3:00 – 4:00 PM ET (highest volume, strongest moves)
Also shows time remaining in RTH. Turns gold when less than 60 minutes remain.
▸ BLOCK K — COMPOSITE EDGE SCORE
───────────────────────────────────
Instead of just showing one number, this block breaks the score into individual factor bars — each showing exactly how much it is contributing. You can see not just THAT the score is high, but WHY.
VWAP → ████░ (max 15 pts)
MTF → █████ (max 15 pts)
MA → ████░ (max 12 pts)
Momentum → ███░░ (max 5 pts)
Volume → ██░░░ (max 10 pts)
Trigger → █████ (max 20 pts ← most important)
ADX → ████░ (max 8 pts)
Edge → ████░ (overall 0-100)
A high score driven purely by momentum without a trigger event is weaker than one with everything aligned.
▸ BLOCK L — FRACTAL BASE
( Inspired by LuxAlgo — Fractal Base Indicator )
──────────────────────────────────────────────────
This module ports the core logic from LuxAlgo's Fractal Base Indicator. A fractal is a confirmed swing pivot where price has N bars of context on both sides — these represent the most significant recent support and resistance levels because they show where price genuinely reversed.
• Fractal Res: Last confirmed fractal HIGH — price + bars since + % distance from close
• Fractal Sup: Last confirmed fractal LOW — price + bars since + % distance from close
• Price Bias: "Above Res" (price broke resistance) / "Below Sup" (broke support) / "In Range" (between levels)
• Fractal Event: "New High Fractal" or "New Low Fractal" when a new fractal confirms this bar
• Score Bonus: +4 pts near fractal support/resistance · +3 pts when level is broken
• Configurable: Fractal Periods input — 2 = 5-bar fractal (default), 1 = 3-bar, 3 = 7-bar
Full credit to LuxAlgo for the original indicator concept.
━━━━━━━━━━━━━━━━━━━━━━━━━━━━━━━━━━━━━━━━━━━━━━━━━━━━━━━━━━━━━
THE SCORING ENGINE
━━━━━━━━━━━━━━━━━━━━━━━━━━━━━━━━━━━━━━━━━━━━━━━━━━━━━━━━━━━━━
Bull and bear scores are calculated independently on every confirmed bar. A signal only fires when the score clears the threshold AND key filters are simultaneously met.
COMPONENT MAX PTS CONDITION
────────────────────────────────────────────────────────────
VWAP Zone 15 / 8 15 inside ±1σ · 8 correct side outside band
MTF Alignment 15 / 8 15 all 3 TFs aligned · 8 for 2 of 3
MA Alignment 12/7/3 12 for 4/4 · 7 for 3/4 · 3 for 2/4
EMA Ribbon 5 EMA 8 vs 21 direction
Volume Spike 10 Volume > mult × 20-bar avg AND correct direction
Trigger Event 20 ★ PMH/PML/FCH/FCL break · Sweep · MSB
ADX Strength 8 / 5 8 if ADX >30 · 5 if ADX 20-30
Squeeze Fire 5 Squeeze fires in signal direction
ABC Harmonic 5 Active harmonic pattern aligned
RSI Zone 5 RSI 50-70 for bull · 30-50 for bear
RSI Divergence 5 Bull/bear divergence active
Liq HeatMap Bias 5 Buy/sell-side >60%
Std Dev Channel 4 Price in sweet zone on correct trend
Daily EMA Trend 4 Daily chart EMA alignment
S/D Zone Proximity 3 Within 0.3% of demand (bull) or supply (bear)
Fractal Proximity 4 / 3 Within 0.25% of fractal level / level broken
────────────────────────────────────────────────────────────
★ Trigger Event carries the most weight. A signal without a trigger is unlikely to fire.
DEFAULT THRESHOLD: 65 pts
Raise to 75+ for fewer but higher-quality signals.
Lower to 55 on very active trending days.
━━━━━━━━━━━━━━━━━━━━━━━━━━━━━━━━━━━━━━━━━━━━━━━━━━━━━━━━━━━━━
SIGNAL CONDITIONS
━━━━━━━━━━━━━━━━━━━━━━━━━━━━━━━━━━━━━━━━━━━━━━━━━━━━━━━━━━━━━
A CALL signal requires ALL of the following simultaneously:
✅ Bull score ≥ threshold
✅ Close above VWAP (hard filter)
✅ MTF alignment 2/3 or better
✅ Active trigger event (PMH break / FCH break / Bull Sweep / MSB ▲ / Squeeze bull)
✅ barstate.isconfirmed — never fires mid-bar, zero repainting
✅ RTH session active (if RTH Only setting is on)
A PUT signal requires ALL of the following simultaneously:
✅ Bear score ≥ threshold
✅ Close below VWAP (hard filter)
✅ MTF alignment 2/3 or better (bearish)
✅ Active trigger event (PML break / FCL break / Bear Sweep / MSB ▼ / Squeeze bear)
✅ barstate.isconfirmed
✅ RTH session active (if RTH Only setting is on)
━━━━━━━━━━━━━━━━━━━━━━━━━━━━━━━━━━━━━━━━━━━━━━━━━━━━━━━━━━━━━
22 ALERT CONDITIONS
━━━━━━━━━━━━━━━━━━━━━━━━━━━━━━━━━━━━━━━━━━━━━━━━━━━━━━━━━━━━━
To set up: Right-click the indicator → Add Alert → Select condition.
All alerts include: ticker · close price · timestamp.
SIGNAL ALERTS
▲ CALL Signal — Full CALL criteria met
▼ PUT Signal — Full PUT criteria met
◆ Any Signal — Either CALL or PUT
LEVEL BREAK ALERTS
→ PMH Breakout — Close crosses pre-market high
→ PML Breakdown — Close crosses pre-market low
→ FCH Break — Close crosses first candle high
→ FCL Break — Close crosses first candle low
STRUCTURE ALERTS
→ Sweep CALL — Bull sweep + above VWAP
→ Sweep PUT — Bear sweep + below VWAP
→ MSB Bull — Market structure break upward
→ MSB Bear — Market structure break downward
MOMENTUM ALERTS
→ Squeeze Bull Fire — Squeeze fires with bullish close
→ Squeeze Bear Fire — Squeeze fires with bearish close
→ MA Full Bull Stack — All 4 MAs correctly ordered up
→ MA Full Bear Stack — All 4 MAs correctly ordered down
DIVERGENCE & LIQUIDITY
→ RSI Bull Divergence — Bull div detected
→ RSI Bear Divergence — Bear div detected
→ Liq Buy Bias — HeatMap buy-side > 60%
→ Liq Sell Bias — HeatMap sell-side > 60%
PREMIUM ALERTS
★ High Edge (80+) — Composite edge score reaches 80 — premium setup
→ New High Fractal — New confirmed fractal high (LuxAlgo logic)
→ New Low Fractal — New confirmed fractal low (LuxAlgo logic)
━━━━━━━━━━━━━━━━━━━━━━━━━━━━━━━━━━━━━━━━━━━━━━━━━━━━━━━━━━━━━
SETTINGS QUICK REFERENCE
━━━━━━━━━━━━━━━━━━━━━━━━━━━━━━━━━━━━━━━━━━━━━━━━━━━━━━━━━━━━━
SESSION & TIME
Pre-Market Session → 0400-0930 ET (adjust for your exchange)
RTH Session → 0930-1600 ET
First Candle Length → 1 / 2 / 3 / 5 / 15 minutes
RTH Signals Only → On by default (recommended)
SIGNAL ENGINE
Min Score to Signal → 65 (raise for fewer signals, lower for more)
Volume Spike Mult → 1.4× (volume must be this × the 20-bar average)
MOVING AVERAGES
MA Type → SMA / EMA / WMA (switches all 4 simultaneously)
MA Lengths → 9 / 21 / 50 / 200 (individually configurable)
REVERSAL PROB ZONE (LuxAlgo)
Swing Length → 20 (pivot sensitivity)
Max Reversals → 1000 (database cap)
Percentiles → 25 / 50 / 75 / 90 (target levels to display)
FRACTAL BASE (LuxAlgo)
Fractal Periods → 2 = 5-bar fractal | 1 = 3-bar | 3 = 7-bar
STD DEV CHANNEL
Regression Length → 128 bars (shorter = more reactive)
RSI DIVERGENCE
RSI Length → 14
OB / OS Levels → 70 / 30
Divergence Lookback → 90 bars
DISPLAY
Panel Position → Top Right / Top Left / Bottom Right / Bottom Left
Compact Mode → Hides sub-rows to shrink panel height
━━━━━━━━━━━━━━━━━━━━━━━━━━━━━━━━━━━━━━━━━━━━━━━━━━━━━━━━━━━━━
HOW TO READ THE PANEL — QUICK CHECKLIST
━━━━━━━━━━━━━━━━━━━━━━━━━━━━━━━━━━━━━━━━━━━━━━━━━━━━━━━━━━━━━
Before entering any trade, run through these 9 checks:
① Signal showing CALL or PUT? (not just Watching)
② Score at or above your threshold?
③ On the correct side of VWAP?
④ MTF at least 2/3 aligned?
⑤ Channel zone in a reasonable position? (avoid Above +2σ for CALLs)
⑥ Fractal Bias showing "Above Res" (CALL) or "Below Sup" (PUT)?
⑦ RPZ showing a clear price target with enough room for your R:R?
⑧ What was the trigger event? (MSB and Sweep are strongest)
⑨ Can you fit your stop within the 1.5× ATR distance?
If you can answer yes to most of these — the setup has strong confluence.
━━━━━━━━━━━━━━━━━━━━━━━━━━━━━━━━━━━━━━━━━━━━━━━━━━━━━━━━━━━━━
CREDITS & ACKNOWLEDGEMENTS
━━━━━━━━━━━━━━━━━━━━━━━━━━━━━━━━━━━━━━━━━━━━━━━━━━━━━━━━━━━━━
APEX ELITE was built with deep respect for the Pine Script community. Several modules are directly inspired by the outstanding published work of:
🏆 LuxAlgo
Two modules in APEX ELITE are inspired by LuxAlgo's indicators:
→ Block G (Reversal Probability Zone) ports the core algorithmic logic
from LuxAlgo's "Reversal Probability Zone & Levels" — including the
exact pivot detection method, price/bar delta database, and percentile
target calculation. Licensed under CC BY-NC-SA 4.0.
→ Block L (Fractal Base) implements the fractal high/low detection and
support/resistance logic from LuxAlgo's "Fractal Base Indicator".
LuxAlgo's original indicators are published at:
tradingview.com/u/LuxAlgo/
All credit for these algorithmic approaches belongs entirely to LuxAlgo.
🏆 BigBeluga
→ Block F (Liquidity HeatMap) is inspired by BigBeluga's
"Dynamic Liquidity HeatMap Profile" indicator. The volume-normalized,
pivot-based liquidity bias methodology is adapted from their approach.
BigBeluga's work can be found at:
tradingview.com/u/BigBeluga/
Please visit and support their original publications directly.
🏆 Libertus
→ Block I (RSI Divergence) implements the divergence detection method
from Libertus's "RSI Divergences" indicator.
Thank you to all three creators for sharing their knowledge with the community.
━━━━━━━━━━━━━━━━━━━━━━━━━━━━━━━━━━━━━━━━━━━━━━━━━━━━━━━━━━━━━
⚠️ DISCLAIMER — PLEASE READ IN FULL
━━━━━━━━━━━━━━━━━━━━━━━━━━━━━━━━━━━━━━━━━━━━━━━━━━━━━━━━━━━━━
APEX ELITE is a technical analysis tool published for EDUCATIONAL and INFORMATIONAL purposes only.
❌ It does NOT constitute financial advice.
❌ It does NOT constitute investment advice.
❌ It does NOT constitute trading recommendations.
❌ It is NOT a solicitation to buy or sell any financial instrument.
All information displayed by this indicator is derived from historical price data and mathematical calculations. Past signal performance does NOT guarantee or predict future results. Financial markets are inherently unpredictable and all trading involves significant risk, including the potential loss of your entire invested capital.
The author of APEX ELITE is not a licensed financial advisor, broker, dealer, or investment professional. Nothing in this indicator or its documentation should be interpreted as personalized investment advice tailored to your individual financial situation, risk tolerance, or investment objectives.
YOU are solely responsible for all trading decisions you make.
Always conduct your own independent research and due diligence.
Always use proper risk management — including position sizing and stop-loss orders.
Never trade with money you cannot afford to lose.
If you are uncertain about any aspect of trading or investing, consult a licensed financial professional in your jurisdiction.
By adding this indicator to your chart, you acknowledge that you have read and understood this disclaimer, and that any trading decisions you make based on or influenced by this indicator are entirely your own responsibility.
━━━━━━━━━━━━━━━━━━━━━━━━━━━━━━━━━━━━━━━━━━━━━━━━━━━━━━━━━━━━━
Pine Script v6 · Not Financial Advice · Educational Use Only
━━━━━━━━━━━━━━━━━━━━━━━━━━━━━━━━━━━━━━━━━━━━━━━━━━━━━━━━━━━━━
EOF Gösterge

Gösterge

Gösterge

Gösterge