Gösterge

Gösterge

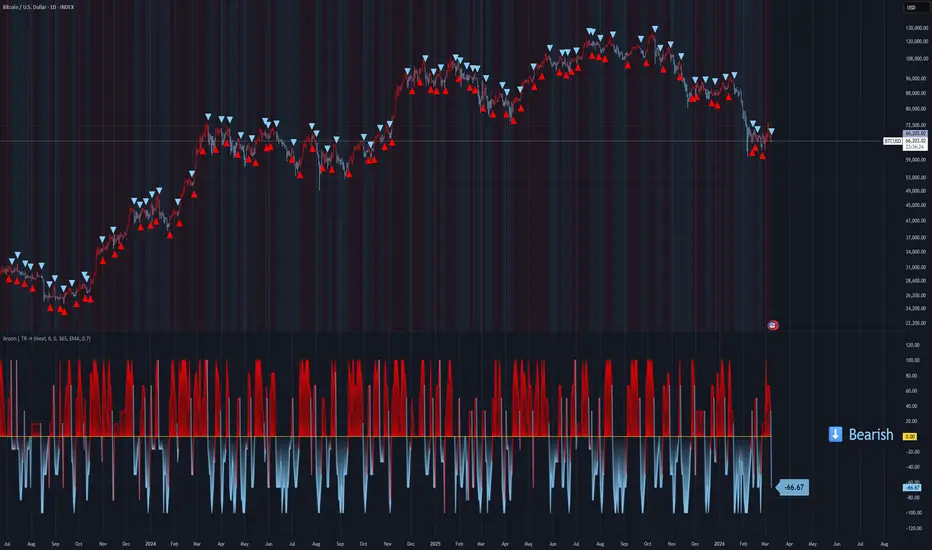
Aroon | TR🎯 Overview
Aroon | TR is a versatile trend-following indicator that measures the time elapsed since price recorded its highest high and lowest low over a specified period. Developed by Tiagorocha1989, this enhanced version of Tushar Chande's classic Aroon indicator offers multiple visualization modes, customizable moving averages, and comprehensive visual features to help traders identify trend direction, trend strength, and potential reversal points with greater precision.
🔧 How It Works
The Aroon indicator consists of two lines: Aroon Up and Aroon Down. These lines measure how many periods have passed since price recorded a high or low within the lookback period. The relationship between these lines determines trend direction and strength.
Core Calculation Logic:
The indicator calculates the Aroon lines using the following logic:
Aroon Up: Measures the number of periods since the highest high within the lookback period
Formula: 100 × (Length - Periods Since Highest High) / Length
Aroon Down: Measures the number of periods since the lowest low within the lookback period
Formula: 100 × (Length - Periods Since Lowest Low) / Length
Both lines oscillate between 0 and 100, with:
Values above 50 indicating a recent high/low (strong trend)
Values approaching 100 indicating a very recent high/low (very strong trend)
Values approaching 0 indicating no recent high/low (weak or reversing trend)
The indicator also calculates Aroon as the difference between Aroon Up and Aroon Down (Aroon Up minus Aroon Down), creating an oscillator that oscillates around zero:
Positive Aroon values → Bullish momentum (Aroon Up above Aroon Down)
Negative Aroon values → Bearish momentum (Aroon Down above Aroon Up)
✨ Key Features
🔹 Multiple Display Modes
Average Aroon Mode: Shows the Aroon oscillator (Aroon Up minus Aroon Down) with signal line, providing a clean, oscillator-style view of trend strength and direction
Normal Aroon Mode: Displays the classic Aroon Up and Aroon Down lines for traditional analysis
Both modes can be combined for comprehensive analysis
🔹 Dual Operating Modes for Signals
Zero Line Mode: Signals occur when the Aroon oscillator crosses above or below the zero line
Aroon MA Mode: Enhanced mode where signals occur when Aroon crosses its own moving average, providing filtered entries
🔹 Flexible Moving Average Selection
Choose from six MA types for the Aroon MA mode:
EMA (Exponential Moving Average) for responsive signals
SMA (Simple Moving Average) for smoother readings
RMA (Rolling Moving Average) for weighted recent data
WMA (Weighted Moving Average) for customizable weighting
VWMA (Volume-Weighted Moving Average) incorporating volume
HMA (Hull Moving Average) for reduced lag
🔹 Customizable Aroon Parameters
Length Aroon: Lookback period for Aroon calculation (default 6)
Shorter periods (like 6) provide more responsive signals
Longer periods (like 14-25) provide smoother, more reliable signals
🔹 Customizable Color Themes
Eight distinct color schemes to match your charting preferences:
Classic – Green for bullish, Red for bearish
Modern – White for bullish, Purple for bearish
Robust – Amber for bullish, Maroon for bearish
Accented – Violet for bullish, Pink for bearish
Monochrome – Light gray for bullish, Dark gray for bearish
Moderate – Green for bullish, Red for bearish
Aqua – Blue for bullish, Orange for bearish
Cosmic – Pink for bullish, Purple for bearish
🔹 Comprehensive Visual Feedback
Aroon Oscillator: Colored line showing the difference between Aroon Up and Aroon Down
Signal Line: Yellow line for MA-based signals
Gradient Fill Zones: Clear visualization of extreme readings (+100 to -100)
Dynamic Zone Fills: Semi-transparent fills showing when Aroon is above or below the signal line
Aroon Up and Aroon Down Lines: Optional display of classic Aroon lines
Color-Coded Candles: Bars reflect current trend direction based on Aroon Up/Aroon Down relationship
Signal Markers: Triangle up/down symbols at crossover points
Live Value Display: Floating labels showing current values for each enabled component
Trend Table: Bullish/Bearish status displayed on the chart
🔹 Ready-to-Use Alerts
Built-in alert conditions trigger LONG signals when Aroon Up crosses above Aroon Down, and SHORT signals when Aroon Up crosses below Aroon Down.
⚙️ Settings Summary
Color Choice: Select from eight visual themes (Default: Classic)
Length Aroon: Lookback period for Aroon calculation (Default: 6)
Average Aroon: Toggle to show the Aroon oscillator (Aroon Up minus Aroon Down) (Default: Enabled)
Aroon: Toggle to show classic Aroon Up and Aroon Down lines (Default: Disabled)
Entry/Exit Signal: Choose between zero line or Aroon MA mode (Default: Zero Line)
Length MA: Moving average period for Aroon MA mode (Default: 365)
Aroon MA Type: Moving average method for signal line (Default: EMA)
📈 Practical Applications
🔹 Trend Direction Identification
The primary use of the Aroon system is identifying trend direction:
Aroon Up above Aroon Down → Bullish trend
Aroon Down above Aroon Up → Bearish trend
The wider the separation, the stronger the trend
🔹 Trend Strength Measurement
The actual values of Aroon Up and Aroon Down indicate trend strength:
Values above 70 → Strong trend (recent high/low)
Values between 50-70 → Moderate trend
Values below 30 → Weak trend or consolidation
Both lines below 50 → Possible ranging market
🔹 Trend Initiation Detection
When Aroon Up crosses above Aroon Down from below, it suggests a new uptrend is beginning. Conversely, when Aroon Down crosses above Aroon Up, it suggests a new downtrend is beginning.
🔹 Trend Exhaustion Signals
When Aroon Up is very high (above 80-90) and begins to turn down while Aroon Down remains low, it may indicate an uptrend is tiring. The opposite signals downtrend exhaustion.
🔹 Consolidation Identification
When both Aroon lines are low (below 30-40) and moving horizontally, it suggests a consolidation phase with no clear trend.
🔹 Aroon Oscillator Analysis
The Aroon oscillator (Aroon Up minus Aroon Down) offers additional insights:
Positive values indicate bullish dominance
Negative values indicate bearish dominance
Crossovers of the zero line confirm trend changes
Crossovers of the moving average provide filtered signals
🔹 Multiple Timeframe Confirmation
Compare Aroon readings across different timeframes:
Higher timeframe Aroon confirms primary trend direction
Lower timeframe Aroon identifies entry timing
🎯 Ideal For
✅ Trend Traders seeking early identification of new trends
✅ Swing Traders wanting to capture trend initiations and reversals
✅ Range-Bound Traders identifying consolidation phases
✅ System Developers needing reliable trend direction signals
✅ Multi-Timeframe Analysts comparing trend strength across periods
📌 Key Takeaways
Time-Based Approach: Unlike most indicators that use price or volume, Aroon uniquely measures time since significant highs and lows
Multiple Display Modes: Choose between classic Aroon Up/Down lines or the Aroon oscillator based on your analysis style
Dual-Mode Signal Generation: Zero line crossovers for classic signals or MA-smoothed signals for filtered entries
Rich Visual Feedback: Color themes, gradient fills, candles, and floating labels provide immediate market awareness
Alert-Ready: Built-in alerts for trend change signals when Aroon Up crosses Aroon Down
⚠️ Important Notes
The Aroon indicator works best in trending markets and can produce false signals in ranging conditions. The default length of 6 makes this version very responsive to recent price action, ideal for shorter-term trading. For longer-term analysis, consider increasing the length to 14-25. The 365-day MA default in Aroon MA mode is designed for longer-term trend context on daily charts. Both lines below 50 often indicate consolidation - consider avoiding trend signals in these conditions. Always combine with proper risk management and additional confirmation for best results.
Disclaimer: This indicator is provided for educational and informational purposes only. Past performance is not indicative of future results. Always conduct thorough testing and align with your risk management strategy before live deployment. Gösterge

Gösterge
Gösterge

Gösterge
Gösterge

Gösterge

Gösterge

Gösterge

Gösterge

Gösterge

Gösterge

Parmar BBIFOhi this doesnt work so dont use it, it suckshi this doesnt work so dont use it, it suckshi this doesnt work so dont use it, it suckshi this doesnt work so dont use it, it suckshi this doesnt work so dont use it, it suckshi this doesnt work so dont use it, it suckshi this doesnt work so dont use it, it suckshi this doesnt work so dont use it, it suckshi this doesnt work so dont use it, it suckshi this doesnt work so dont use it, it sucks
Gösterge

Strateji

NQ 9:45-10:15 ICT Strategy - CompleteNQ 9:45–10:15 ICT Strategy – High-Probability Nasdaq Scalper (ICT/Smart Money)
This open-source strategy is a complete, rules-based implementation of core Inner Circle Trader (ICT) / Smart Money concepts, specifically optimized for **Nasdaq futures (NQ)** during the high-volatility 9:45–10:15 AM New York time window (first 30 minutes after the 9:30 open liquidity grab phase).
Core Philosophy & Why This Combination?
ICT emphasizes that institutional order flow often creates **false moves** (liquidity sweeps of previous day high/low), followed by **market structure shifts (MSS / Break of Structure)** that reveal true directional intent, with entries taken from **mitigation of Order Blocks** (areas of institutional interest / imbalance).
This script enforces strict confluence:
- Daily bias filter (price or prev close vs daily EMA20)
- Liquidity sweep confirmation (PDH/PDL raid + reversal close)
- Bullish/Bearish Market Structure Shift (close beyond last swing high/low)
- Refined Order Block detection (last opposite candle before MSS, with defensive/aggressive mitigation logic inspired by popular ICT order block refinements)
- Tight time filter (only 9:45–10:15 NY) — captures post-open manipulation & directional resolve
- One trade per day rule — prevents overtrading in chop
The tight combination reduces false signals dramatically and aligns with ICT's focus on high-probability setups during specific market sessions.
Key Components & Logic
1. Daily Bias
- Bullish if current price > daily EMA20 (or prev daily close > EMA20 — user choice)
- Bearish otherwise
- Background tint + orange EMA line
2. Liquidity Sweep
- Low < PD Low but close > PD Low → bullish sweep (stops taken below)
- High > PD High but close < PD High → bearish sweep
- Resets daily
3. Market Structure Shift (MSS / BoS)
- Bullish MSS: close > last fractal swing high
- Bearish MSS: close < last fractal swing low
- Uses 5-bar fractal detection for swing points
- Resets daily
4. Order Block (OB) Detection & Refinement
- Bullish OB: last bearish candle (close < open) before bullish MSS
- Bearish OB: last bullish candle before bearish MSS
- Refinement options (On/Off):
- Defensive: tightens OB to body or wick depending on candle range vs ATR(55)
- Aggressive: uses full candle wick range
- OB box drawn until mitigated (price touches opposite side)
- Labeled "OB+" / "OB-"
5. Entry Window & Confluence
- Only allowed 9:45–10:15 NY time
- Long: bullish bias + low swept + bullish MSS + price mitigates bullish OB (touches high side, closes inside/above low side)
- Short: mirror logic
- One trade per day max
6. Risk & Exit
- SL = opposite side of Order Block
- TP = 2:1 RR (adjustable) from entry
- No trailing / partials — clean single target
Visuals
- Daily EMA (orange)
- Prev Day High/Low circles
- Bullish/Bearish background tint
- MSS triangles
- Order Block boxes + "OB+"/"OB-" labels
- Entry labels with price/SL/TP
Alerts
- "NQ Long: Bullish Bias + Sweep + MSS + OB"
- "NQ Short: Bearish Bias + Sweep + MSS + OB"
Realistic Backtesting & Usage Guidelines
To publish non-misleading results:
- Initial Capital: $10,000–$50,000 (realistic futures account)
- Position sizing: 1–3% of equity per trade (change default_qty_value from 100%!)
- Commission: $4–$8 round-turn per contract (typical NQ futures commission)
- Slippage: 1–4 ticks (NQ is liquid but fast-moving post-open)
- Dataset: ≥2–3 years of 1-minute or 5-minute NQ data (aim for 300–600+ trades)
- Risk per trade: 0.5–1.5% with defaults — never risk more than sustainable
The 30-minute window produces relatively few trades per year — perfect for statistical significance over long periods, but results vary heavily by market regime (trending vs. choppy opens).
How to Use
1. Apply to NQ1! or MNQ1! (continuous futures) on 1-minute or 5-minute chart.
2. Keep default NY timezone (America/New_York).
3. Start with 2:1 RR, Defensive refinement, show levels on.
4. Trade only during the window — best setups show clear sweep + MSS + OB mitigation.
5. Avoid major news overlapping the window (FOMC, CPI, etc.) or widen SL.
6. Forward-test on demo for several months — this is a high-confluence, low-frequency setup.
Publish Recommendation
- Use a clean chart: only this strategy, no extra indicators/drawings.
- Show realistic Strategy Tester view with commission/slippage applied.
- Screenshot during NY morning session with visible OB & signal.
Test thoroughly and trade responsibly. Strateji

Gösterge

H4 Color Change Bias (Correct Final)Trading is the active buying and selling of financial instruments—such as stocks, currencies, commodities, and derivatives—to generate short-term profits from price fluctuations. Unlike long-term investing, traders capitalize on both rising (bullish) and falling (bearish) markets using technical analysis, market research, and risk management strategies.
Key aspects of trading include:
Financial Instruments: Traders deal in various markets, including stock markets (shares), foreign exchange (Forex), commodities (gold, oil), and cryptocurrencies.
Goal: The primary objective is to buy at a lower price and sell at a higher price, or vice versa (short selling) to make a profit.
Timeframe: Trading is typically fast-paced, with positions held for minutes, hours, days, or weeks, as opposed to years. Gösterge

Gösterge

Heston Multi-Slot PeriodicityHESTON INTRADAY PERIODICITY STRATEGY
ACADEMIC BASIS:
Based on research by Heston, Korajczyk & Sadka (Journal of Finance, 2010).
Finding: "Stock returns in a specific half-hour window show continuation at the SAME time window the next day, persisting for 40+ trading days."
CORE CONCEPT:
If NQ went UP during 10:00-10:30 AM yesterday → likely goes UP during 10:00-10:30 AM today
If NQ went DOWN during 10:00-10:30 AM yesterday → likely goes DOWN during 10:00-10:30 AM today
WHY IT WORKS:
- Institutional VWAP trading (Volume Weighted Average Price algorithms)
- Index rebalancing flows occur at predictable times
- Market-on-close orders create patterns
- Institutions CAUSE the pattern but can't arbitrage it (position size, slippage, mandate restrictions)
STRATEGY RULES:
1. Track yesterday's return in 6 specific half-hour slots
2. At start of each slot today, if yesterday was UP → GO LONG
3. Exit: 30pt stop loss, 90pt target (3:1 R:R), or slot end (whichever first)
4. Longs only (proven 60%+ win rate vs shorts 50%)
TIME SLOTS:
S1: 9:30-10:00 AM (opening flows)
S2: 10:00-10:30 AM (post-open institutional)
S3: 11:00-11:30 AM (mid-morning)
S4: 1:00-1:30 PM (post-lunch)
S5: 2:00-2:30 PM (afternoon rebalancing)
S6: 3:00-3:30 PM (approaching close)
BACKTEST PERFORMANCE (5 months):
- Win Rate: 60.36%
- Profit Factor: 2.537
- Total Trades: 338
- Avg Win: $241 vs Avg Loss: $148 (1.6:1)
- Max Drawdown: $1,240 (0.12%)
EXECUTION:
- 3-6 setups per day
- Fully mechanical (no discretion)
- Scalable to multiple accounts
- Works on NQ futures (NASDAQ 100)
ACADEMIC REFERENCE:
Heston, S.L., Korajczyk, R.A., Sadka, R. (2010). "Intraday Patterns in the Cross-Section of Stock Returns." Journal of Finance, 65(4), 1369-1407. Strateji

ninjactor fib (v6, Native Pivots, Non-Repainting)📐 Fibonacci Sequence Framework (Non-Repainting)
This indicator implements a structured Fibonacci sequence framework using confirmed, non-repainting pivots.
It automatically identifies Fibonacci boundaries, plots a precise Fibonacci level set with grouped color logic, and projects targets based on retracement depth.
The script is designed for clarity, accuracy, and object-based plotting, extending Fibonacci levels to the right while active and maintaining a clean chart by default.
🔹 Core Features
Non-Repainting Fractals
Uses confirmed 2-left / 2-right pivots (ta.pivotlow, ta.pivothigh)
Pivot labels are plotted on the correct historical bar
Automatic Fibonacci Boundary Detection
Long spreads:
Boundary 1 = pivot low (100%)
Boundary 2 = first pivot high after (0%)
Short spreads use the inverted logic
Direction can be set to Auto, Long Only, or Short Only
Exact Fibonacci Level Set
Retracements:
0.236 · 0.382 · 0.500 · 0.618 · 0.786 · 0.886
Extensions (targets):
1.127 · 1.272 · 1.618
Negative levels included:
-0.127 · -0.272 · -0.618
Grouped Color Logic
Red: 0.236 / 0.382 / 0.500 / 0.618, 1.618, negative levels
Blue: 0.786, 1.272, boundary lines
Green: 0.886, 1.127
Active target is highlighted with increased line thickness
Strict “Must Touch” Logic
Retracement levels are only considered valid if price actually touches them
Wick-based validation (not close-based)
Target hits must be touched exactly — no partial credit
Target Projection Rules
Retracements ≤ 0.618 → target = 1.618
0.786 retracement → target = 1.272
0.886 retracement → target = 1.127
Clean Object Management
Uses line and label objects (not plots)
Levels extend right while active
By default, only the current active spread is displayed
Optional history toggle to keep previous spreads
⚙️ Customization
Fully customizable color inputs
Adjustable opacity for:
Non-active levels
Active target line
Direction mode selection
History on/off control
📌 Notes
This is an indicator, not a strategy (no trade execution)
Designed for discretionary trading and confluence analysis
Built to be stable, readable, and Pine Script v6 compatible Gösterge

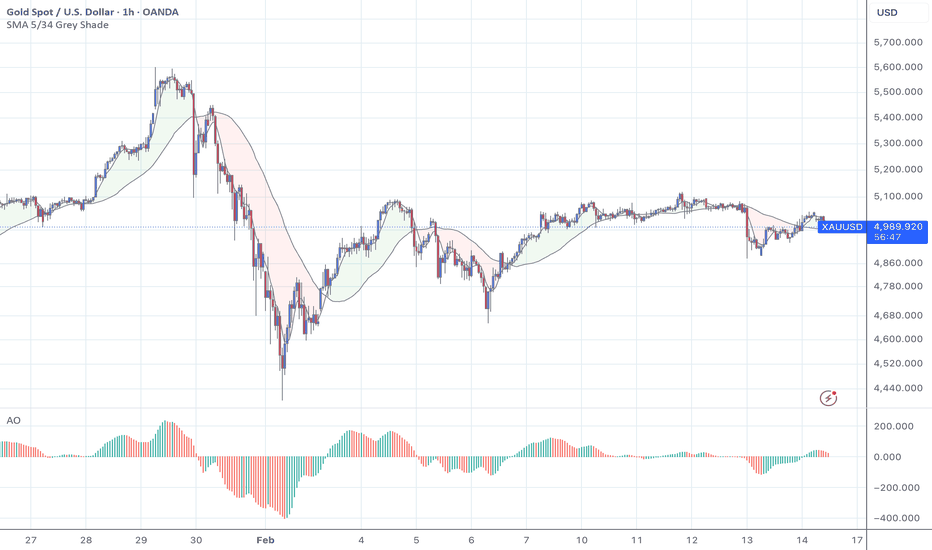
CRR Bill Williams Neo System (Alligator, Fractals, AO, AC, MFI)CRR Bill Williams Neo System is an educational chart overlay that combines classic Bill Williams concepts into a single visual framework.
The script integrates Alligator (SMMA-based trend structure), confirmed Fractals, Awesome Oscillator (AO), Accelerator Oscillator (AC), and the Bill Williams Market Facilitation Index (MFI).
Signals Logic
BUY signals appear when the Alligator trend is bullish (Lips > Teeth > Jaw), the Awesome Oscillator (AO) is above zero, the Accelerator Oscillator (AC) is above zero, the MFI state is GREEN or SQUAT, and price closes above the Lips line.
SELL signals appear when the Alligator trend is bearish (Lips < Teeth < Jaw), the Awesome Oscillator (AO) is below zero, the Accelerator Oscillator (AC) is below zero, the MFI state is GREEN or SQUAT, and price closes below the Lips line.
Signals can be configured to appear only after bar close for confirmation.
Fractals Behavior
Fractals are detected using pivot confirmation.
A fractal is confirmed only after the selected number of right bars have closed.
Because of this, fractal markers appear with a delay.
This behavior is expected and does not represent repainting.
How to Use
This indicator is designed to help visualize trend direction, momentum, and market activity.
It should be used as a confirmation tool together with price action and proper risk management.
Disclaimer
This script is for educational purposes only.
It does not constitute financial advice.
Always apply your own analysis and risk management. Gösterge

Gösterge