Gösterge

Gösterge
Gösterge

Gösterge

Gösterge

Gösterge

Gösterge
Gösterge

Gösterge

Gösterge

Gösterge
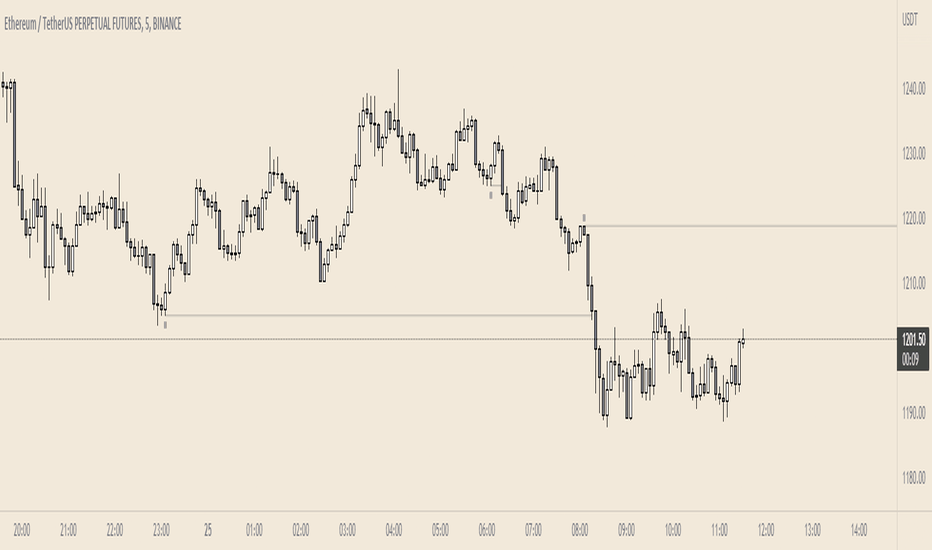
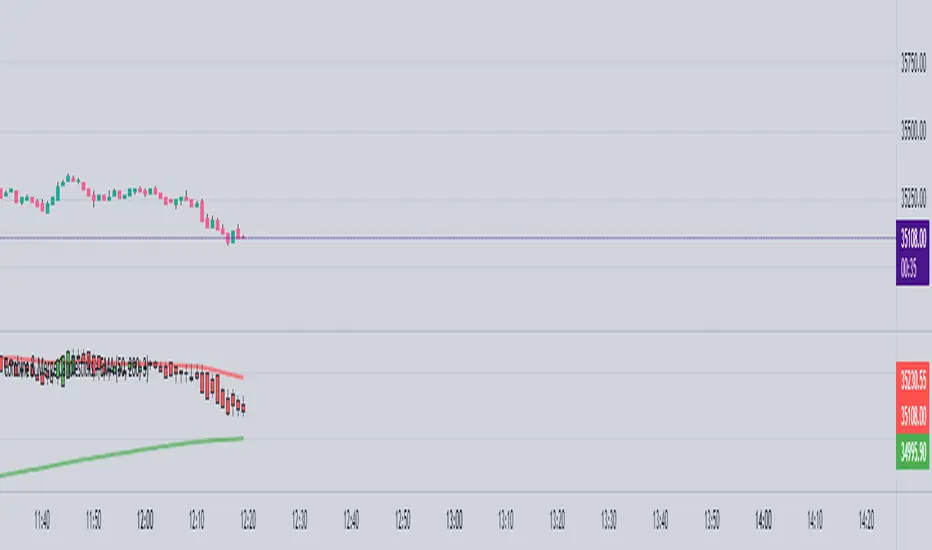
Candilator RSI [AstrideUnicorn]OVERVIEW
The name Candilator comes from blending the words "candlestick" and "oscillator". And as the name suggests, this indicator is a good old RSI plotted as a candlestick chart. To produce a candlestick chart, Candilator RSI calculates four RSI's based on the open, high, low, and close time series. It also has a candlestick patterns detection feature.
HOW TO USE
You can use Candilator RSI as a normal RSI to analyze momentum, detect overbought and oversold markets, and find the oscillator's divergences with the price. You can also get creative and apply all sorts of technical analysis to the RSI candlestick chart, including candlestick patterns analysis.
Candilator RSI can automatically scan the price for some candlestick patterns in the overbought and oversold zones. This feature can help detect price reversals early.
SETTINGS
The indicator settings are divided into two groups: Main Settings and Pattern Detection. In the Main Settings, you can find standard RSI settings. In the Pattern Detection part, you can turn on and off the automatic search for a particular candlestick pattern. Gösterge

Gösterge

Gösterge
Gösterge
Gösterge

Gösterge
Gösterge

Gösterge

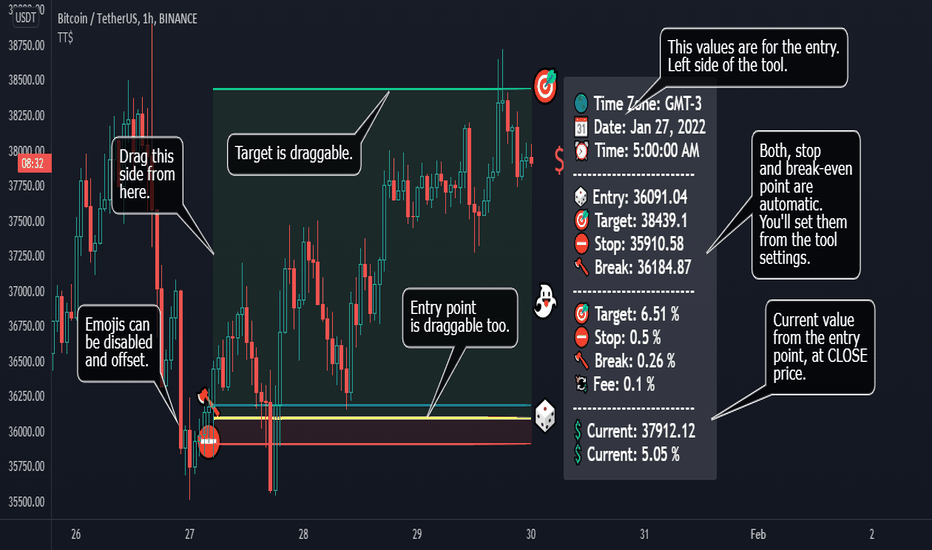
J-BUY & SELLIntroduction
I have been tracking the technical indicator for a long time. In my experience, I have tried various combinations of the existing indicators in the chart but have not been able to get satisfactory results.
The trend analysis method needs a lot of focus and time. Therefore, rather than speculating the future trend, I focused on building a code which will be continuous in terms of indications and remove the speculation out of the strategy. Hence, allow for automation.
Indicator Strategy
This is a simple, yet powerful indicator primarily based on price action and its relationship with SMAs .
Each candle is compared with the moving averages and the output is shown as a buy and sell signal through Up & Down arrows. Up arrow is a buy indicator and Down arrow is a sell indicator.
However, you might see in some case there is no Buy or Sell signals indication on the candle. No worries, please follow the previous signal in these cases.
How to add the indicator into your chart
1. Click the “Indicators” tab in the Trading view chart Tool Bar.
2. In the “Indicator & Strategies” menu, click on Public Library option.
3. Search for the “J-BUY & SELL” in the search box.
4. Add the indicator by clicking on the result.
How to add Buy & Sell alert
In addition to the indicator, you can also set BUY & SELL alerts for any of the stock/ index/ commodities etc.
1. Hover your mouse cursor over the indicator on the chart.
2. Click on the three dots captioned as “More”
3. Choose the option “Add alert on J-BUY & SELL”
4. You can choose the alert “Buy Bar/ Sell Bar or both as per your requirement by pressing the “Create” button.
Change the Color of the Up & Down arrows
For changing the color of the arrows, please “double click” on the arrow and the color as per your choice. Gösterge

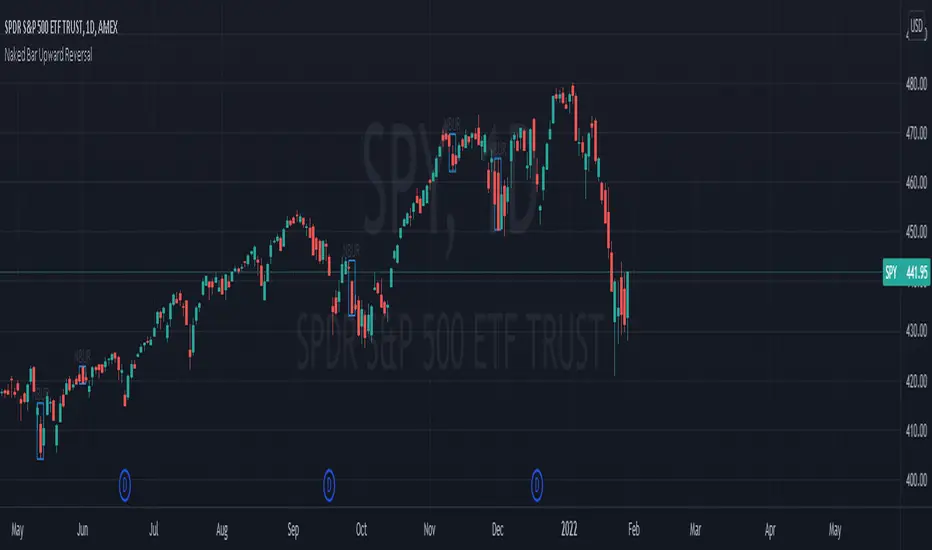
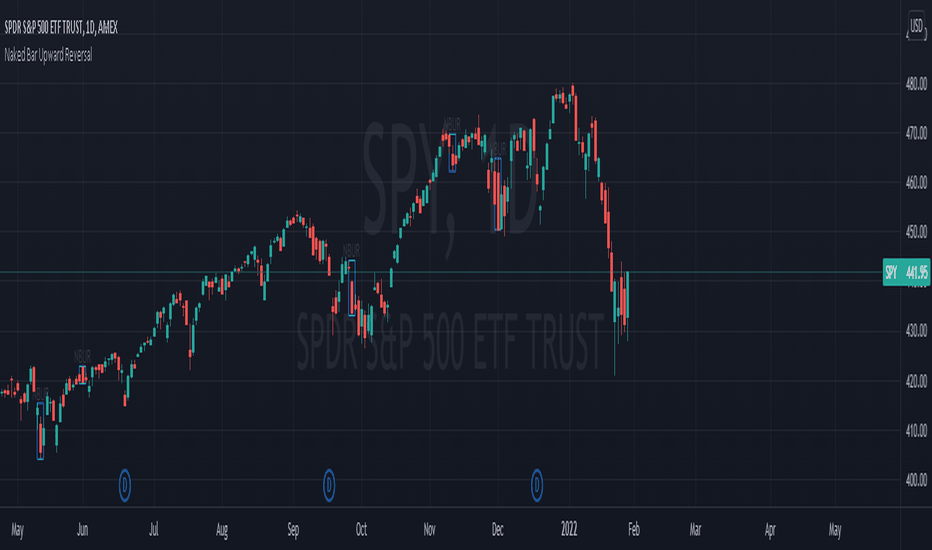
The Strat Numbers & CombosThis indicator is an all-in-one " The Strat " script. This script displays the following:
The Strat candle numbers (1's, 2's, & 3's)
The Strat Combo labels along with trigger line
Pivot Machine Gun ( PMG ) dynamic labels
Hammer & Shooter candle labels
The Strat Candle Numbers label each candle, on any timeframe, either a 1, 2, or 3. 1's are inside bars of the previous candles. 2's take out only one side of the previous candle. And 3's go outside both sides of the previous candle.
The Strat Combo labels (which are made of the 1's, 2's, 3's outlined above) display labels when a Strat Combo occurs. The script displays a label, direction arrow, and trigger line for each Strat Combo. This indicator finds the following Strat Combos:
2-1-2 bullish reversal (BLR)
2-1-2 bullish continuation (BLC)
3-1-2 BLR
3-2-2 BLR
1-2-2 rev strat BLR
2-2 BLR
2-1-2 bearish reversal (BRR)
2-1-2 bearish continuation (BRC)
3-1-2 BRR
3-2-2 BRR
1-2-2 rev strat BRR
2-2 BRR
Double inside candles
The Pivot Machine Gun (PMG) labels any 5 or more consecutive candles that make higher lows or 5 or more consecutive candles that make lower highs. A PMG can continue going in its direction or it can reverse and come back through the range. The logic in this indicator dynamically finds each level in a PMG and draws a line for easy identification.
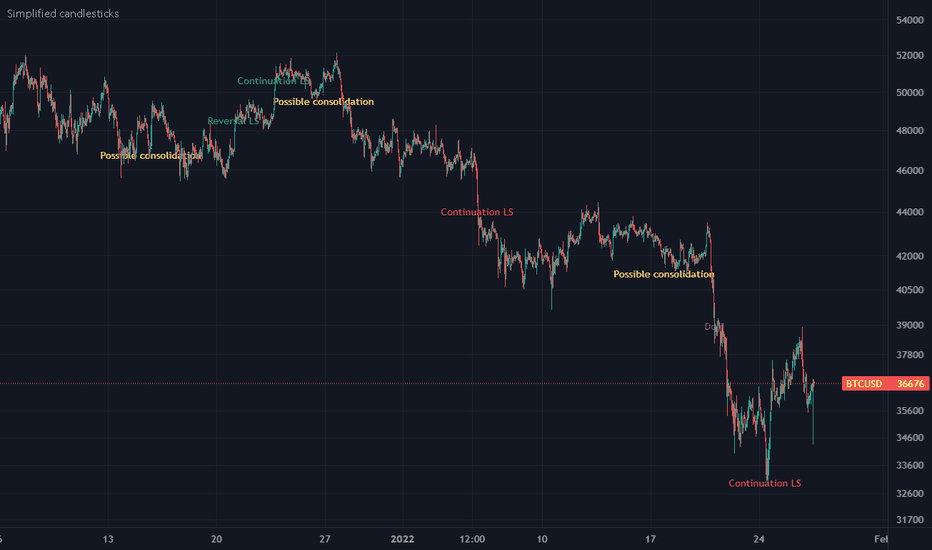
The script also identifies if the candle type is a Hammer, Inverted Hammer, Shooting Star, or Hanging Man. These candle types are highly likely reversal points in price action.The indicator will plot a shape with a color coded icon identifying the candle. The distance between the shape and the candles can be manually adjusted in the inputs section.
This indicator has many style options . The user can independently toggle on/off the Strat numbers, boxes around the Strat Combos, and Hammer and Shooter shapes. Also all of the colors used in this script can be changed from the inputs section, so a user can easily change colors to match their current color scheme.
Gösterge

Gösterge

Strateji