Gösterge

Gösterge

Super Chachin Classic Fibonacci Pivots with Price-Action SigOVERVIEW
Chachin Pivots Pro is an intraday support/resistance tool that plots two complementary families of daily pivot levels — classic floor-trader pivots and Fibonacci pivots — and adds a volatility-filtered price-action layer that highlights reversal candles forming right at those levels. It is built for the 5-minute chart and works on forex, gold and index markets.
WHY THESE COMPONENTS ARE COMBINED (and how they work together)
Most pivot indicators draw a single set of levels and stop there, leaving you to judge by eye whether price is actually reacting. This script combines three elements on purpose, each one covering a weakness of the others:
Classic pivots (PP, R1–R4, S1–S4) come from the standard floor-trader formula and tend to mark the broad reaction zones most intraday traders watch.
Fibonacci pivots (0.382 / 0.618 / 1.000 of the prior day's range) are calculated with a different formula and often land at slightly different prices. They are included alongside the classic levels precisely because of where they disagree: when a classic level and a Fib level cluster together, that confluence marks a stronger zone than either level alone. The two sets are not redundant — their overlap is the information.
Price-action signals are the timing layer. The script flags a bullish engulfing candle near a support level and a bearish rejection candle near a resistance level. A pivot tells you where price might turn; the candle tells you whether it is actually turning there right now.
The piece that binds them into one system is the ATR proximity filter. "Near a level" is defined in volatility-adjusted terms (a multiple of ATR) rather than a fixed distance, so a signal only appears when a reversal candle forms within a meaningful distance of a pivot — and the same settings behave sensibly on a quiet EUR/USD session and a fast XAU/USD session without retuning. This is what makes the three parts act as one tool instead of three scripts stacked on a chart.
HOW THE LEVELS ARE CALCULATED
Central Pivot: PP = (prev High + prev Low + prev Close) / 3
Classic R1 / S1: 2·PP − prev Low and 2·PP − prev High
Classic R2 / S2: PP + range and PP − range (range = prev High − prev Low)
R3/R4 and S3/S4: further range projections for high-volatility days
Fibonacci pivots: PP ± 0.382·range, PP ± 0.618·range, PP ± 1.000·range (the 0.618 level is usually the most respected)
All levels are built from the previous, already-closed daily candle, so they are fixed for the whole session and do not repaint. Old lines are cleared at the start of each new day to keep the chart clean.
THE PRICE-ACTION SIGNALS
🟢 BULL — a bullish engulfing candle that closes within ATR-proximity of a support pivot (PP / S / FS).
🔴 BEAR — a bearish rejection candle within ATR-proximity of a resistance pivot (PP / R / FR).
Signals are confirmed on bar close and are meant as context, not as automatic buy/sell instructions.
HOW TO USE IT
Add it to a 5-minute chart of a liquid instrument (e.g. XAU/USD, EUR/USD, an index).
Use the Central Pivot (PP) for daily bias: trading above it leans bullish, below it leans bearish.
Watch how price behaves at the pivots, paying special attention to confluence zones where a classic level and a Fibonacci level stack on top of each other.
Treat a BULL/BEAR signal at one of those zones as a heads-up to look for your own entry, using the next pivot as a logical target and the level behind the signal as a logical invalidation point.
Optional alerts are available for PP crosses, key breakouts/breakdowns, and the candle signals.
SETTINGS
Show Classic Pivots / Show Fibonacci Pivots / Show Labels — toggle each layer on or off.
Proximity to level (× ATR) — how close price must be to a level for a signal to fire (higher = more permissive).
Colours for the central pivot, classic levels, Fibonacci levels and signals are fully editable.
INPUT-MENU TRANSLATION (the UI is in Spanish)
"Mostrar Pivots Clásicos" → Show Classic Pivots
"Mostrar Pivots Fibonacci" → Show Fibonacci Pivots
"Mostrar Etiquetas" → Show Labels
"Mostrar Señales" → Show Signals
"Proximidad a nivel (x ATR)" → Proximity to level (× ATR)
"Pivot Central" → Central Pivot · "Niveles Clásicos" → Classic Levels · "Niveles Fibonacci" → Fibonacci Levels
This is an educational tool for identifying support and resistance. It is not financial advice, and the past behaviour of any level does not guarantee future results.
Gösterge

HTF Candle Volume Profile [ChartPrime]🔶 OVERVIEW
Traders often lose sight of the "big picture" when focused on lower timeframe (LTF) price action. The HTF Candle Volume Profile bridges this gap by projecting Higher Timeframe (HTF) candles—such as Daily or 4-Hour bars—directly onto your current chart.
Unlike standard HTF candles, this indicator includes a **built-in Volume Profile for each candle**, revealing exactly where the most trading activity occurred within that specific higher timeframe period.
🔶 KEY CONCEPTS: SYNTHETIC PROJECTION
This tool uses a "projection" method, meaning it draws the HTF candles and their profiles to the right of the current price action. This prevents chart clutter and allows you to compare the internal volume structure of the current and previous HTF candles side-by-side.
Synthetic Candles: Represents the OHLC (Open, High, Low, Close) of the higher timeframe.
Intra-Candle Volume Profile: A horizontal histogram built into the candle body showing volume distribution.
Point of Control (POC): The specific price level within the HTF candle that saw the highest volume.
🔶 VISUAL COMPONENTS
Projected Candle Slots: You can display up to four candles:
* Candle 1 (C1): The currently forming HTF candle (updates in real-time).
* Candles 2-4 (C2-C4): The most recent historical closed HTF candles.
POC Level Lines: A dashed orange line (customizable) extends from the profile back across your chart, marking the "fairest price" of that HTF period.
High/Low Level Lines: Dotted lines marking the extremes of the HTF candles, providing immediate targets for liquidity sweeps or support/resistance.
Price Labels: Optional tags that display the exact price of the High, Low, and POC for precise order entry.
🔶 INDICATOR PARAMETERS
Timeframe (HTF): Choose the "Anchor" timeframe (e.g., set to "D" while trading on the 15m chart).
Profile Bins: Adjust the resolution of the volume histogram. Higher values provide a more granular look at price "nodes."
Projection Offset: Moves the projected candles further to the right to keep your current price action clear.
Style Controls: Fully customize the colors for bullish/bearish candles and the Point of Control.
🔶 TRADING APPLICATIONS
Identifying Institutional Value: The POC of an HTF candle is where "Big Money" is most active. When price returns to a previous HTF POC, it often finds significant support or resistance.
Trend Confirmation: Watch the "Migration" of the POC. If the POC of C1 is higher than the POC of C2, the HTF trend is healthily bullish.
Targeting Liquidity: The High and Low level lines projected by the indicator act as natural "draws on liquidity." Traders often look for price to sweep these HTF levels before looking for a reversal.
🔶 CONCLUSION
The HTF Candle Volume Profile is an essential tool for multi-timeframe analysis. It allows you to see not just *where* price went on a higher timeframe, but *how much business* was conducted at every price point along the way. Gösterge

Strateji
Gösterge
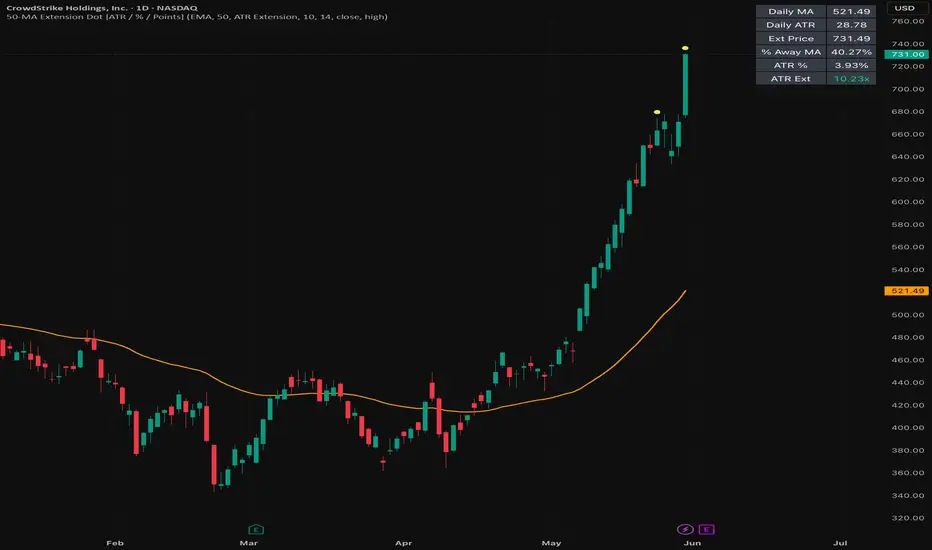
50-MA Extension Dot [ATR / % / Points]50-MA Extension Dot marks when price has moved a defined distance above a daily moving-average anchor. The goal of the script is to help traders study when price becomes extended relative to its daily trend structure, rather than judging a move by price alone.
The script supports three extension methods: ATR Extension, Percent, and Points. ATR Extension compares the distance from price to the daily moving average against the instrument’s daily ATR, making the reading volatility-adjusted. Percent mode measures how far price is above the moving average in percentage terms. Points mode measures the raw point distance above the moving-average anchor.
The moving-average type, moving-average length, threshold method, threshold value, ATR length, and extension source are customizable so traders can study past moves and build their own rules. For example, users can test how a symbol historically behaved when it became one ATR, two ATRs, a fixed percentage, or a fixed point distance above its daily moving-average reference.
When the selected threshold is reached, the script plots a small dot above the candle. The dot is not a standalone buy or sell signal. It is a visual marker showing that price has reached a defined extension zone relative to the chosen daily moving-average reference.
The script can also display the daily moving average, an optional threshold line, and a small table showing the current daily moving average, daily ATR, extension price, percentage distance from the moving average, ATR percentage, and ATR extension value.
This tool is useful for studying stretched moves, breakout extensions, momentum exhaustion, and conditions where price may be moving too far too quickly above its daily trend anchor. Because different symbols have different volatility profiles, the customizable inputs allow traders to compare past extensions and develop rules that fit their own process.
This indicator does not predict future price movement. It is a contextual extension tool designed to measure distance from a daily trend reference and help traders research historical extension behavior. Gösterge

Inside Candle with EMA +ST +TP/SL@SaheemolInside Candle Breakout with EMA, SuperTrend & Auto TP/SL
This indicator combines the power of the Inside Candle breakout pattern, EMA trend analysis, and SuperTrend confirmation to identify high-probability breakout opportunities while automatically plotting trade management levels.
Key Features
✅ Detects valid Mother-Daughter (Inside Candle) formations using customizable body-size filters.
✅ Plots EMA 9, EMA 21, and EMA 200 to help visualize market trend and structure.
✅ Uses SuperTrend confirmation to filter false breakouts:
Buy signals only when SuperTrend is bullish.
Sell signals only when SuperTrend is bearish.
✅ Automatically identifies breakout levels from the Mother Candle's high and low.
✅ Draws:
Entry zone
Stop Loss (SL)
Take Profit 1 (TP1)
Take Profit 2 (TP2)
using user-configurable Risk ratios.
✅ Highlights Inside Candle setups and displays visual breakout signals directly on the chart.
✅ Includes alert conditions for automated notifications.
How It Works
The indicator searches for a strong Mother Candle followed by a valid Inside Candle.
The Mother Candle's high and low become the breakout levels.
A trade signal is generated only when price breaks out of the Mother Candle range and the SuperTrend agrees with the direction.
TP1, TP2, and SL levels are automatically calculated based on the Mother Candle range.
Best Use Cases
Intraday trading
Swing trading
Breakout strategies
Trend-following systems
Forex, Stocks, Crypto, and Indices
This indicator is designed to help traders quickly identify consolidation breakouts while maintaining disciplined risk management through predefined entry, target, and stop-loss zones.
Disclaimer: This script is for educational and informational purposes only and does not constitute financial advice. Trading involves risk, and users should perform their own analysis and risk management before making any trading decisions. Gösterge

Gösterge

Gösterge

Gösterge

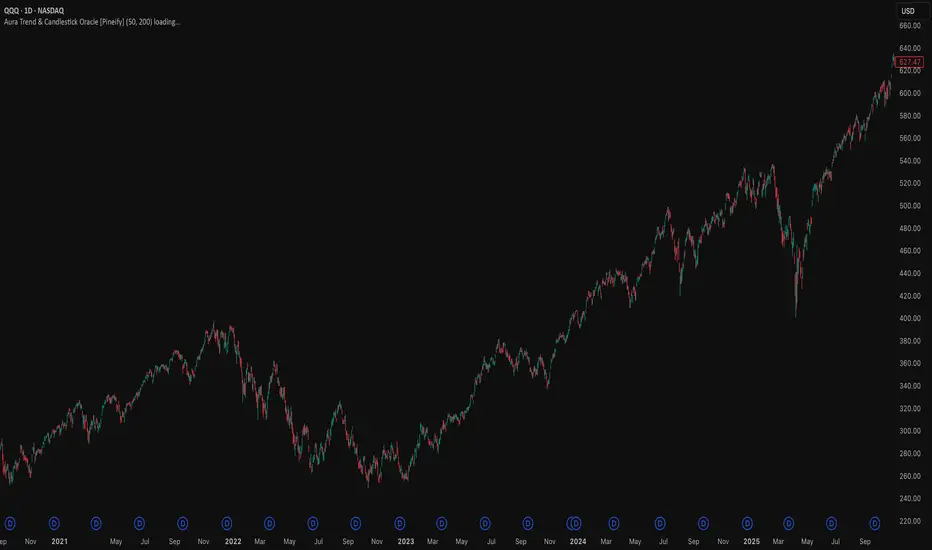
Aura Trend & Candlestick Oracle [Pineify]Aura Trend & Candlestick Oracle
This indicator layers EMA-based trend detection with candlestick pattern recognition, then gates the pattern signals through the prevailing trend direction. The idea: candlestick reversals are far more reliable when they fire in alignment with the macro trend rather than against it. A hammer in a downtrend is noise; the same hammer in an uptrend is a potential continuation entry after a pullback.
Key Features
EMA cloud (fast/slow) with dynamic color fill that shifts between bullish, bearish, and neutral states
Five candlestick patterns: Bullish Engulfing, Bearish Engulfing, Hammer, Shooting Star, Inverted Hammer / Hanging Man
Signals filtered by trend — bullish patterns only fire in uptrends, bearish patterns only in downtrends
Background shading highlights trend zones for quick chart-reading
Dashboard panel showing live trend status and current EMA values
Four alert conditions: BUY signal, SELL signal, EMA bullish crossover, EMA bearish crossunder
How It Works
Trend detection uses two exponential moving averages — a fast EMA (default 50) and a slow EMA (default 200). When the fast EMA is above the slow EMA, the script treats the market as an uptrend; when below, a downtrend. This classic crossover relationship provides the filtering layer for all pattern signals.
Candlestick pattern detection evaluates each bar's body size, wick lengths, and direction, then checks the previous bar's properties for multi-bar patterns:
Engulfing patterns — the current candle's body fully wraps the prior candle's body in the opposite direction. Bullish Engulfing requires a red prior bar followed by a green bar that opens below the prior body low and closes above the prior body high.
Hammer — lower wick exceeds 2× the body size, upper wick is less than half the body. No directional restriction on the body itself.
Shooting Star / Inverted Hammer / Hanging Man — upper wick exceeds 2× body, lower wick less than half the body. The body color separates these: Inverted Hammer is green (treated as bullish), Hanging Man is red (treated as bearish). Shooting Star is the upper-wick pattern used for bearish signals.
How the Components Work Together
The EMA trend state acts as a regime filter, not just a visual layer. A bullish candlestick pattern (Engulfing, Hammer, Inverted Hammer) only triggers a BUY signal when fastEma > slowEma — the pattern fires into the trend, not against it. Similarly, bearish patterns only produce SELL signals when the fast EMA is below the slow EMA.
This prevents the common trap of fading reversals in strong trends. A hammer below the 200 EMA might signal a brief bounce, but it is not a high-probability long in a downtrend. By requiring trend alignment, the indicator reduces false positives from countertrend noise. The tradeoff is that signals at the beginning of a trend reversal — when the fast EMA has not yet crossed — will be missed. This is by design.
Trading Ideas and Insights
On higher timeframes (daily, weekly), use the EMA cloud crossover alert to identify macro trend shifts, then drop to a lower timeframe to look for BUY/SELL pattern signals for entry timing.
After a pullback to or near the fast EMA in an uptrend, a Hammer or Bullish Engulfing signal at that level adds confluence — price has retested the trend structure and showed rejection. Consider these setups stronger than patterns firing far from either EMA.
The Hanging Man (red candle with extended upper wick in an uptrend) triggers a SELL signal when the market is in a downtrend. In practice, watch for this pattern forming near prior resistance or the slow EMA during a counter-rally in a downtrend.
Use the dashboard panel to confirm trend state without scrolling back. On faster timeframes, the 50/200 EMA spread updates frequently; on crypto or forex pairs, consider adjusting the slow EMA to 100 to reduce lag.
Past candlestick patterns do not guarantee future price movement. All signals should be treated as areas of potential interest, not definitive entry triggers.
Unique Aspects
Trend-gating is the core differentiator here. Many candlestick indicators plot patterns on every bar regardless of context; this one explicitly suppresses countertrend signals at the calculation level, so the chart stays clean.
The Inverted Hammer is classified as bullish and the Hanging Man as bearish based on body color, using the upper-wick geometry. Some implementations treat these as the same pattern with identical signals; here they are split by color to reflect their different interpretations in technical analysis.
The EMA cloud uses transparency-adjusted fills that match the trend color, so the visual relationship between the two EMAs immediately communicates regime state without requiring a separate panel.
How to Use
Add the indicator to any chart and timeframe. The EMA cloud and background shading appear immediately, showing the current trend regime.
Watch for BUY labels (green) below bars during uptrend zones (green background) — these mark bars where a bullish pattern fired with trend confirmation.
Watch for SELL labels (red) above bars during downtrend zones (red background).
Set up alerts via the Alerts panel: choose "Aura BUY Signal" or "Aura SELL Signal" for pattern-filtered signals, or "Trend Shift to Uptrend/Downtrend" for EMA crossover notifications.
Check the dashboard (top-right corner) for live trend status and EMA values on the current bar.
Customization
Fast EMA Length (default: 50) — Controls the short-term trend line. Lower values increase sensitivity and produce more cloud crossovers; higher values smooth out the regime filter.
Slow EMA Length (default: 200) — The long-term trend anchor. The 50/200 combination is a widely watched institutional reference; on shorter timeframes, consider 20/50 or 9/21.
Color Candles by Trend — When enabled, all candles recolor to match the current trend state. Disable if you prefer standard OHLC coloring or are using another candle-coloring indicator.
Bullish / Bearish / Neutral Colors — All visual elements (cloud, candles, background, EMAs) derive from these three color inputs, so changing them updates the entire indicator at once.
Conclusion
Aura Trend & Candlestick Oracle combines two well-understood techniques — EMA trend detection and candlestick pattern recognition — with a regime filter that suppresses countertrend noise. It works best on trending markets where the EMA structure is well-defined; in choppy, sideways conditions, expect frequent EMA crossovers and fewer valid pattern signals. Traders who already use candlestick patterns and want an automatic trend-alignment layer without managing multiple indicators will find this a practical consolidation.
Gösterge

Aura Trend & Candlestick Oracle [Pineify]Aura Trend & Candlestick Oracle
This indicator layers EMA-based trend detection with candlestick pattern recognition, then gates the pattern signals through the prevailing trend direction. The idea: candlestick reversals are far more reliable when they fire in alignment with the macro trend rather than against it. A hammer in a downtrend is noise; the same hammer in an uptrend is a potential continuation entry after a pullback.
Key Features
EMA cloud (fast/slow) with dynamic color fill that shifts between bullish, bearish, and neutral states
Five candlestick patterns: Bullish Engulfing, Bearish Engulfing, Hammer, Shooting Star, Inverted Hammer / Hanging Man
Signals filtered by trend — bullish patterns only fire in uptrends, bearish patterns only in downtrends
Background shading highlights trend zones for quick chart-reading
Dashboard panel showing live trend status and current EMA values
Four alert conditions: BUY signal, SELL signal, EMA bullish crossover, EMA bearish crossunder
How It Works
Trend detection uses two exponential moving averages — a fast EMA (default 50) and a slow EMA (default 200). When the fast EMA is above the slow EMA, the script treats the market as an uptrend; when below, a downtrend. This classic crossover relationship provides the filtering layer for all pattern signals.
Candlestick pattern detection evaluates each bar's body size, wick lengths, and direction, then checks the previous bar's properties for multi-bar patterns:
Engulfing patterns — the current candle's body fully wraps the prior candle's body in the opposite direction. Bullish Engulfing requires a red prior bar followed by a green bar that opens below the prior body low and closes above the prior body high.
Hammer — lower wick exceeds 2× the body size, upper wick is less than half the body. No directional restriction on the body itself.
Shooting Star / Inverted Hammer / Hanging Man — upper wick exceeds 2× body, lower wick less than half the body. The body color separates these: Inverted Hammer is green (treated as bullish), Hanging Man is red (treated as bearish). Shooting Star is the upper-wick pattern used for bearish signals.
How the Components Work Together
The EMA trend state acts as a regime filter, not just a visual layer. A bullish candlestick pattern (Engulfing, Hammer, Inverted Hammer) only triggers a BUY signal when fastEma > slowEma — the pattern fires into the trend, not against it. Similarly, bearish patterns only produce SELL signals when the fast EMA is below the slow EMA.
This prevents the common trap of fading reversals in strong trends. A hammer below the 200 EMA might signal a brief bounce, but it is not a high-probability long in a downtrend. By requiring trend alignment, the indicator reduces false positives from countertrend noise. The tradeoff is that signals at the beginning of a trend reversal — when the fast EMA has not yet crossed — will be missed. This is by design.
Trading Ideas and Insights
On higher timeframes (daily, weekly), use the EMA cloud crossover alert to identify macro trend shifts, then drop to a lower timeframe to look for BUY/SELL pattern signals for entry timing.
After a pullback to or near the fast EMA in an uptrend, a Hammer or Bullish Engulfing signal at that level adds confluence — price has retested the trend structure and showed rejection. Consider these setups stronger than patterns firing far from either EMA.
The Hanging Man (red candle with extended upper wick in an uptrend) triggers a SELL signal when the market is in a downtrend. In practice, watch for this pattern forming near prior resistance or the slow EMA during a counter-rally in a downtrend.
Use the dashboard panel to confirm trend state without scrolling back. On faster timeframes, the 50/200 EMA spread updates frequently; on crypto or forex pairs, consider adjusting the slow EMA to 100 to reduce lag.
Past candlestick patterns do not guarantee future price movement. All signals should be treated as areas of potential interest, not definitive entry triggers.
Unique Aspects
Trend-gating is the core differentiator here. Many candlestick indicators plot patterns on every bar regardless of context; this one explicitly suppresses countertrend signals at the calculation level, so the chart stays clean.
The Inverted Hammer is classified as bullish and the Hanging Man as bearish based on body color, using the upper-wick geometry. Some implementations treat these as the same pattern with identical signals; here they are split by color to reflect their different interpretations in technical analysis.
The EMA cloud uses transparency-adjusted fills that match the trend color, so the visual relationship between the two EMAs immediately communicates regime state without requiring a separate panel.
How to Use
Add the indicator to any chart and timeframe. The EMA cloud and background shading appear immediately, showing the current trend regime.
Watch for BUY labels (green) below bars during uptrend zones (green background) — these mark bars where a bullish pattern fired with trend confirmation.
Watch for SELL labels (red) above bars during downtrend zones (red background).
Set up alerts via the Alerts panel: choose "Aura BUY Signal" or "Aura SELL Signal" for pattern-filtered signals, or "Trend Shift to Uptrend/Downtrend" for EMA crossover notifications.
Check the dashboard (top-right corner) for live trend status and EMA values on the current bar.
Customization
Fast EMA Length (default: 50) — Controls the short-term trend line. Lower values increase sensitivity and produce more cloud crossovers; higher values smooth out the regime filter.
Slow EMA Length (default: 200) — The long-term trend anchor. The 50/200 combination is a widely watched institutional reference; on shorter timeframes, consider 20/50 or 9/21.
Color Candles by Trend — When enabled, all candles recolor to match the current trend state. Disable if you prefer standard OHLC coloring or are using another candle-coloring indicator.
Bullish / Bearish / Neutral Colors — All visual elements (cloud, candles, background, EMAs) derive from these three color inputs, so changing them updates the entire indicator at once.
Conclusion
Aura Trend & Candlestick Oracle combines two well-understood techniques — EMA trend detection and candlestick pattern recognition — with a regime filter that suppresses countertrend noise. It works best on trending markets where the EMA structure is well-defined; in choppy, sideways conditions, expect frequent EMA crossovers and fewer valid pattern signals. Traders who already use candlestick patterns and want an automatic trend-alignment layer without managing multiple indicators will find this a practical consolidation.
Gösterge

Smart Money Concepts Order Blocks, Liquidity [LunqFX]Smart Money Concepts — Order Blocks & Liquidity
A professional-grade SMC indicator that answers the three
questions every trader needs before entering a trade:
① What is the current trend?
② Where is the key institutional zone?
③ Is price at that zone right now?
📋 HOW TO USE — STEP BY STEP
The indicator works as a 3-step confirmation system.
Do not enter a trade unless all 3 align.
STEP 1 — READ THE TREND (panel header)
Look at the panel in the top-right corner.
▲ BULLISH → only look for LONG setups
▼ BEARISH → only look for SHORT setups
If the gauge bar shows less than 40% or more than 60%
— the bias is strong. Between 40–60% = no clear edge,
reduce position size or wait.
STEP 2 — WAIT FOR STRUCTURE EVENT
• BOS appears → trend continuation confirmed.
The market broke a key level and is likely to continue.
Look for entries in the direction of the break.
• CHoCH appears → trend is reversing.
This is the earliest signal of a new trend forming.
Higher risk, higher reward — wait for Step 3 to confirm.
Rule: never trade against the last structure signal.
STEP 3 — WAIT FOR PRICE TO RETURN TO THE OB ZONE
After BOS or CHoCH fires, an Order Block zone is drawn
on the chart (blue = bullish, pink = bearish).
Wait for price to pull back INTO that zone.
When price enters the zone:
→ The zone border brightens (active glow effect)
→ The panel "Zone" row shows ▲ BULL OB or ▼ BEAR OB
→ Candle color changes to the zone color
This is your entry window.
✅ FULL SETUP EXAMPLE (LONG)
1. Panel shows ▲ BULLISH
2. CHoCH or BOS fires bullish — structure confirmed
3. Blue Order Block zone is drawn below current price
4. Price pulls back into the blue zone
5. Panel Zone row shows "▲ BULL OB"
6. Enter long — Stop Loss below the OB zone bottom
7. Target: next swing high or previous resistance
✅ FULL SETUP EXAMPLE (SHORT)
1. Panel shows ▼ BEARISH
2. BOS fires bearish — downtrend continuation
3. Pink Order Block zone is drawn above current price
4. Price pulls back up into the pink zone
5. Panel Zone row shows "▼ BEAR OB"
6. Enter short — Stop Loss above the OB zone top
7. Target: next swing low or previous support
⚠️ WHAT TO AVOID
✗ Don't enter on the BOS/CHoCH candle itself —
wait for the pullback to the OB zone
✗ Don't trade a swept (faded/dashed) zone —
it was already mitigated, its edge is gone
✗ Don't fight the trend — if panel says BEARISH,
don't look for longs no matter how good it looks
✗ High ATR (volatile) = widen your stop loss
or reduce position size accordingly
🔷 ORDER BLOCKS
Automatically detects bullish and bearish Order Blocks —
the last opposing candle before a Break of Structure.
Zones use a 2-band gradient (dense core + lighter outer)
to visualize institutional demand and supply areas.
• Active glow: border brightens when price enters the zone
• Swept zones: automatically fade to dashed when mitigated
• Age-based cleanup: old zones removed after set bar count
• Mitigation mode: choose Close or Wick for zone removal
📐 BREAK OF STRUCTURE (BOS) & CHANGE OF CHARACTER (CHoCH)
BOS confirms trend continuation. CHoCH signals a trend
reversal. Only the most recent signal is displayed —
CHoCH automatically clears stale BOS, and BOS clears
stale CHoCH. No visual clutter.
• BOS: dashed line at broken structure level
• CHoCH: solid line with arrow label at pivot bar
• No repaint: all signals fire on confirmed closed candles only
💧 LIQUIDITY — Equal Highs / Equal Lows
Detects EQH and EQL liquidity pools — price levels where
stop-losses cluster. Marks them with dotted lines so you
can anticipate smart money liquidity sweeps.
⚡ FAIR VALUE GAPS (FVG)
Identifies bullish and bearish imbalance zones (3-candle
gaps). Optional — hidden by default to keep the chart clean.
Enable in settings when imbalance confluences matter.
🎨 MOMENTUM GRADIENT CANDLES
Every candle is colored by momentum strength relative to
the last 30 bars. Weak candles = dark muted shade. Strong
impulse candles = vivid bright color. Structure events
(CHoCH/BOS) override with accent colors.
📊 LIVE DASHBOARD PANEL
Top-right panel shows at a glance:
• Trend bias (BULLISH / BEARISH) + visual gauge bar
• Last BOS and CHoCH direction and time
• Current zone status (price inside OB?)
• Active Order Block count per side
• Last confirmed Swing High and Swing Low prices
• ATR(14) with volatility label (LOW / NORMAL / HIGH)
• No Repaint confirmation
✅ NO REPAINT — CONFIRMED CLOSE ONLY
All pivot detections use ta.pivothigh() / ta.pivotlow()
with confirmed lookback. All BOS/CHoCH signals require
barstate.isconfirmed. What you see is what happened —
no repainting, no false signals on open candles.
⚙️ SETTINGS
Structure:
• Swing Length (3–30 bars)
• Max BOS / CHoCH lines shown
• BOS line length
• Show/hide swing pivot markers
Order Blocks:
• Max OBs per side
• Max age in bars
• Swept zone display + age
• Mitigation mode: Close or Wick
Display:
• Momentum candle coloring on/off
• Dashboard panel on/off
• Fair Value Gaps on/off
• Equal H/L liquidity on/off
Works on all instruments and timeframes.
Best used on: Forex, Gold (XAUUSD), Indices, Crypto.
Recommended timeframes: 15m, 30m, 1H, 4H, 1D.
━━━━━━━━━━━━━━━━━━━━━━━━━━━━━━━━━━ Gösterge

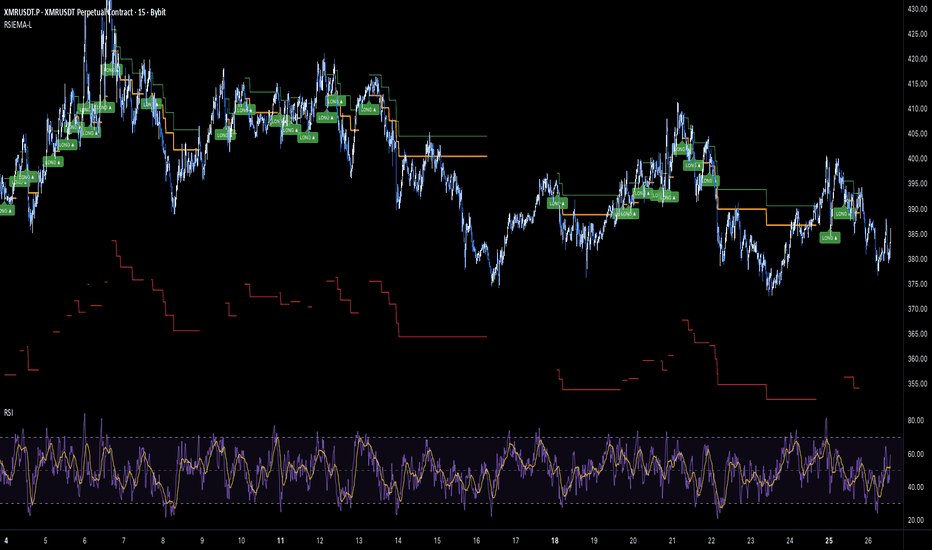
RSI Dip + EMA Trend Long DCA - IndicatorRSI Dip + EMA Trend Long DCA — Leveraged Indicator
🔷 What it does:
This is a signal-only indicator that mirrors a leveraged dip-buying DCA workflow on crypto perpetuals. It tracks one virtual long position at a time, opened only when an oversold dip and an uptrend confirmation align across two lower timeframes. The indicator manages up to four safety orders as price ladders lower, and exits via three independent paths: take profit with trailing, hard stop loss, or a forced close after a maximum holding period. Every event emits a webhook-ready JSON payload tailored for a DCA Bot configured for leveraged futures.
- Dual confirmation entry: RSI(12) crossing down 35 on 5m AND EMA(50) > EMA(100) on 15m.
- Soft-compounding safety ladder: 4 SOs at 1.05× margin progression, deviations 1.00%, 2.20%, 3.64%, 5.37%.
- Three-exit architecture: 1.0% Take Profit with 0.1% trailing, 9% hard Stop Loss, 3-day Max Hold timeout.
- Default leverage 25×, configurable from 1× upward.
- Honest virtual bookkeeping: total notional and qty updated per fill, avg entry / open PnL displayed live.
🔷 Who is it for:
- Active traders running a DCA Bot on leveraged crypto perpetuals who want a systematic dip-buying engine.
- Bot operators who want a chart-driven signal source with per-event JSON ready for a DCA Bot.
- Traders who want to monitor an evolving leveraged position — base entry, owned SO levels, deployed notional, open PnL, time-to-max-hold — directly on the chart.
- Operators comfortable with portfolio-level drawdowns in the 15–20% range in exchange for accelerated returns.
🔷 How does it work:
Entry RSI Filter (Oversold Dip): A 5-minute RSI(12) is sampled via request.security with lookahead disabled. The dip gate fires when RSI crosses down through 35 — momentum has rolled over into oversold.
EMA Trend Filter: A 15-minute EMA(50) and EMA(100) are sampled in parallel. The trend gate is satisfied only while Fast EMA > Slow EMA — broader trend is up. When the EMA cross flips, the dip signal alone cannot open a virtual position.
Entry: When both gates align at host-bar close, the indicator marks a virtual long entry, captures the base entry price, seeds the cost-basis ledger with base margin × leverage notional, and fires the entry webhook payload.
Safety Order Ladder: After base fill, the indicator monitors close price downward against the position. When close reaches base entry × (1 − cumulative deviation), the k-th SO is marked filled, cost-basis is updated, and the SO webhook payload is fired. No additional gating on the SO ladder — pure price.
Honest Virtual Bookkeeping: Total notional and qty are updated incrementally on every event, so the avg entry, deployed notional, and open PnL displayed in the status table reflect the actual broker-equivalent position state — no shortcut from base entry, no synthetic averaging.
Exit Priority: Three exits evaluated in order on each bar: (1) Stop Loss at 9% below average entry, (2) Maximum Hold timeout from base entry, (3) Take Profit at 1.0% above average entry with 0.1% trailing — once price reaches the TP target, the position closes only after a 0.1% retrace from the in-favor peak.
🔷 Why it's unique:
- Two-Layer Confirmation: RSI dip on 5m for timing, EMA stack on 15m for trend bias. The two filters operate on different scales — momentum exhaustion alone cannot fire a signal against a confirmed downtrend, and trend alignment alone cannot fire outside a tactical entry window.
- Three-Exit Architecture: Most DCA tools use one or two exit conditions. This indicator handles all three failure modes explicitly — hard tail-risk stop, stuck-trade timeout release, and momentum-trailing winner exit.
- Leverage-Aware Sizing: Margin and leverage are independent inputs. The virtual ledger tracks notional position, so the avg-entry line and open PnL reflect the leveraged broker state, not unleveraged cash-only math.
- Per-Event Webhook Ledger: Up to seven distinct events per cycle (entry + 4 SO fills + close + max-hold/SL), each with its own JSON alert payload. The indicator drives a DCA Bot end-to-end through a single TradingView alert.
🔷 Considerations Before Using the Indicator:
Market & Timeframe: Designed for liquid crypto perpetuals on 15m. Default thresholds are calibrated for XMRUSDT.P 15m. Different pairs may need EMA period and RSI threshold tuning.
Leverage Warning: The default 25× leverage is aggressive. The companion strategy's backtest at default settings produced 18.01% maximum drawdown — substantially above the 5–10% per-trade band, although that figure reflects portfolio-level accumulation across 779 trades, not single-trade risk. Lower the leverage input to dial down portfolio-level drawdown proportionally.
Cross Detection Granularity: Entries and SO fills are evaluated on bar close. A bar that spikes through a level and returns within the same bar may be missed by design — this matches realistic polling behavior and avoids over-signaling on intra-bar wicks.
Live vs Historical State: The virtual position state is rebuilt from chart history each time the indicator is recompiled. If the indicator is added mid-deployment or the live bot diverges from the signal stream (manual interventions, partial fills), the indicator state may not match the live bot. Toggle the indicator off and on to reset.
No SO Condition: Safety orders fire on pure price ladder with no momentum gate — averaging continues unconditionally as price drops, until SL, MaxHold, or price reversal. Higher average-entry quality in shallow dips; greater unrealized exposure on sharp drops.
Maximum Hold Timeout: The 3-day forced close exists to release capital from stuck trades. The indicator dispatches a close webhook the moment the timeout fires — verify the receiving DCA Bot accepts unconditional close commands.
Funding Rates (Perpetuals): The indicator does not account for perpetual funding rates. Sustained negative funding improves live performance for this long strategy; sustained positive funding degrades it. Review the historical funding pattern before live deployment.
Backtesting Note: This is an indicator, not a strategy. There is no built-in P&L tester. For performance metrics over a 14-month sample (~779 closed trades, 74.07% win rate, 18.01% max drawdown, profit factor 1.313, +30.79% net return), use the companion strategy version on identical parameters.
🔷 How to Use It:
🔸 Add the indicator to a 15m chart on the leveraged perpetual pair you want to trade.
🔸 Review the entry filters (RSI on 5m, EMA stack on 15m), the 4-SO ladder, and the three exit conditions. Defaults are calibrated for XMRUSDT.P 15m at 25× leverage — recalibrate per asset and per risk tolerance before deploying.
🔸 Set leverage and base margin to match your exchange and account configuration. Lower leverage scales portfolio-level drawdown proportionally.
🔸 In the DCA Bot Webhook group, paste the Bot ID, Email Token, and Pair (QUOTE_BASE format, e.g., USDT_XMR).
🔸 Create an alert on the indicator with "Any alert() function call". Paste the DCA Bot's webhook URL into the alert's Webhook field. The indicator will emit JSON payloads for entry, each safety order, and all three close types — formatted for direct DCA Bot consumption.
🔷 INDICATOR SETTINGS
Base Order Margin (USDT): Margin per base trade. Notional = Margin × Leverage. Used for the virtual avg-entry / open-PnL computation.
Leverage (×): Exchange leverage. Default 25×.
Max Safety Orders: Maximum number of safety orders per cycle (default 4).
First SO Margin (USDT): USDT margin of the first safety order; subsequent SOs scale by the Size Multiplier.
Step to First SO (%): Distance from base entry at which SO1 becomes eligible.
Step Multiplier: Ladder factor that widens each subsequent deviation step.
Size Multiplier: Factor that grows each subsequent safety order's USDT margin.
Entry RSI Timeframe / Length / Level: Lower-timeframe RSI oversold-dip filter.
EMA Timeframe / Fast / Slow: Higher-timeframe trend confirmation filter.
Take Profit (%) / Trailing Deviation (%): TP target above avg entry and trailing buffer.
Stop Loss (%): Hard stop below avg entry.
Force Close After Max Hold / Max Hold (seconds): Timeout for forced market close.
DCA Bot Webhook: Bot ID, Email Token, and Pair fields injected into every alert payload.
Visualization: Toggle SO Ladder, Avg / TP / SL plot lines, fill labels, signal triangles, status table.
Brand Watermark: Configurable text, position, size, and transparency.
👨🏻💻💭 We hope this tool helps enhance your trading. Your feedback is invaluable, so feel free to share any suggestions for improvements or new features you'd like to see implemented.
__
The information and publications within the 3Commas TradingView account are not meant to be and do not constitute financial, investment, trading, or other types of advice or recommendations supplied or endorsed by 3Commas and any of the parties acting on behalf of 3Commas, including its employees, contractors, ambassadors, etc. Gösterge

RSI Dip + EMA Trend Long DCA - StrategyRSI Dip + EMA Trend Long DCA — Leveraged Strategy
🔷 What it does:
This is a long-only DCA strategy on leveraged crypto perpetuals that buys oversold dips inside confirmed uptrends. A long entry opens only when the lower-timeframe RSI crosses down into oversold territory AND a higher-timeframe EMA cross confirms the larger trend is up. Four safety orders form a pure-price deviation ladder. Exit is a tight Take Profit with trailing, OR a hard Stop Loss, OR a forced close after a maximum holding period.
- Single base order with up to four safety orders, soft 1.05× size compounding.
- Dual confirmation entry: RSI(12) crossing down 35 on 5m AND EMA(50) > EMA(100) on 15m.
- Three exit paths: 1.0% Take Profit with 0.1% trailing, 9% hard Stop Loss, or forced market close after 3 days max hold.
- Default leverage 25× — per-trade realized risk ~7.17% of equity (inside the 5–10% band).
- Every entry, safety order, and exit emits a webhook-ready JSON alert payload for direct DCA Bot consumption.
🔷 Who is it for:
- Active traders comfortable with leveraged crypto perpetuals who want a systematic dip-buying engine inside confirmed uptrends.
- Bot operators who want a chart-driven signal source with per-event JSON ready for a DCA Bot configured for leveraged futures.
- Traders looking to combine momentum exhaustion (RSI dip) with trend confirmation (EMA stack) for higher-confidence entries.
- Portfolio operators who can absorb a 15–20% maximum drawdown in exchange for ~30% trailing returns over comparable periods.
🔷 How does it work:
Entry RSI Filter (Oversold Dip): A 5-minute RSI(12) is sampled via request.security with lookahead disabled. The dip gate fires when RSI crosses down through 35 — momentum has rolled over into oversold, which on a confirmed uptrend often marks a tactical bounce point.
EMA Trend Filter: A 15-minute EMA(50) and EMA(100) are sampled in parallel. The trend gate is satisfied only while Fast EMA > Slow EMA — the broader trend is up. When the EMA cross flips, the dip signal alone cannot open a trade.
Entry: When both gates align at host-bar close, a long position opens. Base order is configurable as Market (default) or Limit. With default 25× leverage, base margin × leverage = notional position size.
Safety Order Ladder: After base fill, the strategy monitors price deviation downward against the position. No additional gating — pure price ladder. The k-th safety order fires when close ≤ base entry × (1 − cumulative deviation), where cumulative deviation grows by the step multiplier (default 1.2): 1.00%, 2.20%, 3.64%, 5.37%. Each safety order's USDT margin grows by 1.05× — soft compounding.
Exit Priority: Three exit paths evaluated in order on each bar: (1) Stop Loss at 9% below average entry, (2) Maximum Hold timeout at 3 days from base entry, (3) Take Profit at 1% above average entry with 0.1% trailing — once price reaches the TP target, the position closes only after a 0.1% retrace from the in-favor peak.
🔷 Why it's unique:
- Two-Layer Confirmation: RSI(12) dip on 5m for entry timing, EMA(50/100) on 15m for trend bias. The two filters operate on different scales — momentum exhaustion alone cannot open a trade against a confirmed downtrend, and trend alignment alone cannot open a trade outside a tactical entry window.
- Three-Exit Architecture: Hard Stop Loss for tail-risk protection, Maximum Hold timeout for stuck trades that don't reach either bound, and Take Profit with trailing for letting winners run. Most DCA strategies use one or two exits; this one explicitly handles all three failure modes.
- Leverage-Aware Sizing: Base margin and leverage are independent inputs. Margin sets the per-trade capital commitment; leverage sets the notional exposure. Per-trade risk at SL = base + SO margins × SL% — bounded and predictable.
- DCA Bot Integration: Every event (base, SO 1–4, TP/SL/MaxHold close) emits a fully-formed JSON alert payload. Connect one alert to a DCA Bot's webhook URL and the strategy drives the bot end-to-end.
🔷 Considerations Before Using the Strategy:
Market & Timeframe: Defaults are calibrated for BYBIT:XMRUSDT perpetual on 15m. The dip-buying-in-uptrend logic is portable to other liquid crypto perpetuals with clear directional regimes, but the EMA periods and RSI thresholds should be reviewed before redeployment.
Leverage Warning: The default 25× leverage is aggressive. A 9% adverse price move at 25× leverage equals 225% of base margin — the Stop Loss closes the position at full margin loss before liquidation. The per-trade realized risk at SL is approximately 7.17% of equity at default base margin (60 USDT). Lower the leverage input or reduce base margin to dial down per-trade exposure.
Drawdown Profile: The backtest produced a 18.01% maximum equity drawdown over a 14-month sample with 779 closed trades. This is above TradingView's typical 5–10% per-trade band — but the figure reflects portfolio-level accumulation of losing trades across an adverse period, not single-trade risk. Per-trade risk remains inside the 5–10% band; the portfolio-level DD reflects the leveraged compounding and should be sized accordingly within a diversified strategy mix.
No SO Condition: Safety orders fire on pure price ladder with no momentum gate. This means averaging continues unconditionally as price drops, until either SL fires or the price reverses. The trade-off: higher average-entry quality if the dip continues, but greater unrealized loss exposure during sharp drops.
Maximum Hold Period: The 3-day forced close exists to release capital from stuck trades that haven't reached TP or SL. On a 15m chart, this is approximately 288 bars. Adjust the timeout to match your strategy rotation cadence.
Funding Rates (Perpetuals): Backtests do not account for perpetual funding rates. Sustained negative funding (shorts pay longs) improves live performance for this long strategy; sustained positive funding degrades it. Review the historical funding pattern before live deployment.
Demo Testing: Always demo-test before going live. Past results do not guarantee future performance, especially on leveraged strategies where small parameter changes materially affect risk.
🔷 STRATEGY PROPERTIES
Symbol: BYBIT:XMRUSDT.P (Perpetual)
Timeframe: 15M
Test Period: April 1, 2025 — May 26, 2026 (~14 months).
Initial Capital: 10,000 USDT.
Order Size per Trade: 60 USDT margin × 25× leverage = 1,500 USDT notional base + 4 safety orders at 1.05× progression.
Max Capital Deployed (Margin): ~318.6 USDT per trade across base + 4 SOs.
Max Realized Loss per Trade: ~717 USDT at full ladder + SL (~7.17% of equity).
Commission: 0.05% per trade.
Slippage: 3 ticks.
Leverage: 25× (configurable).
Margin for Long Positions: 100%.
Indicator Settings: Default Configuration.
Base Order: 60 USDT margin, Market by default (Limit toggle available).
Take Profit: 1.0% above average entry with 0.1% trailing.
Stop Loss: 9% below average entry (hard close).
Max Hold: 3 days (259,200 seconds) — forced market close.
Entry Filter: 5m RSI(12) Crossing Down 35 AND 15m EMA(50) > EMA(100).
Safety Orders: 4, Deviation 1.0%, Deviation Step 1.2×, Size Multiplier 1.05×.
Strategy: Long Only.
🔷 STRATEGY RESULTS
⚠️ Remember, past results do not guarantee future performance.
Net Profit: +3,078.80 USDT (+30.79%)
Max Equity Drawdown: 2,013.77 USDT (18.01%)
Total Closed Trades: 779
Percent Profitable: 74.07% (577 / 779)
Profit Factor: 1.313
🔷 How to Use It:
🔸 Adjust Settings: Open the strategy inputs and review the Base Margin, Leverage, entry filter (RSI level on 5m, EMA periods on 15m), the 4-SO ladder, and the three exit conditions. Defaults are calibrated for XMRUSDT.P 15m at 25× leverage — recalibrate per asset and per risk profile before deploying.
🔸 Results Review: Run a full-period backtest and confirm Max Drawdown stays inside your personal risk band. The 18% DD at default settings reflects 25× leverage — lower the leverage input to scale risk down proportionally. Validate the closed-trade count (≥ 100 minimum is a comfortable statistical floor).
🔸 Create alerts to trigger the DCA Bot: Add one alert on the strategy using "Any alert() function call". Paste the DCA Bot's webhook URL into the alert's Webhook field, and fill the Bot ID, Email Token, and Pair inputs on the script. The strategy will emit JSON payloads for entry, each safety order, and all three exit types — formatted for direct DCA Bot consumption.
🔷 INDICATOR SETTINGS
Base Order Margin (USDT): Margin per base trade. Notional = Margin × Leverage.
Leverage (×): Exchange leverage. Default 25× — adjust to match your account configuration.
Use LIMIT for Base: Toggle between Market (default) and Limit at bar close.
Max Safety Orders: Maximum number of safety orders per deal (default 4).
First SO Margin (USDT): USDT margin of the first safety order; subsequent SOs scale by the Size Multiplier.
Step to First SO (%): Distance from base entry at which SO1 becomes eligible.
Step Multiplier: Ladder factor that widens each subsequent deviation step.
Size Multiplier: Factor that grows each subsequent safety order's USDT margin.
Entry RSI Timeframe / Length / Level: Lower-timeframe RSI oversold-dip filter.
EMA Timeframe / Fast / Slow: Higher-timeframe trend confirmation filter.
Take Profit (%) / Trailing Deviation (%): TP target above avg entry and trailing buffer.
Stop Loss (%): Hard stop below avg entry.
Force Close After Max Hold / Max Hold (seconds): Timeout for forced market close.
DCA Bot Webhook: Bot ID, Email Token, and Pair fields injected into every alert payload.
Visualization: Toggle SO Ladder, Avg / TP / SL plot lines, fill labels, status table.
Brand Watermark: Configurable text, position, size, and transparency.
👨🏻💻💭 We hope this tool helps enhance your trading. Your feedback is invaluable, so feel free to share any suggestions for improvements or new features you'd like to see implemented.
__
The information and publications within the 3Commas TradingView account are not meant to be and do not constitute financial, investment, trading, or other types of advice or recommendations supplied or endorsed by 3Commas and any of the parties acting on behalf of 3Commas, including its employees, contractors, ambassadors, etc. Strateji
Gösterge

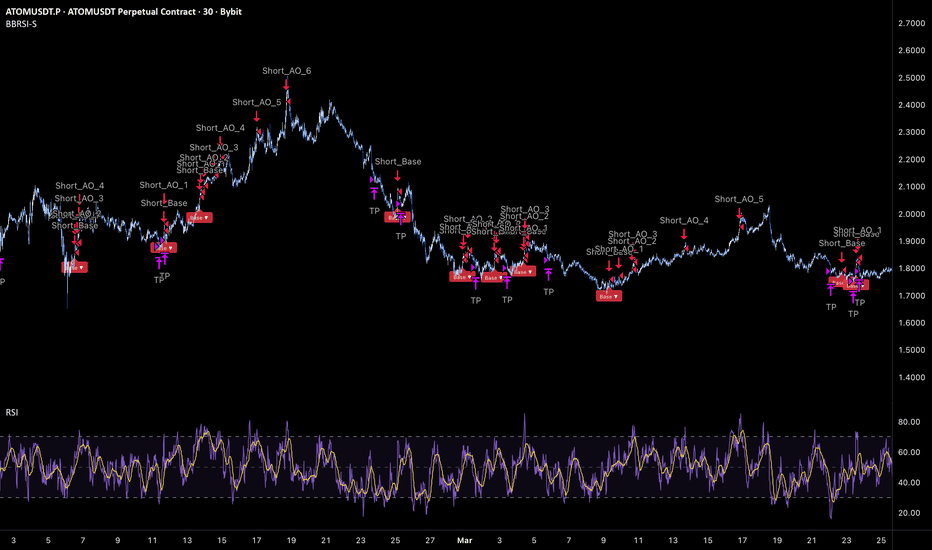
BB-RSI Overbought DCA - Short StrategyBB-RSI Overbought DCA — Short Strategy
🔷 What it does:
This is a short-only DCA strategy that fades overbought thrusts confirmed by two independent volatility-and-momentum filters on a lower timeframe. A short entry opens only when Bollinger Bands %B crosses up the upper band AND RSI crosses up an overbought threshold at the same lower-timeframe close — the dual confirmation requires both volatility-expansion and momentum-overheat to align. Nine safety orders form a wide deviation ladder for adverse upward price action. Exit is a fixed percentage Take Profit below the running average entry. No trailing, no Stop Loss.
- Single base order with up to nine safety orders, sized at a 1.03× progression for soft compounding.
- Dual-filter entry: BB %B(20, 2.0) crossing up 1.00 AND RSI(7) crossing up 65, both on 30m.
- Wide deviation ladder: 0.72% to first safety order, 1.55× step multiplier — last safety order at ~63% above base entry.
- Take Profit: 2.11% below average entry. No trailing.
- Every entry, safety order, and exit emits a webhook-ready JSON alert payload for direct DCA Bot consumption.
🔷 Who is it for:
- Swing traders looking for high-win-rate short exposure on crypto perpetuals that frequently overshoot resistance.
- Bot operators who want a mechanical fade engine with dual confirmation and bounded position size.
- Risk-conscious operators — at default settings the maximum deployed capital is ~8.93% of equity, and the realized maximum drawdown over a 2.5-year sample stayed at 1.53%.
- Traders building a low-correlation portfolio: a defensive short with very low DD and an exceptional profit factor pairs well with directional long strategies.
🔷 How does it work:
Bollinger Bands %B Filter: A 30-minute Bollinger Bands(20, 2.0) is sampled via request.security and converted to %B = (close − lower) / (upper − lower). When %B crosses up the configured level (default 1.00 — price exiting the upper band), the BB gate is satisfied. The 30-minute timeframe is sampled with lookahead disabled to avoid repaint.
RSI Filter: A 30-minute RSI(7) is sampled in parallel. When RSI crosses up the configured level (default 65 — entering overbought), the RSI gate is satisfied. Both gates must be satisfied at the same host-bar close to arm a base entry.
Entry: When both filters cross up on the same host bar, a short position opens at the base order size. The base order is configurable as Market (default) or Limit at the bar's close.
Safety Order Ladder: After the base fill, the strategy monitors price deviation upward against the position. The k-th safety order fires when close ≥ base entry × (1 + cumulative deviation), where cumulative deviation grows by the step multiplier (default 1.55). At default settings: 0.72%, 1.84%, 3.57%, 6.25%, 10.40%, 16.48%, 25.90%, 40.51%, 63.14%. Each safety order's size grows by the size multiplier (default 1.03) — soft compounding rather than aggressive martingale.
Exit: A fixed Take Profit at 2.11% below the running average entry. The position closes the moment close ≤ TP target. No trailing, no Stop Loss.
🔷 Why it's unique:
- Dual-Filter Confirmation: Two independent signals on the same lower timeframe must align. %B captures volatility expansion (price extension beyond statistical bounds); RSI captures momentum exhaustion. Together they filter out either-or noise that would trigger single-condition strategies.
- Soft Compounding Ladder: The 1.03× size multiplier is much gentler than typical martingale (1.5–2.0×). It still scales position size with adverse drift but doesn't blow up capital deployment if all safety orders fill.
- Bounded Position Cap: With 9 safety orders at 1.03× progression, the maximum deployed capital is exactly base + 80 × 10.159 = 893 USDT per trade ≈ 8.93% of default equity. Inside the conventional 5–10% per-trade band, no surprises.
- DCA Bot Integration: Every event (base, AO 1–9, exit) emits a fully-formed JSON alert payload. Connect one alert to a DCA Bot's webhook URL and the strategy drives the bot end-to-end.
🔷 Considerations Before Using the Strategy:
Market & Timeframe: Defaults are calibrated for BYBIT:ATOMUSDT perpetual on 30m. The dual-filter combination is portable to other liquid crypto perpetuals that mean-revert from overbought stretches, but filter thresholds (BB level, RSI level) should be reviewed before redeployment.
Strong Uptrends: Like any fade-the-strength setup, this strategy is positioned for ranges and rotations, not breakouts. In sustained uptrends the strategy may fill the entire 9-AO ladder and hold the short while price grinds higher. The dual filter limits exposure to confirmed overbought conditions, which historically have higher mean-reversion expectancy, but a regime shift to a strong trend requires manual oversight.
Performance Profile: This is a high-confidence, low-volatility, low-return defensive short. Over the 2.5-year backtest the strategy returned +3.95% with a 1.53% maximum drawdown — annualized return is modest, but the return-to-DD ratio of ~2.6 and profit factor of 6.23 reflect very tight risk control. Size accordingly: this is a portfolio contributor, not a standalone alpha source.
Funding Rates (Perpetuals): Backtests do not account for perpetual funding rates. Sustained positive funding on ATOMUSDT.P (longs pay shorts) would improve live performance; sustained negative funding (shorts pay longs) would degrade it. Review the historical funding pattern before live deployment.
Commission Calibration: The default commission (0.4%) is set high as a conservative assumption. The actual Bybit perpetual taker fee is approximately 0.06%, so live performance with realistic Bybit fees should be meaningfully better than the published numbers. Update the commission input to match your fee tier for accurate forward expectations.
No Stop Loss Justification: There is no exit on adverse moves beyond the 9-AO ladder. Per-trade risk is structurally capped by the bounded position-size ladder — at defaults that is 893 USDT max deployed = 8.93% of equity, inside the conventional 5–10% per-trade band. If a hard stop is required at the exchange level, layer it on the bot side.
🔷 STRATEGY PROPERTIES
Symbol: BYBIT:ATOMUSDT.P (Perpetual)
Timeframe: 30M
Test Period: Mar 1, 2025 — Apr 1, 2026 (~1.1 years).
Initial Capital: 10,000 USDT.
Order Size per Trade: 0.8% of Capital base + 9 safety orders at 1.03× progression.
Max Capital Deployed: ~893 USDT per trade (~8.93% of equity).
Commission: 0.4% per trade (conservative — Bybit perpetual taker is ~0.06%).
Slippage: 3 ticks.
Margin for Short Positions: 100%.
Indicator Settings: Default Configuration.
Base Order: 80 USDT, Market by default (Limit toggle available).
Take Profit: 2.11% below average entry (no trailing).
Stop Loss: None — bounded position size is the structural risk cap.
BB %B Filter: 30m BB(20, 2.0), Crossing Up 1.00.
RSI Filter: 30m RSI(7), Crossing Up 65.
Averaging Orders: 9, Deviation 0.72%, Deviation Step 1.55×, Size Multiplier 1.03×.
Strategy: Short Only.
🔷 STRATEGY RESULTS
⚠️ Remember, past results do not guarantee future performance.
Net Profit: +395.18 USDT (+3.95%)
Max Equity Drawdown: 154.46 USDT (1.53%)
Total Closed Trades: 267
Percent Profitable: 79.78% (213 / 267)
Profit Factor: 6.23
🔷 How to Use It:
🔸 Adjust Settings: Open the strategy inputs and review the Base Order Size, BB filter (period / deviation / level), RSI filter (length / level), the 9-AO ladder, and the Take Profit percentage. Defaults are calibrated for ATOMUSDT.P 30m — recalibrate per asset before deploying.
🔸 Results Review: Run a full-period backtest and confirm Max Drawdown stays inside your personal risk band. Validate that the closed-trade count is statistically meaningful (≥ 100 is a reasonable floor). Update commission to match your exchange's actual fees.
🔸 Create alerts to trigger the DCA Bot: Add one alert on the strategy using "Any alert() function call". Paste the DCA Bot's webhook URL into the alert's Webhook field, and fill the Bot ID, Email Token, and Pair inputs on the script. The strategy will emit JSON payloads for short entry, each safety order, and exit — formatted for direct DCA Bot consumption.
🔷 INDICATOR SETTINGS
Base Order Size (USDT): USDT amount opened on the short entry.
Use LIMIT for Base: Toggle between Market (default) and Limit at bar close.
Averaging Orders per Trade: Maximum number of safety orders per deal (default 9).
First AO Size (USDT): USDT size of the first safety order; subsequent AOs scale by the Size Multiplier.
Deviation to First AO (%): Distance from base entry at which AO1 becomes eligible.
Deviation Step Multiplier: Ladder factor that widens each subsequent deviation step.
Order Size Multiplier: Factor that grows each subsequent safety order's USDT size.
BB Timeframe / Period / Deviation / Level: 30-minute Bollinger Bands %B filter on the host symbol.
RSI Timeframe / Length / Level: 30-minute RSI filter on the host symbol.
Take Profit (%): Fixed distance from average entry where the short closes for profit.
DCA Bot Webhook: Bot ID, Email Token, and Pair fields injected into every alert payload.
Visualization: Toggle DCA Ladder, fill labels, status table.
Brand Watermark: Configurable text, position, size, and transparency.
👨🏻💻💭 We hope this tool helps enhance your trading. Your feedback is invaluable, so feel free to share any suggestions for improvements or new features you'd like to see implemented.
__
The information and publications within the 3Commas TradingView account are not meant to be and do not constitute financial, investment, trading, or other types of advice or recommendations supplied or endorsed by 3Commas and any of the parties acting on behalf of 3Commas, including its employees, contractors, ambassadors, etc. Strateji
Gösterge

Confluence FlowConfluence Flow — A multi-layer confluence system combining EVWAP, Adaptive Pivots, Impulse Council & Smart Candles
Confluence Flow unifies five analytical layers — Regime, Momentum, Structure, Pattern, and Confidence — into one powerful overlay. Instead of scattered signals, you get a coherent market narrative through intelligent candle coloring, adaptive levels, and a clean dashboard.
─────────────────────────────────────────────
EVWAP (Exponential Volume Weighted Average Price)
─────────────────────────────────────────────
The heart of the regime filter. This EVWAP dynamically anchors to the most recent significant swing high or low and uses an adaptive half-life that responds to market volatility. Fast markets = faster reaction. Quiet markets = smoother response.
Includes ±1σ and ±2σ bands that clearly show fair value, premium/discount zones, and statistical extremes.
─────────────────────────────────────────────
Adaptive Pivots (S9)
─────────────────────────────────────────────
A next-level dynamic support/resistance system. Band width adapts intelligently using a Trend Quality Index (TQI) based on efficiency, volume, structure, and momentum alignment. High-quality trends get tighter bands. Chop gets wider bands to reduce whipsaws.
─────────────────────────────────────────────
Impulse Council (4-School Voting)
─────────────────────────────────────────────
Four independent schools vote on momentum:
• OBV Flow & Divergence
• Volume Delta (VWMA)
• Wyckoff Springs & Upthrusts
• EMA Confluence (9/21 + 55 filter)
Minimum 2 agreeing schools required for a valid signal.
─────────────────────────────────────────────
Smart Candles
─────────────────────────────────────────────
Candles are colored on a gradient from deep maroon (strong bear) to bright cyan (strong bull) based on the composite bias. Both body and wicks adapt, giving instant visual conviction.
─────────────────────────────────────────────
Pattern Recognition & High-Confidence RR Boxes
─────────────────────────────────────────────
Detects 20 classical patterns with strength scoring and regime alignment filtering. Patterns that conflict with the prevailing regime are automatically dimmed on the chart — keeping your focus on high-probability setups and filtering out counter-trend noise. When a strong pattern aligns with high TQI, strong displacement, and volume — a ★ High Confidence signal triggers automatic 1:2 RR boxes with smart stop placement.
─────────────────────────────────────────────
Dashboard
─────────────────────────────────────────────
Real-time overview of Bias, Council votes, S9 trend, EVWAP direction, and SMA trend.
─────────────────────────────────────────────
Best Used As
─────────────────────────────────────────────
A powerful confluence tool for day traders and swing traders on 5min to 4H timeframes. The strongest setups occur when EVWAP, S9, Council, and Smart Candle bias all align.
Settings default to "Patterns Only" so you can add it without changing your chart's original candle look — toggle to "Candles + Patterns" to enable the full Smart Candle gradient coloring. Gösterge

Heikin Ashi RSI Fade - Short StrategyHeikin Ashi RSI Fade — Short Strategy
🔷 What it does:
This is a short-only strategy that fades extended Heikin Ashi bullish streaks confirmed by a higher-timeframe RSI bias filter. A short entry is opened when the lower-timeframe Heikin Ashi prints a defined number of consecutive bullish candles AND the medium-term RSI is above a soft-bias threshold — the combination targets exhausted bullish thrusts that have run far enough to invite a pullback. The exit is a fixed Take Profit OR a fixed Stop Loss; no trailing, no averaging, no second-guessing.
- Single base order, sized at 1% of equity by default.
- Dual confirmation entry: RSI(100) on 1h > 46 AND 7 consecutive Heikin Ashi bullish candles on 15m.
- Hard exit pair: TP at −2.1% from average entry, SL at +2.5%.
- Every entry and exit emits a webhook-ready JSON alert payload for direct DCA Bot consumption.
🔷 Who is it for:
- Swing traders looking for systematic short exposure on crypto pairs that frequently overrun local resistance.
- Traders who want a clean, mechanical short setup with no averaging and no discretionary management once in trade.
- Bot operators who want to drive a DCA Bot configured for one-shot short deals via webhook.
- Risk-conscious operators — at default settings the worst-case per-trade loss is ~0.025% of equity (well inside the 5–10% per-trade risk band).
🔷 How does it work:
RSI Bias Filter: A long-window RSI(100) is sampled from the 1-hour timeframe via request.security. The threshold (default 46) sits just below the midline, so the filter is satisfied during prolonged bullish drift — exactly the regime where fading strength has the highest expectancy. When RSI falls below 46, the bias is considered to have flipped bearish and the strategy stops looking for new shorts.
Heikin Ashi Streak Trigger: A 15-minute Heikin Ashi stream is sampled in parallel, and the strategy counts the number of consecutive same-direction HA candles using ta.barssince. When the bullish streak reaches the configured length (default 7), the trigger is armed. The default Bullish direction defines the fade-the-strength mode; switching to Bearish converts the strategy into a trend-follow short.
Entry: When BOTH conditions are true at host-bar close, a short position is opened at the base order size. The base order is configurable as Market (default) or Limit at the bar's close.
Exit (OCO): Take Profit and Stop Loss are issued as a paired OCO order through strategy.exit. The first level reached closes the position and automatically cancels the other side — no trailing, no partial exits.
🔷 Why it's unique:
- Dual-Timeframe Confirmation: RSI on 1h filters macro bias, Heikin Ashi on 15m times the entry. The two conditions operate on different scales so they cannot be satisfied by the same noise pattern — every entry requires alignment across both.
- Fade-or-Follow Switch: A single input flips the HA direction filter between Bullish (fade strength, default) and Bearish (follow trend). The same engine handles two opposing strategy archetypes.
- Bounded Trade Risk: With a single base order and a hard Stop Loss, the maximum loss per trade is exactly base size × SL%. At defaults that is 2.5 USDT on 10,000 — structural risk capping without any complex sizing logic.
- DCA Bot Integration: Each event emits a fully-formed JSON alert payload tagged with the action type, so the strategy can drive a DCA Bot configured for one-shot deals directly through TradingView alerts.
🔷 Considerations Before Using the Strategy:
Market & Timeframe: Designed and tested on XRPUSDT 1H, Binance Spot, over a five-year sample. The RSI-and-Heikin-Ashi combination is portable to other liquid crypto pairs that respect mean-reversion behavior, but the filter thresholds (RSI level, HA streak length) should be reviewed before redeployment.
Performance Profile: This is a low-volatility, low-return defensive short. Over the 349-trade backtest the strategy returned +0.44% with a 0.47% maximum equity drawdown — a return-to-DD ratio just below 1, with a profit factor of 1.117. The value proposition is structural risk capping over a large statistical sample, not aggressive alpha. Size accordingly within a diversified portfolio.
Trending Markets: In strong sustained uptrends, the strategy will continue to fire short entries and will incur stop-outs as price grinds higher. This is by design — the strategy is positioned for ranges and rotations, not breakouts. The 1h RSI(100) > 46 filter limits exposure to confirmed bullish regimes only, which is where fading has an edge; a regime change to a stronger trend will require manual oversight or a wider Stop Loss.
Sample Size & Parameters: If a full-period backtest produces fewer than ~100 closed trades, either extend the period or lower the HA streak length to 5. Re-save the relaxed value as the new default so the publication continues to satisfy the "Default Properties match" rule.
Commission & Slippage: Defaults reflect Bybit perpetual taker conditions (0.06% commission, 3 ticks slippage). Update both inputs to match your exchange's actual fees before relying on the backtest numbers.
Past Performance: Past results do not guarantee future performance. Always demo-test before deploying live capital, and size the strategy as one part of a diversified portfolio.
🔷 STRATEGY PROPERTIES
Symbol: BINANCE:XRPUSDT (Spot)
Timeframe: 1H
Test Period: Mar 1, 2025 — May 22, 2026.
Initial Capital: 10,000 USDT.
Order Size per Trade: 1% of Capital (single base order, no averaging).
Max Capital Deployed: 100 USDT per trade (~1% of equity).
Worst-Case Loss per Trade: ~2.5 USDT (~0.025% of equity).
Commission: 0.06% per trade.
Slippage: 3 ticks.
Margin for Short Positions: 100%.
Indicator Settings: Default Configuration.
Base Order: 100 USDT, Market by default (Limit toggle available).
Take Profit: 2.1% below average entry (no trailing).
Stop Loss: 2.5% above average entry (close trade).
RSI Filter: 1h RSI(100) > 46.
Heikin Ashi Filter: 15m Heikin Ashi, 7 consecutive bullish candles.
Strategy: Short Only.
🔷 STRATEGY RESULTS
⚠️ Remember, past results do not guarantee future performance.
Net Profit: +44.33 USDT (+0.44%)
Max Equity Drawdown: 46.78 USDT (0.47%)
Total Closed Trades: 349
Percent Profitable: 59.31% (207 / 349)
Profit Factor: 1.117
🔷 How to Use It:
🔸 Adjust Settings: Open the strategy inputs and review the Base Order Size, RSI filter (timeframe / length / level), and the Heikin Ashi filter (timeframe / streak length / direction). Defaults are calibrated for XRPUSDT 2H — recalibrate per asset before deploying.
🔸 Results Review: Run a full-period backtest and confirm Max Drawdown stays inside your personal risk band. Validate that the closed-trade count is statistically meaningful (≥ 100 is a reasonable floor). Use realistic commission and slippage for your exchange.
🔸 Create alerts to trigger the DCA Bot: Add one alert on the strategy using "Any alert() function call". Paste the DCA Bot's webhook URL into the alert's Webhook field, and fill the Bot ID, Email Token, and Pair inputs on the script. The strategy will emit JSON payloads for short entry and exit — TP, SL, or manual close — formatted for direct DCA Bot consumption.
🔷 INDICATOR SETTINGS
Base Order Size (USDT): USDT amount opened on the short entry.
Use LIMIT for Base: Toggle between Market (default, more conservative for backtest) and Limit at bar close.
RSI Timeframe / Length / Condition / Level: Lower-timeframe RSI bias filter applied to the host symbol.
HA Timeframe / Streak / Direction: Heikin Ashi consecutive-candle trigger on the lower timeframe. Direction defines fade (Bullish) vs follow (Bearish) mode.
Take Profit (%) / Stop Loss (%): Fixed distance exits from average entry.
DCA Bot Webhook: Bot ID, Email Token, and Pair fields injected into every alert payload.
Visualization: Toggle Avg Entry / TP / SL plot lines, fill labels, status table.
Brand Watermark: Configurable text, position, size, and transparency.
👨🏻💻💭 We hope this tool helps enhance your trading. Your feedback is invaluable, so feel free to share any suggestions for improvements or new features you'd like to see implemented.
__
The information and publications within the 3Commas TradingView account are not meant to be and do not constitute financial, investment, trading, or other types of advice or recommendations supplied or endorsed by 3Commas and any of the parties acting on behalf of 3Commas, including its employees, contractors, ambassadors, etc. Strateji

Candlestick PatternsTitle: Candlestick Patterns
Description:
Detects and labels 15 classic Japanese candlestick patterns in real time, with a multi-timeframe trend filter that highlights which signals align with the prevailing trend direction.
Patterns detected
Single-candle patterns: Doji, Hammer, Hanging Man, Inverted Hammer, Shooting Star.
Two-candle patterns: Bullish Engulfing, Bearish Engulfing, Bullish Harami, Bearish Harami, Piercing Line, Dark Cloud Cover.
Three-candle patterns: Morning Star, Evening Star, Three White Soldiers, Three Black Crows.
Pattern logic
Candle anatomy is computed from body, upper wick, lower wick, and full range on each bar. The wick-to-body ratio threshold is configurable — default 2.0x means the shadow must be at least twice the body size for hammer and shooting star shapes. The Doji threshold is expressed as body size as a percentage of the full range, defaulting to 10%.
Engulfing patterns require the current candle to fully contain the prior candle's body. Harami requires the current body to fit inside the prior range and be less than 60% of the prior body size. Piercing Line requires the close to cross above the midpoint of the prior bearish candle; Dark Cloud Cover requires the close to cross below the midpoint of the prior bullish candle.
Morning and Evening Star use a three-bar setup: a strong directional candle, followed by a small-body indecision candle (body less than 30% of its range), followed by a confirmation candle that closes past the midpoint of the first candle.
Three White Soldiers and Three Black Crows require three consecutive same-direction closes, each higher/lower than the last, with the opens gapping slightly into the prior body.
Trend filter
An EMA crossover (default 20/50) determines trend direction on the current timeframe and three configurable higher timeframes via request.security(). With-trend signals are displayed at full opacity; counter-trend signals are shown at reduced opacity. An optional filter hides counter-trend patterns entirely.
MTF Trend Panel
A compact table in the bottom-right corner shows the current trend direction (▲ Bull / ▼ Bear) across the current timeframe plus the three configured higher timeframes, with the EMA pair displayed as a label. Each cell is color-coded green or red.
Display
Each detected pattern places a label above (bearish) or below (bullish) the candle with the pattern name. A subtle background color fill highlights the bar. Both label colors and background highlights are independently configurable.
Works on any instrument and timeframe. Gösterge

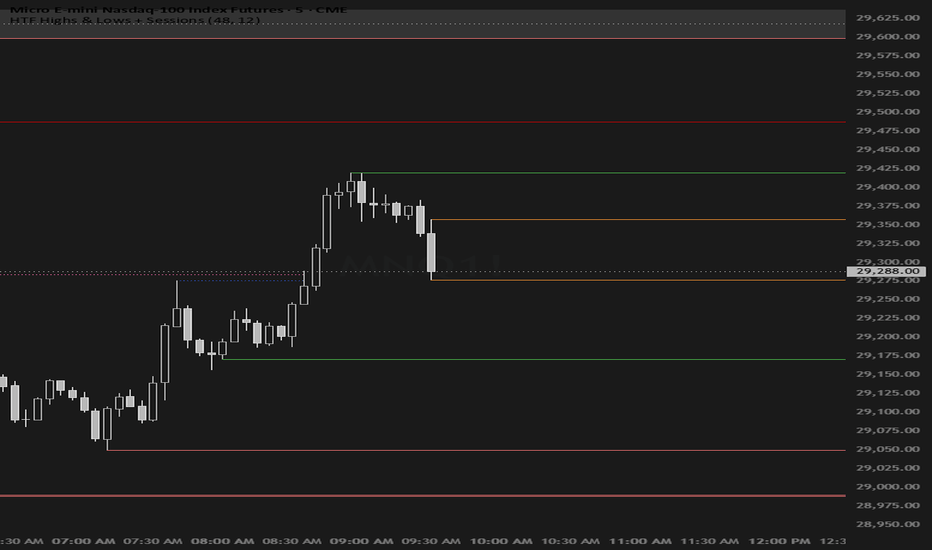
HTF Highs & Lows + SessionsHTF Highs & Lows + Sessions
This indicator plots two categories of information on your chart: higher timeframe swing levels and session highs/lows.
HTF Swing Levels
Scans 1H, 4H, and 1D candles for a specific two-bar reversal pattern — a bullish candle followed by a bearish candle (for swing highs) or a bearish candle followed by a bullish candle (for swing lows). When that pattern is found, it marks the extreme of those two candles as a significant price level. It then checks if that level has already been taken out by a subsequent candle — if it has, the level is ignored. If it hasn't, it draws a horizontal ray extending to the right from that price. Each timeframe has its own color (light red for 1H, bright red for 4H, dark red for 1D) so you can quickly identify which timeframe a level belongs to.
If price takes out one of these levels during the sweep window (8am–12pm ET), the ray converts to a dotted line and stops extending, marking it as swept rather than deleting it entirely.
Session Highs & Lows
Tracks the high and low of four sessions in real time — New York (9:30–5pm ET), London (3–8am ET), Asia (6pm–3am ET), and Pre Market (8–9:30am ET). Each session gets a live horizontal line at its current high and low that updates as price moves. When price breaks a session level outside the sweep window the line is deleted. When price breaks it inside the sweep window (8am–12pm ET) it converts to a dotted line instead, preserving the swept level visually. Session lines only display on intraday timeframes and are hidden on the daily and above.
Intended Use
Designed for traders who use higher timeframe liquidity levels as context for intraday entries — particularly identifying which HTF swing points have been swept during the early New York session window, which is a core concept in smart money / ICT-based trading frameworks. Gösterge