(Quartile Vol.; Vol. Aggregation; Range US Bars; Gaps) [Kioseff]Hello!
This indicator is a multifaceted tool that's, hopefully, useful for price action and volume analysis.
(This script makes use of the newly introduced "text_font" parameter)
With this script you'll have access to:
Range US Chart
Volume Aggregation Chart
Gaps Chart
Volume by Quartile
Consequently, you'll have access to:
First Quartile Volume Threshold
Second Quartile Volume Threshold
Third Quartile Volume Threshold
90th Percentile Volume Threshold
Fourth Quarti
Göstergeler ve stratejiler
Cup & HandleHi, here is my take on 'Cup & Handle'
Pivot Points - ph (highest points in a certain period) are stored in an array
When there is a new ph , previous ph's are compared to the latest one.
A temporary test line is drawn between these 2 points.
The script checks if a close (between these 2 points) doesn't break above this test line.
(test line is deleted afterwards)
If it doesn't, and the '% max breaks' are not breached, 2 circle shaped lines are drawn
(Top & Bottom line of the cup) which f
Blockchain Fundamentals - Active Address Sentiment Osc. [CR]Blockchain Fundamentals: Active Address Sentiment Oscillator AASO
Back with another script today, this one is a useful tool in helping to determine bitcoins value. We are looking at 2 data sources: the daily active addresses on the BTC blockchain, and the daily returns of BTC.
THIS INDICATOR WILL ONLY GIVE YOU THE CORRECT RESULTS ON THE DAILY TIMEFRAME
There is an interesting relationship that you can see by comparing the two timeseries. But for us to create a good indicator we first
Gann Square of 144This indicator will create lines on the chart based on W.D. Gann's Square of 144. All the inputs will be detailed below
Why create this indicator?
I didn't find it on Tradingview (at least with open source). But the main reason is to study the strategy and be able to draw it fast. Manually drawing the square is not hard, but moving all together to the right spots and scale was time-consuming.
It has a lot of inputs...
Yes, each square point divisible by 6 has information with some options
Annual Returns % Comparison [By MUQWISHI]Overview
The Annual Returns % Comparison indicator aimed to compare the historical annual percentage change of any two symbols. The indicator output shows a column-plot that was developed by two using a pine script table, so each period has pair columns showing the yearly percentage change for entered symbols.
Features
- Enter date range.
- Fill up with any two symbols.
- Choose the output data whether adjusted or not.
- Change the location of the table plot
- Color columns by a symbol.
R:R Trading System FrameworkFirst off, huge thanks to @fikira! He was able to adapt what I built to work much more efficiently, allowing for more strategies to be used simultaneously. Simply put, I could not have gotten to this point without you. Thanks for what you do for the TV community. Second, I am fairly new to pinescript writing, so I welcome criticism, thoughtful input and improvement suggestions. I would love to grow this concept into something even better, if possible. So please let me know if you have any ideas
Bjorgum Double Tap█ OVERVIEW
Double Tap is a pattern recognition script aimed at detecting Double Tops and Double Bottoms. Double Tap can be applied to the broker emulator to observe historical results, run as a trading bot for live trade alerts in real time with entry signals, take profit, and stop orders, or to simply detect patterns.
█ CONCEPTS
How Is A Pattern Defined?
Doubles are technical formations that are both reversal patterns and breakout patterns. These formations typically have a dist
Fourier Extrapolator of Price w/ Projection Forecast [Loxx]Due to popular demand, I'm pusblishing Fourier Extrapolator of Price w/ Projection Forecast.. As stated in it's twin indicator, this one is also multi-harmonic (or multi-tone) trigonometric model of a price series xi, i=1..n, is given by:
xi = m + Sum( a*Cos(w*i) + b*Sin(w*i), h=1..H )
Where:
xi - past price at i-th bar, total n past prices;
m - bias;
a and b - scaling coefficients of harmonics;
w - frequency of a harmonic ;
h - harmonic number;
H - total number of fitted harmoni
VisibleChart█ OVERVIEW
This library is a Pine programmer’s tool containing functions that return values calculated from the range of visible bars on the chart.
This is now possible in Pine Script™ thanks to the recently-released chart.left_visible_bar_time and chart.right_visible_bar_time built-ins, which return the opening time of the leftmost and rightmost bars on the chart. These values update as traders scroll or zoom their charts, which gives way to a class of indicators that can dynamicall
Time█ OVERVIEW
This library is a Pine Script™ programmer’s tool containing a variety of time related functions to calculate or measure time, or format time into string variables.
█ CONCEPTS
`formattedTime()`, `formattedDate()` and `formattedDay()`
Pine Script™, like many other programming languages, uses timestamps in UNIX format, expressed as the number of milliseconds elapsed since 00:00:00 UTC, 1 January 1970. These three functions convert a UNIX timestamp to a formatted string fo
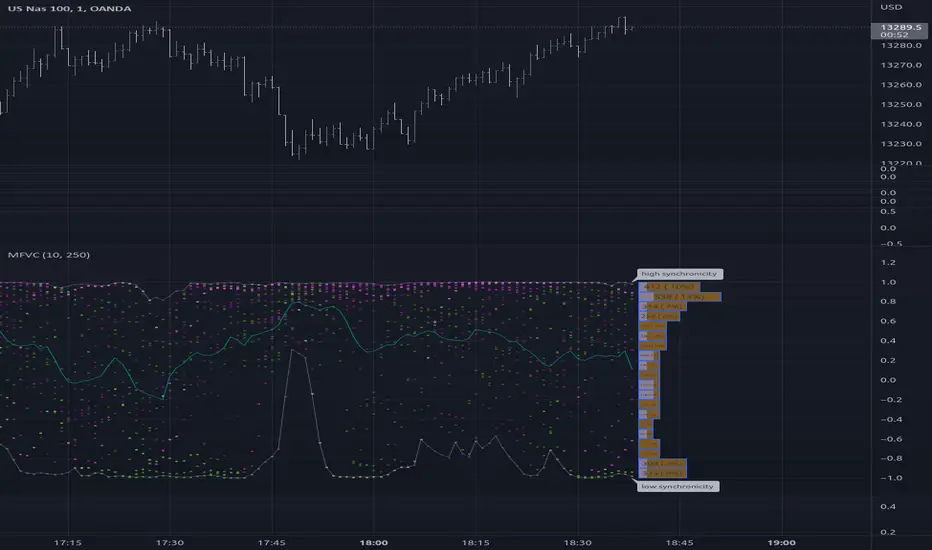
Multiple Frequency Volatility CorrelationThis is a complex indicator that looks to provide some insight into the correlation between volume and price volatility.
Rising volatility is depicted with the color green while falling volatility is depicted with purple.
Lightness of the color is used to depict the length of the window used, darker == shorter in the 2 -> 512 window range.
Relative Bandwidth FilterThis is a very simple script which can be used as measure to define your trading zones based on volatility.
Concept
This script tries to identify the area of low and high volatility based on comparison between Bandwidth of higher length and ATR of lower length.
Relative Bandwidth = Bandwidth / ATR
Bandwidth can be based on either Bollinger Band, Keltner Channel or Donchian Channel. Length of the bandwidth need to be ideally higher.
ATR is calculated using built in ATR method and ATR l
Breakout Probability (Expo)█ Overview
Breakout Probability is a valuable indicator that calculates the probability of a new high or low and displays it as a level with its percentage. The probability of a new high and low is backtested, and the results are shown in a table— a simple way to understand the next candle's likelihood of a new high or low. In addition, the indicator displays an additional four levels above and under the candle with the probability of hitting these levels.
The indicator helps traders to
Point of Control V2 The genesis of this project was to create a POC library that would be available to deliver volume profile information via pine to other scripts of indicators and strategies.
This is a republish of an invite only script to open access
This is the indicator version of the library function.
A few points of significance:
- Allows the choice of reset of the study period, day/week or bars. This is simple enough to expand to other conditions
- Bar count resets starting from the beginning of the dat
Andean OscillatorThe following script is an original creation originally posted on the blog section of the broker Alpaca.
The proposed indicator aims to measure the degree of variations of individual up-trends and down-trends in the price, thus allowing to highlight the direction and amplitude of a current trend.
Settings
Length : Determines the significance of the trends degree of variations measured by the indicator.
Signal Length : Moving average period of the signal line.
Usage
The Andean
Auto Trendline Indicator (based on fractals)A tool that automatically draws out trend lines by connecting the most recent fractals.
Description:
The process of manual drawing out trend lines is highly subjective. Many times, we don’t trade what we see, but what we “want to see”. As a result, we draw lines pointing to the direction that we wishfully want price to move towards. While there are no right/wrong ways to draw trend lines, there are, however, systematic/unsystematic ways to draw trend lines. This tool will systematically draw
Chart VWAP█ OVERVIEW
This indicator displays a Volume-Weighted Average Price anchored to the leftmost visible bar of the chart. It dynamically recalculates when the chart's visible bars change because you scroll or zoom your chart.
If you are not already familiar with VWAP, our Help Center will get you started. The typical VWAP is designed to be used on intraday charts, as it resets at the beginning of the day. Our Rolling VWAP , instead, resets on a rolling time window. You may also find the
Ichimoku Kinkō hyō 目均衡表█ OVERVIEW
Ichimoku is known to be an Indicator that completes itself, for its power but also for its complexity. This is why I decided to improve the work of
Goichi Hosoda in order to offer the maximum number of options for the most seasoned users but also beginners with options to simplify the
reading of Ichimoku (such as a panel directly giving you the status of each Ichimoku options or Supports/Resistances drawn automatically
according to the conditions chosen in the settings.
█ OPTION
Traling.SL.TargetTrailing SL and Target
I have seen few requests in PineScripters telegram group asking questions about implementation of trailing stop-loss (SL) and targets. This script is one of the way to implement the same.
This script is developed based on dark color theme and is best viewed using dark color theme.
How and where can this script be used:
The script is built to demonstrate how one can implement the trailing SL and target, so by referring the script one can mimic the approach and add traili
Market Structure Break & Order Block by EmreKbThis indicator shows the market structure break (msb) and order blocks (ob). Msb occurs after the breakout old high when the price make lower lows or occurs after the breakout old low when the price make higher highs. OB occurs after the msb, ob is the last bullish candle before high if msb is bearish but if the msb is bullish then ob is the last bearish candle before low.
Zigzag Lenght - A number for the zigzag calculation
Show Zigzag - Show/Hide Zigzag lines
Fib Factor - Fib level for the br
Template Trailing Strategy (Backtester)💭 Overview
+ Title: Template Trailing Strategy (Backtester)
+ Author: Iason Nikolas (jason5480)
+ License: CC BY-NC-SA 4.0
💢 What is the "Template Trailing Strategy (Backtester)" ❓
The "Template Trailing Strategy (Backtester)" (TTS) is a back-tester orchestration framework. It supercharges the implementation-test-evaluation lifecycle of new trading strategies, by making it possible to plug in your own trading idea.
While TTS offers a vast number of configuration settings, it primarily
TASC 2022.07 Pairs Rotation With Ehlers Loops█ OVERVIEW
TASC's July 2022 edition of Traders' Tips includes an article by John Ehlers titled "Pairs Rotation With Ehlers Loops". This is the code that implements the Ehlers Loops applied to pairs rotation trading.
█ CONCEPTS
John Ehlers developed Ehlers loops as a tool to visualize the performance of one data stream versus another. Initially, he used this tool to chart price versus volume. However, Ehlers loops proved to be suitable for determining the timing of the pairs rotation s
CVD - Cumulative Volume Delta Candles█ OVERVIEW
This indicator displays cumulative volume delta in candle form. It uses intrabar information to obtain more precise volume delta information than methods using only the chart's timeframe.
█ CONCEPTS
Bar polarity
By bar polarity , we mean the direction of a bar, which is determined by looking at the bar's close vs its open .
Intrabars
Intrabars are chart bars at a lower timeframe than the chart's. Each 1H chart bar of a 24x7 market will, for example, usuall