Order Block Zone Study + ConfirmationOrder Block Zone Study + Confirmation marks support and resistance order-block zones, then helps users judge whether price is only reaching a zone or reacting with confirmation.
It is designed to answer three simple questions:
Where is the order-block zone?
How strong is the zone based on the model?
Is price only touching it, or is confirmation also active?
The goal is not to give automatic trade calls. The goal is to make order-block zones easier to read, compare, and monitor.
==================================================
WARNING
==================================================
This indicator is a chart-reading tool. It does not predict the future and does not guarantee that any order block will hold.
The labels, scores, observed stats, and confirmation markers are based on the script's internal model and the available chart data. They should be used as context, not as financial advice or as standalone buy/sell instructions.
A zone can look strong and still fail. Always check the broader trend, market structure, liquidity, news risk, and your own risk management.
==================================================
(1) OVERVIEW
==================================================
This indicator has two main parts.
1) Order-block zone detection
The script detects bullish and bearish order-block-style zones.
Support OB - a bullish order-block zone that may act as support.
Resistance OB - a bearish order-block zone that may act as resistance.
The zone logic uses several chart conditions together, including:
swing highs and swing lows
the last opposite candle before a displacement move
ATR-based displacement strength
EMA trend alignment
premium / discount location
pivot support or resistance confluence
body expansion and relative volume
current market bias
2) Confirmation add-on
The confirmation layer checks whether price is simply reaching the zone or whether the reaction is supported by additional conditions.
It can use:
fast EMA position
fast EMA direction
RSI behavior
MACD behavior
candle direction
relative volume
The box shows where the zone is. The label explains the zone quality. The triangle shows that confirmation conditions are active.
==================================================
(2) WHAT YOU SEE ON THE CHART
==================================================
Boxes - active support or resistance OB zones.
Labels - zone type, grade, status, observed behavior, edge class, and model rating.
Triangles - confirmation conditions after price reaches or approaches a zone.
Faded zones - historical or invalidated zones kept for visual context.
Midline - the center of the zone, useful for reading depth of reaction.
The indicator is designed to keep the latest active zones visible and reduce chart clutter by limiting how many zones and labels remain on the chart.
==================================================
(3) HOW TO USE IT PROPERLY
==================================================
The correct way to use this indicator is to read the zone step by step, not only look at the box.
Simple workflow
Find the zone.
Check whether price is reacting around a support OB or resistance OB.
Read the label.
The label explains the model grade, zone status, observed behavior, edge class, and final model rating.
Check the status.
Fresh zones are usually cleaner than tested zones. Broken zones should not be treated as active zones.
Wait for reaction quality.
A zone touch alone is only the first step. Confirmation adds evidence that price is reacting.
Use the triangle as confirmation context.
A triangle means the confirmation engine found enough supporting conditions. It is not a guaranteed entry.
Check broader market structure.
Use the indicator together with trend, support/resistance, liquidity, and risk management.
The best reading comes when the zone type, label quality, status, confirmation, and broader market structure all support the same idea.
==================================================
(4) LABEL EXPLANATION
==================================================
A label may look like this:
Support OB | Grade A | Status Fresh | Observed 61.2% | Edge Strong | Model 8.1/10
Support OB / Resistance OB
This tells you the zone type.
Support OB - bullish order-block zone, treated as possible support.
Resistance OB - bearish order-block zone, treated as possible resistance.
Grade
The grade summarizes the internal zone score.
A++ - 86 or higher
A - 72 to 85.99
B+ - 60 to 71.99
B - 48 to 59.99
C - below 48
A++ and A are stronger model grades. B+ is acceptable. B and C are weaker.
Status
The status explains the current condition of the zone.
Fresh - price has not touched the zone yet.
Tested - price already touched the zone.
Broken - price invalidated the zone.
Fresh is usually cleaner than tested. Broken means the zone is no longer active.
Observed
Observed shows the script's chart-based observation for that side of the model. It combines how often zones were touched and how often resolved zones reached the model target before invalidation.
This is not a guaranteed win rate. It depends on available chart history and the number of resolved examples.
Edge
Edge classifies the model's observed reward/risk behavior into simple language:
Weak
Slightly Weak
Neutral
Strong
Very Strong
This is based on observed target/invalidation behavior, ATR-based target and invalidation distances, and confidence from sample size.
Model
Model is the final combined rating from 1 to 10.
It combines:
zone grade
zone status
observed behavior
edge class
confidence from available outcomes
A practical reading:
8 to 10 - stronger model reading
6 to 7.9 - decent model reading
4 to 5.9 - average or weaker reading
below 4 - low-quality reading
==================================================
(5) PRACTICAL LABEL EXAMPLES
==================================================
Example 1
Support OB | Grade A | Status Fresh | Observed 63% | Edge Strong | Model 8.2/10
This is a stronger support-zone reading. If price returns and confirmation appears, the reaction has better model support.
Example 2
Resistance OB | Grade B+ | Status Fresh | Observed 55% | Edge Neutral | Model 6.6/10
This is a watchlist-quality resistance zone. It may be useful, but it is not as strong unless confirmation appears.
Example 3
Support OB | Grade A++ | Status Tested | Observed 60% | Edge Strong | Model 7.4/10
The grade is strong, but the zone has already been tested. It can still matter, but it is less clean than a fresh zone.
Example 4
Resistance OB | Grade C | Status Fresh | Observed 47% | Edge Weak | Model 3.8/10
This is a weak model reading. Even if price reaches it, it should not be trusted alone.
Example 5
Support OB | Grade B+ | Status Fresh | Observed 58% | Edge Neutral | Model 6.9/10
This is a decent zone, but if there is no confirmation, it is usually better to keep watching instead of treating the touch as enough.
==================================================
(6) CONFIRMATION
==================================================
Confirmation is optional, but useful.
The order block marks the important area. The confirmation add-on checks whether price is reacting with enough supporting evidence.
Simple logic
OB zone = where price may react.
Label = how good the zone looks according to the model.
Triangle = confirmation conditions are active.
For support confirmation, the script checks whether price is inside or near the support OB and whether enough bullish confirmation conditions are active.
For resistance confirmation, it checks the opposite side.
The confirmation engine can include:
EMA position
EMA direction
RSI behavior
MACD behavior
candle behavior
relative volume
A zone touch starts the observation. Confirmation adds extra evidence that the reaction may be developing.
==================================================
(7) ALERTS
==================================================
The alert conditions can be grouped into three simple types.
1) Zone reached alerts
These alerts tell you price has reached a support or resistance OB zone.
This means the area is active, but confirmation may not be present yet.
2) Zone reached + confirmation alerts
These alerts tell you price reached the zone and confirmation conditions are active.
This is the stronger alert type, but it is still only a chart condition.
3) Confirmation only / any event alerts
These alerts are broader monitoring alerts. They are useful when you want to know that a support or resistance event is happening, even if you do not want a very specific alert.
Reached only = start watching
Reached + confirmation = stronger chart condition
Alerts are monitoring tools. They are not trade instructions and do not guarantee a result.
==================================================
(8) HOW THE MODEL IS CALCULATED
==================================================
1. Zone Score
Score = Base + Displacement + Break + Trend + Body + Volume + PD Filter + S/R Filter + Bias + Edge
The score combines several pieces of zone quality, including displacement strength, structure break, trend alignment, candle body expansion, volume expansion, premium/discount location, pivot confluence, market bias, and observed edge.
2. Quality Grade
Quality Grade = function of Score
The raw score is converted into A++, A, B+, B, or C.
3. Zone Status
Zone Status = Fresh, Tested, or Broken
The status depends on whether price has touched or invalidated the zone.
4. Observed Rate
Observed Rate = Target Rate x Touch Rate
This combines how often zones are revisited and how often resolved zones reach the model target before invalidation.
5. Target Rate
Target Rate = Targets Reached / Resolved Zones x 100
This measures resolved zones only.
6. Touch Rate
Touch Rate = Touches / Total Zones x 100
This measures how often detected zones were revisited by price.
7. Reward/Risk Ratio
RR = Target ATR Multiplier / Invalidation ATR Multiplier
This is based on the ATR target and invalidation settings.
8. Edge
Edge = Target Rate x RR - (1 - Target Rate)
This estimates whether the observed target/invalidation behavior is positive, neutral, or weak.
9. Confidence
Confidence = min(Resolved Outcomes / Minimum Observed Outcomes, 1.0)
Confidence adjusts how much trust is placed on the observed stats. Low sample size means lower confidence.
10. Final Model Rating
Model Rating = Grade Score + Status Score + Observed Score + Edge Score
This creates the final label rating from 1 to 10.
==================================================
(9) IMPORTANT LIMITATIONS
==================================================
This script does not know the future. It only evaluates chart conditions using its internal rules.
Observed stats can be unreliable when there are not enough resolved examples. A label can show useful context, but it should not be treated as proof that the next zone will work.
Order blocks can fail during strong trends, news events, low-liquidity conditions, or when broader market structure changes.
Use the model rating as context, not certainty.
==================================================
DISCLAIMER
==================================================
This script is a public open-source indicator for educational and informational use.
It is not financial advice, investment advice, or a recommendation to buy or sell any asset.
The script identifies order-block-style chart zones and confirmation conditions only. It does not guarantee profitable trades, signal accuracy, or future performance.
Users should always apply their own analysis, position sizing, and risk management before making any trading decision.
Gösterge

HTF/LTF Alignment ("Trend Is your Friend, Until the end!")HTF/LTF Alignment Dashboard
A clean multi-timeframe bias dashboard built around the 9 and 13 EMA. Tracks 9/13 EMA direction across three user-defined timeframes simultaneously and shows whether they're aligned at a glance — without making you flip charts.
What it does
Reads the 9 EMA (blue) and 13 EMA (grey) on three independently selectable timeframes (defaults: 1H / 15m / 5m) and prints the result as a compact dashboard on your chart. Each timeframe is color-coded — green when 9 EMA is above 13 EMA (bullish), red when below (bearish). A single alignment indicator at the top of the table reads "HTF/LTF Aligned" with a light blue dot when all three timeframes agree, grey when they don't.
The dashboard works on any chart timeframe. The three TFs in the table are pulled independently of what you're viewing, so you can sit on a 1m execution chart and still read 1H bias.
How to use it
1. Trend continuation — the cleanest setup
When all three TFs are aligned (blue dot lit), you're in a confirmed trending regime where higher and lower timeframes agree. This is the highest-probability environment to take continuation trades — pullbacks to value, breakouts, retests of broken structure. Trend is your friend, until the end. Trade with the alignment, not against it.
2. Possible reversal — read the flip cascade
The order in which timeframes change is the early-warning system. Reversals almost always start small and work outward:
LTF flips first → first crack, often just noise on its own
MTF flips → trend in your execution window has rolled
HTF flips → regime change confirmed
If you're holding a position in a fully-aligned market and the LTF flips against you, that's your cue to tighten stops, scale out, or stop adding. If two TFs have flipped and only the HTF holds, you're in the danger zone — the trend is dying. A full new-direction alignment (all three flip and re-agree) is the cleanest signal that the reversal is real, not a wick.
3. Top-down bias filter
Set TF1 to your bias timeframe, TF2 to your structure timeframe, TF3 to your execution timeframe. Only take longs when all three show BULL. Only take shorts when all three show BEAR. When the alignment dot is grey, the market is in transition — stand down or wait for it to settle.
4. Confluence trigger
Watch for the dot flipping from grey to light blue. That moment marks all three TFs agreeing for the first time and frequently coincides with momentum kicks and continuation legs. Pair it with your own entry trigger — structure break, pullback to a key level, breakout retest, or whatever you already use.
5. Don't fight the tide check
If your HTF row is BEAR and you're tempted to long an LTF setup, the dashboard sitting grey is the visual reminder you're trading against the higher tide. Reduce size, skip the trade, or wait for alignment to come to you.
Settings
Three timeframes, fully editable (HTF / MTF / LTF)
Table position: any of four corners or middle sides
Table size: Tiny / Small / Normal / Large
Every color editable — cell backgrounds, text colors, frame, borders, alignment indicator
Optional plot of the 9/13 EMA on the current chart (off by default; 9 = blue, 13 = grey)
"Use confirmed values only" toggle for non-repainting bias (locks each TF until that bar closes)
Three alerts: bullish alignment fired, bearish alignment fired, alignment lost
Notes
Default mode shows live developing bias — values can update intra-bar until each TF's bar closes. Flip on "Use confirmed values only" if you prefer locked, non-repainting values. For best data fidelity, keep your chart timeframe equal to or lower than the lowest TF in your dashboard. Works on any market — futures, FX, equities, crypto.
This is a bias and confluence tool. It won't tell you exactly where to enter or exit on its own — it shows you when the trend stack agrees, when it doesn't, and when it's starting to come apart Gösterge

Strateji

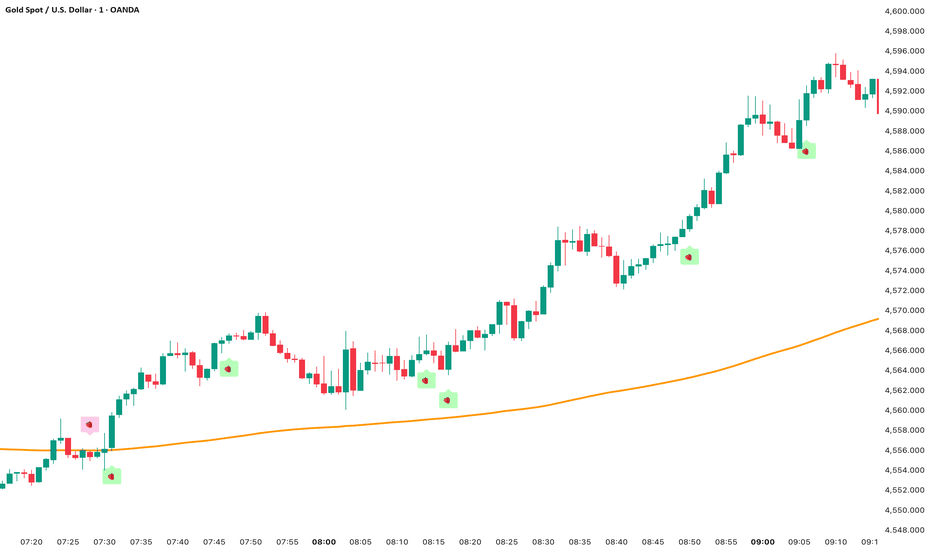
ADX/ MACD/ 200 EMA Strawberry Signals 🍓 Strawberry Signals 🍓
The Strawberry Signals indicator is a trend-following trading tool designed to help traders identify high-probability market entries by combining three core components:
trend direction (EMA 200), momentum (MACD), and trend strength (ADX) .
Signals are only displayed on confirmed candles to ensure stability and avoid repainting behavior.
📌 Indicator Concept
This indicator focuses on trading in the direction of the dominant trend. Instead of generating frequent signals, it filters out low-quality market conditions and only highlights setups where trend, momentum, and strength are aligned.
The goal is to reduce noise and help traders focus on clearer market structures rather than overtrading in sideways conditions.
📊 Core Components
1. EMA 200 – Trend Filter
The EMA 200 is used as the primary trend direction filter.
- Price above EMA 200 → bullish market structure
- Price below EMA 200 → bearish market structure
This ensures that signals are always aligned with the higher timeframe bias of the market.
2. MACD – Momentum Confirmation
The MACD crossover is used to confirm momentum shifts in the direction of the trend:
- Bullish signal: MACD line crosses above signal line
- Bearish signal: MACD line crosses below signal line
This helps identify moments where momentum supports the trend direction.
3. ADX – Trend Strength Filter
The ADX is used to measure whether the market is strong enough for trend trading.
Only when ADX is above the selected threshold (default: 20) will signals be allowed.
- Low ADX → weak or sideways market (no signals)
- High ADX → strong trend conditions (valid signals)
🟢 Buy Signal Conditions
Price is above the EMA 200
MACD line crosses above the signal line
ADX is above the defined threshold (trend strength confirmed)
Signal is confirmed on candle close (no intrabar signals)
🔴 Sell Signal Conditions
Price is below the EMA 200
MACD line crosses below the signal line
ADX is above the defined threshold (trend strength confirmed)
Signal is confirmed on candle close (no intrabar signals)
⚙️ Settings Overview
EMA Length: Defines the trend filter (default: 200)
MACD Settings: Controls momentum sensitivity (fast, slow, signal)
ADX Length: Smoothness of trend strength calculation
ADX Threshold: Minimum trend strength required for signals
📉 Market Conditions
This indicator performs best in trending environments where price moves directionally with momentum.
During sideways or low-volatility conditions, fewer signals will appear by design, as weak trends are filtered out.
👤 My Personal Use
This indicator is intentionally designed to produce fewer signals. Entries are only generated at the exact moment of a MACD crossover when all required conditions are aligned. I use it for XAUUSD on the 1M chart but I'm confident for it to work on different instruments.
In my personal trading, I also monitor situations where the ADX rises above the threshold after the MACD crossover. If momentum remains strong and the overall trend structure (EMA direction) is still valid, these scenarios can still offer interesting trade opportunities even if no signal was printed.
For better decision-making, I recommend displaying the MACD and ADX directly on the chart alongside this indicator. This helps to visually confirm momentum development for trading and trend strength beyond the signal itself.
⚠️ Important Notes
This indicator is designed for educational and analytical purposes.
It does not guarantee profitable trades.
Always combine signals with proper risk management and additional confirmation tools and market structure if needed.
🍓 Summary
Strawberry Signals provides a clean and structured approach to trend trading by combining multiple technical indicators into a single signal system.
It is built to reduce noise, filter weak setups, and highlight only high-quality trend-aligned opportunities directly on the chart.
Gösterge
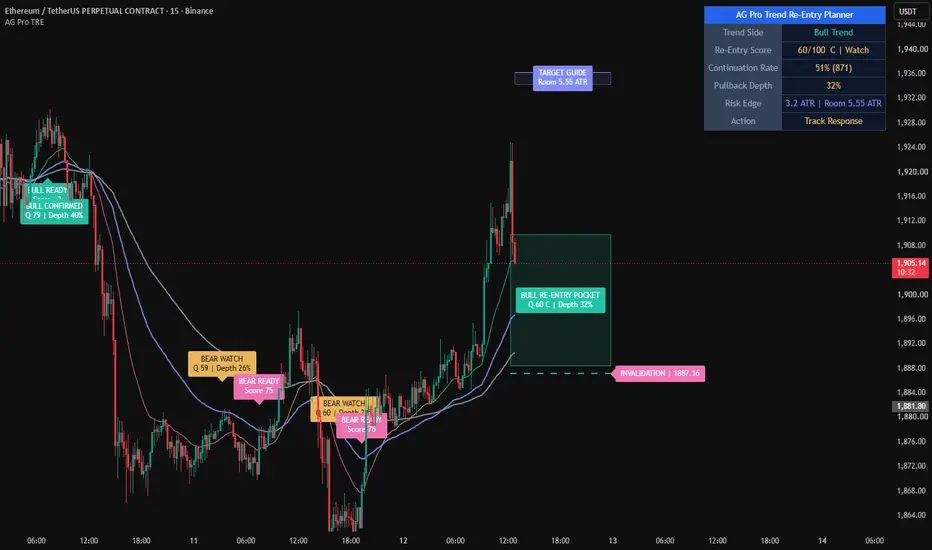
Trend Re-Entry Planner [AGPro Series]Trend Re-Entry Planner
🧠 Core Idea
Is an active trend pullback creating a clean re-entry planning context, or is the reset becoming too risky?
📌 Overview / What it does
Trend Re-Entry Planner is a chart-first trend continuation planning tool designed to evaluate pullbacks inside an active trend structure. The default profile is tuned for 1H charts, where re-entry pockets, trigger candles, invalidation edges, and target-room context usually remain more readable.
The script builds a re-entry pocket from the current impulse range, scores the quality of the pullback, maps a trend defense line, shows an invalidation edge, and estimates target-room context. The goal is to help users judge whether a pullback is becoming organized enough for review or whether the trend context should be rebuilt.
It does not predict price, automate entries, or turn every pullback into a signal. It is a rule-based planning framework for evaluating trend re-entry structure.
🎯 Purpose & Design Philosophy
This script was built for traders who already track trend continuation but want a cleaner way to decide whether a pullback is worth attention.
Many trend tools show direction. Many pullback tools mark a reaction. This script focuses on the planning layer between those two ideas: trend side, pullback depth, reset quality, trigger behavior, target room, risk edge, and next action.
The design supports a disciplined workflow: evaluate context first, then decide whether the setup is ready, confirmed, invalidated, or still waiting.
⚡ Why This Script Is Different
Most tools focus on trend direction, moving average crosses, or broad pullback labels.
This script does NOT clone SuperTrend pullback grading, generic trend continuation signals, or low-volume pullback zones.
Instead, it uses an EMA trend stack and impulse-based re-entry pocket to build a planning view around the current pullback. The output is not just a marker. It is a decision panel with a 0-100 re-entry score, pullback depth, risk edge, target-room context, and next-action state.
⚙️ Methodology
1. Context Detection
The script identifies active bullish or bearish trend structure using an EMA stack and directional slope.
2. Reference Mapping
It maps the current impulse range and builds a concept-native re-entry pocket from that range.
3. Reaction Evaluation
The engine scores trend slope, pullback depth, reset quality near the mid EMA, trigger candle behavior, and target-room availability.
4. Visual Output
The script displays the re-entry pocket, invalidation edge, target-room guide, event labels, sparse context labels, and a premium AG Pro planning panel.
🗺️ How to Read the Chart
Zones = the re-entry pocket and target-room area used for planning context.
Labels = READY, CONFIRMED, INVALIDATED, FOLLOW-THROUGH, and sparse context states.
Colors = teal for bullish continuation context, pink for bearish or invalidation context, yellow for watch/review states, and indigo for target-room or follow-through emphasis.
Panel = the compact decision dashboard showing trend side, re-entry score, pullback depth, risk edge, and action.
🚦 Signals & States
• WATCH → the pullback is developing but still needs confirmation or cleaner structure.
• READY → the re-entry context has enough quality for closer review.
• CONFIRMED → a qualifying trigger candle appears after the pullback context improves.
• FOLLOW-THROUGH → the confirmed context produces a stronger continuation marker.
• INVALIDATED → price crosses the active invalidation edge and the plan should be rebuilt.
🔔 Alerts Logic
Alerts trigger when the script detects READY, CONFIRMED, INVALIDATED, or FOLLOW-THROUGH states.
Each alert is an attention marker tied to the rule-based state engine. Alerts are not trade instructions and do not guarantee that continuation will occur.
🧩 Confluence Logic
The context becomes stronger when trend slope, pullback depth, mid-EMA reset quality, trigger candle behavior, and target-room availability align.
The script intentionally requires multiple conditions instead of labeling every trend pullback as meaningful.
📊 When to Use
• 1H charts with active directional structure
• Directional markets with clear trend structure
• Pullbacks after a visible impulse move
• Continuation review workflows
• Trend-following plans where risk edge and target room matter
⚠️ When NOT to Use
• Low-liquidity symbols with unreliable price movement
• Extremely choppy markets with frequent trend-stack flips
• News-driven volatility where pullback structure changes too quickly
• Markets where the active impulse range is stale or unclear
🎛️ Key Inputs
• Sensitivity → adjusts how selective the re-entry score model is.
• Planning Profile → keeps the default behavior tuned for hourly re-entry planning or allows manual/higher-timeframe adjustment.
• Impulse Lookback → controls the range used to build the re-entry pocket.
• Re-Entry Depth settings → define the shallow, ideal, and deep areas of the pocket.
• Thresholds → control WATCH, READY, and CONFIRMED state requirements.
• Visual settings → control zones, EMA stack, labels, panel theme, panel location, and font sizes.
🖥️ Interface & Visual Design
The interface is built around a clean AG Pro panel and chart-first planning visuals.
The re-entry pocket and target-room guide are intentionally restrained so price remains readable. Labels are limited and spaced to keep the chart informative without becoming crowded.
The first panel row uses the standard AGPro merged blue header format.
🧪 Practical Usage Workflow
1. Read the panel to identify trend side and current action.
2. Check whether price is interacting with the re-entry pocket.
3. Evaluate the score, pullback depth, and risk edge.
4. Wait for READY or CONFIRMED state before treating the context as review-worthy.
5. Rebuild the plan if the invalidation edge is crossed.
🔍 Interpretation Guidelines
Think in terms of planning quality, not certainty.
A higher score means the current pullback has more constructive re-entry characteristics according to the script's rule set. A lower score means the pullback is less organized, has poor target room, lacks a clear trigger, or has moved too close to invalidation.
Use the script as a structure-reading tool within broader market context.
🚫 What This Script Is NOT
• Not a prediction engine
• Not financial advice
• Not an auto-trading system
• Not guaranteed signals
• Not a SuperTrend pullback clone
• Not a generic support/resistance zone map
⚠️ Limitations & Transparency
The script is rule-based and depends on visible chart data.
Timeframe differences, volatility shifts, low liquidity, and sudden news events can change how re-entry structure appears.
The score reflects the internal model only. It does not know future order flow, future liquidity, or future market intent.
🧠 Market Context Notes
Trend re-entry quality is usually clearer when a market has directional structure, a readable impulse, and enough room before nearby obstacles.
When a trend is mature, overly extended, or choppy, the same pullback behavior may carry less useful information.
🧾 Use Case Examples
When price pulls into the re-entry pocket during a bullish EMA stack and then prints a constructive trigger candle, the script may shift from WATCH to READY or CONFIRMED.
When price crosses the invalidation edge, the script marks the context as INVALIDATED so the user can rebuild the plan instead of forcing the old structure.
🧱 System Philosophy
AGPro planning tools are designed to turn chart structure into a clearer decision workflow.
This script follows that philosophy by focusing on context, readiness, risk edge, and next action rather than simple signal output.
🔐 Non-Promise Statement
No script can guarantee continuation, reversal, profit, or accuracy.
This tool provides structured context only. Users should combine it with their own analysis, timeframe review, and risk management process.
📉 Risk Disclosure
Trading involves risk.
Users are responsible for their own decisions, position sizing, trade management, and risk control.
This script does not provide financial advice and does not guarantee trading outcomes.
📚 Educational Note
Trend Re-Entry Planner is intended to help users study how pullbacks behave inside active trend structure and how planning context can be organized more clearly.
Gösterge

Trend Pullback Risk Planner [AGPro Series]Trend Pullback Risk Planner
🧠 Core Idea
Is the current pullback normal trend digestion, or is it becoming a risk shift that deserves review?
📌 Overview / What it does
Trend Pullback Risk Planner is a chart-first trend risk planner built to evaluate active pullbacks inside an established trend.
The script maps a Pullback Risk Pocket, trend defense line, invalidation reference, target-room guide, compact state labels, alert conditions, and a clean AGPro panel. It converts trend slope, pullback depth, volume dry-up, defense response, and target obstruction into a 0-100 Continuation Score.
It does not predict price movement, automate execution, or print buy/sell commands. Its purpose is to help traders judge whether a pullback is still controlled enough to review, or whether the trend context is starting to lose quality.
🎯 Purpose & Design Philosophy
This script was built for traders who already see a trend but need a cleaner way to evaluate pullback risk.
Many pullback tools focus on marking every retracement as a possible continuation setup. This planner focuses on the decision question behind the setup: is the pullback still being defended, is it getting too deep, does target room remain clean, and what should be reviewed next?
The design supports a risk-first mindset. It helps users read pullback behavior without turning the chart into a crowded signal board or a generic support/resistance map.
⚡ Why This Script Is Different
Most tools focus on identifying pullbacks or continuation signals.
This script does NOT try to clone a low-volume pullback zone, a generic trend continuation score, a Supertrend pullback model, or a broad support/resistance system.
Instead, it treats the pullback as a live risk review. The unique output is the Pullback Risk Pocket: a controlled planning area where depth, defense, volume behavior, target room, and invalidation context are evaluated together before the panel prints the next action state.
⚙️ Methodology
1. Context Detection
The planner identifies trend side using EMA stack structure and normalized trend slope. Users can keep the side automatic or restrict the tool to bullish-only or bearish-only review.
2. Reference Mapping
The script builds a Pullback Risk Pocket between the base trend reference and the defense line. It also maps an invalidation reference and a target-room guide.
3. Reaction Evaluation
The model evaluates pullback depth versus ATR, trend slope, volume dry-up, wick/close response inside the pocket, and distance to the nearest target-side obstruction.
4. Visual Output
The result is shown through a centered risk pocket label, defense/risk/target guide lines, compact event labels, alerts, and an AGPro decision panel.
🗺️ How to Read the Chart
Zones = the Pullback Risk Pocket where an active pullback is reviewed for normal digestion versus risk shift.
Labels = continuation-ready, risk-watch, weak-pullback, risk-shift, follow-through, and sparse pocket-context markers.
Colors = bullish trend context uses AGPro teal, bearish trend context uses AGPro pink, warning states use yellow, and invalidation/risk-shift states use red.
Panel = the panel summarizes Trend Side, Pullback Depth, Risk Pocket status, Continuation Score, target-room context, and Action.
🚦 Signals & States
• TREND ACTIVE → trend context exists, but price has not reached the pullback risk pocket.
• POCKET NEAR → price is approaching the pullback risk pocket and deserves attention.
• HEALTHY PULLBACK → pullback is being reviewed with constructive but not yet high-grade conditions.
• RISK WATCH → pullback depth or response quality is becoming less clean.
• CONTINUATION READY → pullback risk pocket is defending with sufficient score and target-room context for review.
• FOLLOW-THROUGH → price is responding after a defended pullback pocket.
• WEAK PULLBACK → pullback touched the pocket, but score quality is weak.
• RISK SHIFT → price crossed the invalidation reference and the context should be rebuilt.
• NO TREND → trend structure is not aligned enough for the planner.
🔔 Alerts Logic
Alerts trigger when the planner detects a Continuation Ready state, a Risk Watch state, a Risk Shift event, or Follow-Through after a defended pocket.
These alerts are attention markers. They are not trade instructions, not execution commands, and not guaranteed outcomes.
🧩 Confluence Logic
The strongest context appears when trend slope, controlled pullback depth, quiet retracement volume, a constructive defense response, and clean target room align at the same time.
When one or more of these elements weakens, the planner shifts toward POCKET NEAR, RISK WATCH, WEAK PULLBACK, or RISK SHIFT instead of forcing a continuation interpretation.
📊 When to Use
• Trending markets with visible pullback structure
• Continuation review after a clean directional leg
• Situations where pullback depth and defense quality matter
• Trade-planning workflows that need risk, invalidation, and target-room context
⚠️ When NOT to Use
• Flat, low-directional range conditions
• Low-liquidity charts with unreliable wick and volume behavior
• Extreme news volatility where pullbacks can invalidate quickly
• Situations where the user expects an automatic buy/sell system
🎛️ Key Inputs
• Planner Side → controls Auto, Bullish Only, or Bearish Only evaluation.
• Sensitivity → changes how strict the risk pocket and scoring model behave.
• EMA Lengths → define fast trend pressure, base pullback reference, and defense line.
• Pullback Depth Lookback → controls how the script measures retracement depth from the latest trend-side extreme.
• Risk Pocket Width ATR → controls the thickness of the pullback review area.
• Invalidation Buffer ATR → controls the distance of the invalidation reference beyond the defense line.
• Clean Target Room ATR → defines preferred room before target-side obstruction.
• Visual settings → control pocket visibility, guide lines, labels, panel location, theme, and font sizes.
🖥️ Interface & Visual Design
The interface is built around one main object: the Pullback Risk Pocket.
The centered pocket label keeps the active state visible without forcing users to read many separate markers. The guide lines show defense, invalidation, and target-room context. The AGPro panel keeps the decision state compact and readable.
Labels use controlled spacing, cooldown, and maximum-count settings so the chart remains active without becoming crowded.
🧪 Practical Usage Workflow
1. Read the panel Action state.
2. Check Trend Side and Pullback Depth.
3. Review whether price is near, inside, defending, or breaching the Pullback Risk Pocket.
4. Compare the Continuation Score with target-room context.
5. Treat alerts as attention markers and confirm broader market context independently.
🔍 Interpretation Guidelines
A higher Continuation Score means the active pullback is showing stronger alignment between trend slope, controlled depth, volume dry-up, defense response, and remaining target room.
CONTINUATION READY does not mean a trade should be opened. It means the pullback remains structurally constructive under the script's rule set.
RISK WATCH and RISK SHIFT are caution states. They help users slow down when pullback depth, defense response, or invalidation context becomes weaker.
🚫 What This Script Is NOT
This script is not a prediction engine.
It is not financial advice.
It is not an auto-trading system.
It does not provide guaranteed signals.
It is not a generic support/resistance zone map.
It is not a clone of Low Volume Pullback Zones, Trend Continuation Quality, or Supertrend Pullback Quality.
⚠️ Limitations & Transparency
Timeframe differences can change trend slope, pullback depth, and target-room readings.
Volume behavior can vary across markets and data feeds.
Fast volatility expansion can move price through the pocket before a clean review state appears.
The script is rule-based and should be interpreted as an analytical planning layer, not as certainty.
🧠 Market Context Notes
Pullbacks are not automatically healthy because they occur inside a trend. A clean trend pullback usually needs controlled depth, reduced against-trend pressure, visible defense response, and enough room before the next obstruction.
This planner is designed to keep that review process structured.
🧾 Use Case Examples
When price pulls into the risk pocket with controlled depth, softer relative volume, and a strong close back toward the trend side, the planner may classify the state as CONTINUATION READY.
When price enters the pocket but response quality is weak or depth becomes excessive, the planner may show RISK WATCH.
When price crosses the invalidation reference beyond the defense line, the planner may show RISK SHIFT.
🧱 System Philosophy
Trend Pullback Risk Planner follows the AGPro Series decision-engine approach:
Trend first.
Pullback risk second.
Defense and target room before action.
Attention markers instead of promises.
🔐 Non-Promise Statement
No script can guarantee that a pullback will continue.
No state should be interpreted as certainty.
All outputs should be reviewed within broader market context.
📉 Risk Disclosure
Trading involves risk.
Users are responsible for their own decisions, risk management, and trade execution.
This script is for educational and analytical purposes only and does not provide financial advice.
📚 Educational Note
The script is designed to help users think in structured pullback-risk terms: trend, depth, defense, target room, invalidation, and review.
Gösterge

Gösterge

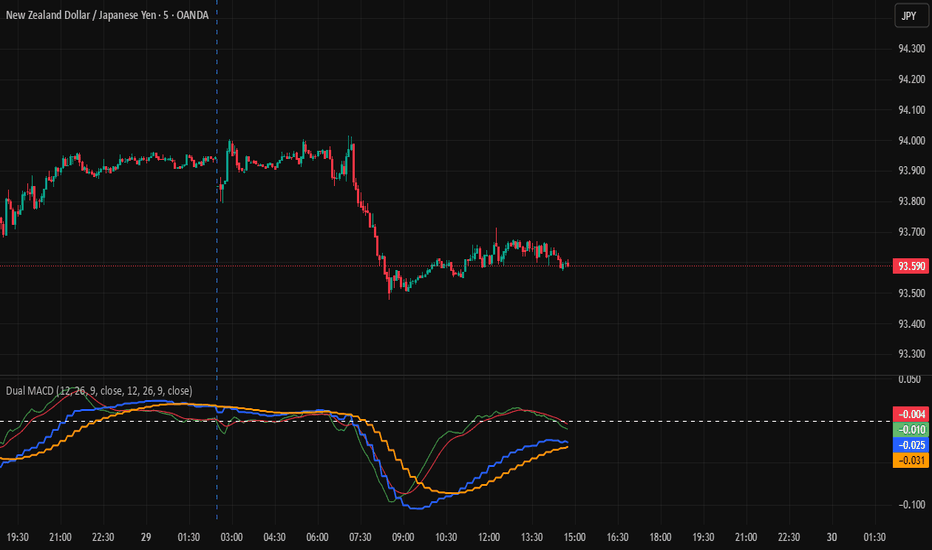
NEIL'S Dual MACD (5min & 15min)⏱️ Multi-Timeframe MACD — Smarter, Faster Analysis
This indicator is built to simplify one of the most common challenges traders face: constantly switching between timeframes to confirm MACD signals.
Instead of flipping between the 5-minute and 15-minute charts, this tool brings both together into a single view—allowing you to analyze momentum, trend direction, and signal alignment without interrupting your workflow.
🚀 Why This Indicator?
Many traders rely on multi-timeframe confirmation to improve accuracy, but the process of switching charts can be slow, distracting, and inefficient.
This indicator solves that problem by integrating MACD data from both 5-minute and 15-minute timeframes directly onto your current chart, helping you stay focused and react faster to market movements.
🔑 Key Features
⚡ Dual Timeframe MACD in One View
Monitor both 5m and 15m MACD simultaneously without changing charts
📉 Stronger Signal Confirmation
Quickly identify when both timeframes align for higher-probability setups
⏳ Time Efficiency
Eliminates repetitive timeframe switching and speeds up analysis
📊 Improved Market Clarity
Understand momentum shifts across timeframes at a glance
🧠 Better Decision-Making
Helps traders stay disciplined by relying on structured, multi-timeframe confirmation
🎯 How It Helps You
By combining multiple timeframe insights into one chart, this indicator allows you to:
Spot early momentum shifts on the lower timeframe
Confirm trend direction with the higher timeframe
Avoid weak or conflicting signals
Stay consistent in your trading process
👤 Who Is This For?
✔ Scalpers and intraday traders
✔ Traders using MACD for entries and confirmations
✔ Anyone practicing multi-timeframe analysis
✔ Traders who want a faster and cleaner workflow
⚠️ Important Note
This indicator is designed as a decision-support tool, not a standalone trading system. Always combine it with proper risk management and your overall trading strategy. Gösterge
NEIL'S FX Sessions + EMA + Prev Day HLThis indicator is designed to provide a complete market overview by combining session tracking, dynamic trend analysis, and key price levels into a single, clean framework.
It highlights the major trading sessions—Sydney, Tokyo, London, and New York—allowing traders to understand when volatility and liquidity are most active. This helps in aligning trades with the most relevant market hours.
The indicator also includes six customizable EMA slots, enabling users to analyze short-term and long-term trends simultaneously. This multi-layered EMA structure helps identify trend direction, pullbacks, and potential continuation zones.
In addition, it plots the previous day’s high and low, giving traders important reference levels for liquidity, breakouts, and reversals.
By combining time-based context, trend structure, and key levels, this indicator helps traders make more informed and structured decisions while keeping the chart organized and efficient. Gösterge

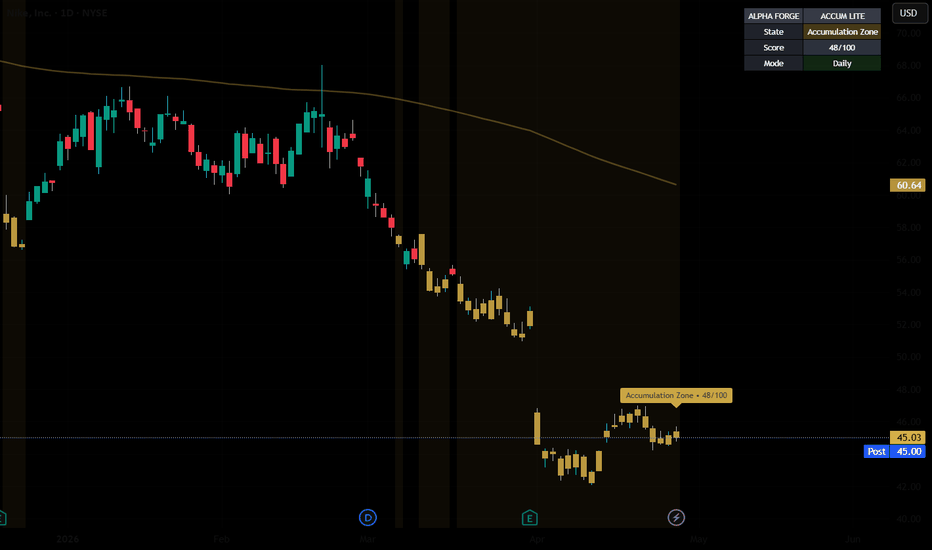
Alpha Forge Accumulation LiteAlpha Forge Accumulation Lite is an open-source overlay designed to visualize possible long-term accumulation conditions on higher-timeframe charts.
The script is not built for intraday trading, exact bottom detection, or short-term entries. Instead, it provides a visual framework for studying when an asset is trading below its longer-term trend context while additional correction and stabilization conditions are present.
Core Idea
The script asks a simple chart-analysis question:
Is this asset showing conditions that may be associated with a long-term accumulation phase?
To answer that, the script combines several rule-based inputs, including:
Long-term EMA distance
Drawdown depth
Momentum exhaustion
Volatility behavior
Early stabilization conditions
When enough of these conditions are present, the script marks an Accumulation Zone.
What It Shows
Alpha Forge Accumulation Lite can display:
Potential accumulation zones
Gold candle tinting during active zones
A long-term trend EMA
An accumulation score
Simple visual chart context for Daily and Weekly charts
How To Use
This script is designed for higher-timeframe chart review.
It may be useful for users who want to study:
Assets after large pullbacks
Long-term trend discount conditions
Possible cycle-style accumulation areas
Watchlist candidates for further research
Daily and Weekly chart structure
An Accumulation Zone does not mean price has bottomed.
It does not mean price cannot continue lower.
It only means the script’s programmed conditions for a possible accumulation environment are present on the selected chart and timeframe.
Best Timeframes
The script is primarily intended for:
Daily charts
Weekly charts
Lower timeframes may produce less meaningful results because the logic is based on broader market structure and longer-term conditions.
Possible Markets
The script can be applied to different asset classes, including:
Stocks
Crypto
Metals
Macro-related assets
Indices
Users should test and interpret the script differently depending on the market being reviewed.
Lite Version Notes
This is a simplified public version of a broader accumulation framework.
It is intended to provide clean visual context without adding excessive chart complexity.
Important Notes
This script is open source.
It is for educational chart analysis and research.
It does not provide financial advice.
It does not identify guaranteed buy zones.
It does not predict exact tops or bottoms.
It does not guarantee future results.
All zones, scores, candle colors, and visual states are based only on the script’s programmed conditions and should be interpreted as informational chart context. Gösterge
Gösterge

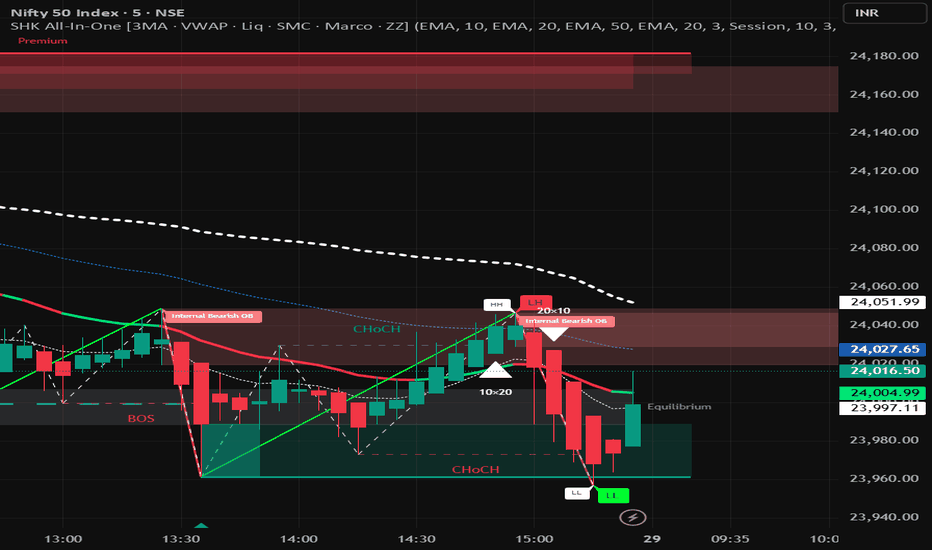
SHK All-In-One | 3MA - VWAP - Liq - SMC - Marco - ZZ╔══════════════════════════════════════════════════════════════════╗
║ SHK All-In-One ║
║ by SHK · Pine Script v6 ║
╚══════════════════════════════════════════════════════════════════╝
━━━━━━━━━━━━━━━━━━━━━━━━━━━━━━━━━━━━━━━━━━━━━━━━━━━━━━━━━━━━━━━━
🏅 CREDITS & ORIGINAL AUTHORS
━━━━━━━━━━━━━━━━━━━━━━━━━━━━━━━━━━━━━━━━━━━━━━━━━━━━━━━━━━━━━━━━
This script is a combined, extended and restructured version of
several outstanding open-source indicators. Full credit belongs
to the original authors listed below. I have only merged,
organised and added connecting logic.
① Smart Money Concepts (SMC)
→ Original: LuxAlgo — "SMC Lite" (open-source, TradingView)
→ Includes: BOS, CHoCH, Order Blocks, FVG, EQH/EQL,
MTF Levels, Premium/Discount Zones, STH/STL
② Liquidity Swings (BSL / SSL)
→ Original: LuxAlgo — "Liquidity Levels" (open-source)
→ Includes: Buy-Side & Sell-Side Liquidity zones,
sweep detection, volume/count filtering
③ Marco Polo Top Detective
→ Original: Marco Polo — community TradingView adaptation
→ Includes: Custom pivot top/bottom detection,
BBands 3-bar reversal confirmation
④ ZigZag Engine (Swing + Internal)
→ Original: Classic TradingView community ZigZag
(multiple open-source contributors)
→ Includes: Swing ZigZag with HH/HL/LH/LL labels,
Internal ZigZag with separate settings
⑤ UT Bot Filter (inside Signal MA)
→ Original: QuantNomad — "UT Bot Alert" (open-source)
→ Used as one of three Signal MA colour filters
⑥ Supertrend Filter (inside Signal MA)
→ Built-in ta.supertrend() — Pine Script standard library
→ Used as one of three Signal MA colour filters
⑦ 3 MA + Signal MA System + VWAP
→ Original work by SHK
→ Includes: 3 independent MAs, a colour-coded Signal MA
combining HA + Supertrend + UT Bot filters,
and an anchored VWAP
Combined, unified and extended by SHK.
━━━━━━━━━━━━━━━━━━━━━━━━━━━━━━━━━━━━━━━━━━━━━━━━━━━━━━━━━━━━━━━━
📌 WHAT IS THIS INDICATOR?
━━━━━━━━━━━━━━━━━━━━━━━━━━━━━━━━━━━━━━━━━━━━━━━━━━━━━━━━━━━━━━━━
SHK All-In-One brings together five of the most powerful
open-source market analysis tools into a single, clean,
modular indicator. Instead of adding 5 separate scripts to
your chart and dealing with clutter and conflicts, everything
lives in one place.
Each of the five modules can be INDEPENDENTLY TURNED ON OR OFF
using the Master Toggles at the top of the settings. Use only
what you need — run all five at once or pick just one.
Designed primarily for Indian markets (Nifty, BankNifty,
Sensex, MCX commodities) but works on any symbol and timeframe.
━━━━━━━━━━━━━━━━━━━━━━━━━━━━━━━━━━━━━━━━━━━━━━━━━━━━━━━━━━━━━━━━
① 3 MA + VWAP MODULE
━━━━━━━━━━━━━━━━━━━━━━━━━━━━━━━━━━━━━━━━━━━━━━━━━━━━━━━━━━━━━━━━
Three fully independent Moving Averages, each with its own
type, length and colour setting.
SUPPORTED MA TYPES:
• EMA — Exponential Moving Average
• SMA — Simple Moving Average
• WMA — Weighted Moving Average
• HMA — Hull Moving Average (smooth, low lag)
• TEMA — Triple EMA (very low lag)
• DEMA — Double EMA (reduced lag)
• ZLEMA — Zero-Lag EMA (lag corrected using looback)
All three MAs default to EMA 9 / 21 / 50 — the classic
short, medium and long-term trend framework.
SIGNAL MA:
A fourth moving average acts as a dynamic trend signal line.
It changes colour based on THREE combined market filters:
Filter 1 — Heiken Ashi:
Reads the Heiken Ashi close vs open to determine if price
action is in a bullish or bearish HA candle. Smooths out
noise from regular candles.
Filter 2 — Supertrend:
Uses ta.supertrend() with configurable ATR length and
factor. Adds a trend-following layer to the signal.
Filter 3 — UT Bot:
QuantNomad's UT Bot trailing stop logic using ATR.
Identifies momentum direction based on a key value
multiplier and ATR period.
Scoring system:
Each filter votes +1 (bullish) or -1 (bearish).
Total score > 0 → Signal MA turns GREEN (bullish)
Total score < 0 → Signal MA turns RED (bearish)
Total score = 0 → Signal MA turns GREY (neutral)
You can enable or disable any of the three filters
individually. Running all three gives the most robust signal.
MA CROSSOVER LABELS:
Whenever MA1 crosses MA2, or MA2 crosses MA3, a small
triangle label appears on the chart automatically.
Upward triangle = bullish cross (below bar)
Downward triangle = bearish cross (above bar)
The label shows the two MA lengths that crossed.
VWAP (Volume Weighted Average Price):
A fully anchored VWAP is included with anchor options:
Session / Week / Month / Quarter / Year
VWAP is calculated from scratch using cumulative
TPV (typical price × volume) for accuracy.
Displayed as a bold coloured line (default yellow).
━━━━━━━━━━━━━━━━━━━━━━━━━━━━━━━━━━━━━━━━━━━━━━━━━━━━━━━━━━━━━━━━
② LIQUIDITY SWINGS MODULE
━━━━━━━━━━━━━━━━━━━━━━━━━━━━━━━━━━━━━━━━━━━━━━━━━━━━━━━━━━━━━━━━
Identifies areas where resting liquidity (stop losses and
pending orders) is likely clustered above swing highs and
below swing lows. Based on LuxAlgo's Liquidity Levels logic.
HOW IT WORKS:
Uses ta.pivothigh() and ta.pivotlow() with a configurable
lookback length to detect swing pivot points.
For each detected swing high → marks a BSL zone
(Buy-Side Liquidity — stop losses of shorts clustered above)
For each detected swing low → marks a SSL zone
(Sell-Side Liquidity — stop losses of longs clustered below)
A horizontal line is drawn at the pivot level and extends
to the right until price sweeps through it.
When price closes beyond the level:
• Line turns DASHED
• Label updates to "✓ BSL Swept" or "✓ SSL Swept"
• Zone box fades
SWING AREA MODES:
Wick Extremity — Zone top/bottom uses the wick extreme
vs the candle body edge (tighter zone)
Full Range — Zone spans full candle high to low
FILTERING:
Filter by Count — minimum number of bars that touched
the zone (liquidity density)
Filter by Volume — minimum cumulative volume inside
the zone (institutional interest)
LABELS:
Each level shows "▲ Buy Side Liquidity" or
"▼ Sell Side Liquidity" with the cumulative volume.
Label size and BSL/SSL label size are configurable.
━━━━━━━━━━━━━━━━━━━━━━━━━━━━━━━━━━━━━━━━━━━━━━━━━━━━━━━━━━━━━━━━
③ SMART MONEY CONCEPTS (SMC) MODULE
━━━━━━━━━━━━━━━━━━━━━━━━━━━━━━━━━━━━━━━━━━━━━━━━━━━━━━━━━━━━━━━━
The most comprehensive module. Based on LuxAlgo's SMC Lite
open-source indicator, adapted and integrated for this script.
─── STRUCTURE ───────────────────────────────────────────────
SWING STRUCTURE:
Identifies the major market structure by tracking swing
highs and swing lows over a configurable lookback length.
BOS (Break of Structure):
Price closes beyond the last swing high/low in the
SAME direction as the current trend. Confirms trend
continuation.
CHoCH (Change of Character):
Price closes beyond the last swing high/low in the
OPPOSITE direction of the current trend. First signal
of a potential trend reversal.
A line is drawn from the broken level to the current bar,
labelled BOS or CHoCH. Bullish = green, Bearish = red.
INTERNAL STRUCTURE:
Same BOS/CHoCH logic applied to a shorter lookback (5 bars)
to catch intrabar / internal structure shifts.
Internal structure lines are dashed to distinguish from
swing structure.
Confluence Filter option: when enabled, only shows
internal structure that aligns with candle body direction
(filters out weak signals).
SWING POINTS:
Optional labels showing HH (Higher High), HL (Higher Low),
LH (Lower High), LL (Lower Low) at each pivot.
STRONG / WEAK HIGH-LOW LABELS:
STH (Short-Term High) and STL (Short-Term Low) mark the
most recent swing extreme. When both occur at the same
bar, shows a combined STH/STL label.
─── ORDER BLOCKS ────────────────────────────────────────────
Order Blocks are the last up/down candle before a BOS or
CHoCH. They represent areas where institutional orders
were placed and price is likely to react on a return visit.
INTERNAL ORDER BLOCKS:
Derived from internal structure BOS/CHoCH events.
Show the 5 most recent (configurable up to 20).
SWING ORDER BLOCKS:
Derived from swing structure BOS/CHoCH events.
Disabled by default (toggle on if needed).
OB FILTER:
ATR Filter — removes OBs from high-volatility candles
(candle range ≥ 2× ATR is excluded as noise)
Cumulative Mean Range Filter — uses average range
instead of ATR as the volatility measure
OB MITIGATION:
Close — OB is mitigated when price CLOSES inside it
High/Low — OB is mitigated when price WICKS into it
Each OB is drawn as a coloured box that extends to the
right until price mitigates it.
─── FAIR VALUE GAPS (FVG) ───────────────────────────────────
A Fair Value Gap is a 3-candle imbalance where:
Bullish FVG: candle 3 low > candle 1 high (gap up)
Bearish FVG: candle 3 high < candle 1 low (gap down)
FVGs are drawn as semi-transparent boxes.
Auto Threshold option filters out micro-gaps below
0.5× ATR (reduces noise).
Optional multi-timeframe FVG via timeframe input —
you can display FVGs from a higher timeframe on your
current chart.
─── EQUAL HIGHS / EQUAL LOWS (EQH/EQL) ─────────────────────
Detects when two consecutive swing highs or lows are within
a configurable ATR threshold of each other, indicating
clustered liquidity at that level.
Drawn as a dotted line between the two equal levels,
labelled EQH or EQL.
─── MULTI-TIMEFRAME HIGHS & LOWS ────────────────────────────
Draws the previous period's High and Low for:
• Daily (previous day high/low)
• Weekly (previous week high/low)
• Monthly (previous month high/low)
Each level has its own style (solid/dashed/dotted) and
colour. Useful as key support/resistance reference levels.
─── PREMIUM / DISCOUNT / EQUILIBRIUM ZONES ──────────────────
Based on the current swing high and swing low (trailing
extremes), the visible range is divided into three zones:
Premium Zone (top 5%):
Price is trading at a premium. Bearish bias —
institutions tend to SELL in premium.
Equilibrium Zone (middle 5% around 50%):
Price is at fair value. Neutral zone.
Discount Zone (bottom 5%):
Price is at a discount. Bullish bias —
institutions tend to BUY in discount.
Display modes:
Historical — draws ALL historical structure and OBs
Present — draws only the MOST RECENT instance
(cleaner chart for live trading)
Style modes:
Colored — standard green/red/blue colours
Monochrome — single grey tone (for minimal charts)
─── SMC ALERTS ──────────────────────────────────────────────
Full alert conditions available for:
Internal Bullish / Bearish BOS
Internal Bullish / Bearish CHoCH
Swing Bullish / Bearish BOS
Swing Bullish / Bearish CHoCH
Equal Highs / Equal Lows
Bullish / Bearish Fair Value Gap
Internal Bullish / Bearish Order Block (mitigated)
Swing Bullish / Bearish Order Block (mitigated)
━━━━━━━━━━━━━━━━━━━━━━━━━━━━━━━━━━━━━━━━━━━━━━━━━━━━━━━━━━━━━━━━
④ MARCO POLO TOP DETECTIVE MODULE
━━━━━━━━━━━━━━━━━━━━━━━━━━━━━━━━━━━━━━━━━━━━━━━━━━━━━━━━━━━━━━━━
A pivot detection tool that identifies significant swing
tops and bottoms using a custom algorithm — different from
the standard ta.pivothigh() approach.
PIVOT DETECTION:
Uses a rolling highest/lowest scan over a configurable
Depth. A pivot is confirmed only when the price found
deviates from the previous pivot by more than a threshold:
Threshold = ATR(10) / close × 100 × Deviation input
This prevents trivial micro-swings from being plotted and
focuses only on significant structural pivots.
Labels appear DEPTH bars back (offset) so they appear
at the actual pivot bar, not the confirmation bar.
→ "Top Pivot" label (red, above bar)
→ "Bot Pivot" label (blue, below bar)
BOLLINGER BANDS REVERSAL CONFIRMATION:
A second layer — the 3-bar BBands pattern — identifies
short-term exhaustion reversals:
Bear Reversal (bearish):
• 2 bars ago: close > BBands upper AND green candle
• 1 bar ago: close > BBands upper AND red candle
• Current bar: close < 1-bar-ago high
→ "Bear Rev" label (orange, above bar)
Bull Reversal (bullish):
• 2 bars ago: close < BBands lower AND red candle
• 1 bar ago: close < BBands lower AND green candle
• Current bar: close > 1-bar-ago low
→ "Bull Rev" label (lime green, below bar)
This pattern catches short-term mean-reversion setups
at Bollinger Band extremes with candle confirmation.
ALERTS:
Marco Top Detected — pivot top or bear reversal found
Marco Bottom Detected — pivot bottom or bull reversal
━━━━━━━━━━━━━━━━━━━━━━━━━━━━━━━━━━━━━━━━━━━━━━━━━━━━━━━━━━━━━━━━
⑤ ZIGZAG MODULE (SWING + INTERNAL)
━━━━━━━━━━━━━━━━━━━━━━━━━━━━━━━━━━━━━━━━━━━━━━━━━━━━━━━━━━━━━━━━
A dual ZigZag engine with a main Swing ZigZag and a
faster Internal ZigZag — each fully independent.
SWING ZIGZAG:
Depth — minimum bars before a pivot is confirmed
Deviation — minimum % price move required for a new leg
Backstep — minimum bars between two pivots
Each ZigZag leg is drawn as a line connecting consecutive
swing highs and lows. Bull legs (rising) and Bear legs
(falling) use separate configurable colours.
HH / HL / LH / LL LABELS:
Each pivot is automatically classified and labelled:
• HH — Higher High (bullish trend continuation)
• HL — Higher Low (bullish trend continuation)
• LH — Lower High (bearish trend continuation)
• LL — Lower Low (bearish trend continuation)
Label size is configurable (Tiny / Small / Normal).
INTERNAL ZIGZAG:
A faster ZigZag with smaller depth and deviation to
capture internal market structure swings within the
main ZigZag legs. Displayed with a different colour
and style (default dashed) to separate it visually
from the main swing ZigZag.
The internal ZigZag is disabled by default. Turn it on
in the Internal ZigZag settings group.
LINE STYLES (both ZigZags):
⎯⎯⎯ Solid
---- Dashed
···· Dotted
Line width: 1–4
━━━━━━━━━━━━━━━━━━━━━━━━━━━━━━━━━━━━━━━━━━━━━━━━━━━━━━━━━━━━━━━━
⚙️ SETTINGS OVERVIEW
━━━━━━━━━━━━━━━━━━━━━━━━━━━━━━━━━━━━━━━━━━━━━━━━━━━━━━━━━━━━━━━━
◆ Master Toggles
Enable / Disable each of the 5 modules independently.
① MA 1 / MA 2 / MA 3 — Type, Length, Colour
① Signal MA — Type, Length, Width, Bull/Bear/Neutral colours
① Signal MA Filters — HA toggle, Supertrend toggle, UT Bot toggle
① Supertrend — ATR Length, Factor
① UT Bot — Key Value, ATR Period
① VWAP — Show toggle, Anchor, Colour
② Liquidity Swings — Pivot Lookback, Swing Area mode
② Filter — Count or Volume, threshold value
② Style — Swing High colour, Swing Low colour,
area colours, label sizes, BSL/SSL labels
③ Smart Money Concepts — Mode (Historical/Present),
Style (Colored/Monochrome)
③ Internal Structure — Show toggle, Bull/Bear filter, label size,
Confluence Filter
③ Swing Structure — Show toggle, Bull/Bear filter, label size,
Swing Points toggle + length,
Strong/Weak High/Low toggle
③ Order Blocks — Internal OB toggle + size,
Swing OB toggle + size,
OB Filter type, OB Mitigation type,
4 individual OB colours
③ EQH/EQL — Show toggle, Bars Confirmation,
Threshold (ATR multiplier), Label size
③ Fair Value Gaps — Show toggle, Auto Threshold,
Timeframe, Bull/Bear colours, Extend
③ Highs & Lows MTF — Daily / Weekly / Monthly toggles,
style and colour for each
③ Premium & Discount — Show toggle, Premium / Equilibrium /
Discount zone colours
④ Marco Polo — Deviation, Depth, Text colour,
BBands Length, BBands Multiplier
⑤ Main ZigZag — Depth, Deviation, Backstep,
Bull/Bear colours, Width, Style,
HH/HL labels toggle + size
⑤ Internal ZigZag — Same settings as main ZigZag,
independently configured
━━━━━━━━━━━━━━━━━━━━━━━━━━━━━━━━━━━━━━━━━━━━━━━━━━━━━━━━━━━━━━━━
🔔 ALERTS SUMMARY
━━━━━━━━━━━━━━━━━━━━━━━━━━━━━━━━━━━━━━━━━━━━━━━━━━━━━━━━━━━━━━━━
SMC Alerts:
✦ Internal Bullish BOS ✦ Internal Bearish BOS
✦ Internal Bullish CHoCH ✦ Internal Bearish CHoCH
✦ Swing Bullish BOS ✦ Swing Bearish BOS
✦ Swing Bullish CHoCH ✦ Swing Bearish CHoCH
✦ Equal Highs ✦ Equal Lows
✦ Bullish Fair Value Gap ✦ Bearish Fair Value Gap
Marco Polo Alerts:
✦ Marco Top Detected (pivot top or bear reversal)
✦ Marco Bottom Detected (pivot bottom or bull reversal)
━━━━━━━━━━━━━━━━━━━━━━━━━━━━━━━━━━━━━━━━━━━━━━━━━━━━━━━━━━━━━━━━
📝 USAGE TIPS
━━━━━━━━━━━━━━━━━━━━━━━━━━━━━━━━━━━━━━━━━━━━━━━━━━━━━━━━━━━━━━━━
• On lower timeframes (1m–5m), disable Fair Value Gaps
and Swing Order Blocks to reduce visual clutter.
• For Nifty/BankNifty intraday, recommended setup:
Signal MA (EMA 20) with all 3 filters ON +
Liquidity Swings + Internal SMC structure only.
• For positional/swing trading, enable the full SMC
module with Historical mode to see all past structure.
• Use Master Toggles to turn off modules you don't need —
this significantly improves chart performance.
• ZigZag and SMC Swing Structure complement each other:
ZigZag shows the visual wave, SMC labels the reason
(BOS/CHoCH) at each pivot.
• Marco Polo works best on 15m and above for pivot
detection. On 1m it may generate excessive signals.
━━━━━━━━━━━━━━━━━━━━━━━━━━━━━━━━━━━━━━━━━━━━━━━━━━━━━━━━━━━━━━━━
📜 LICENSE
━━━━━━━━━━━━━━━━━━━━━━━━━━━━━━━━━━━━━━━━━━━━━━━━━━━━━━━━━━━━━━━━
CC BY-NC-SA 4.0 — Attribution-NonCommercial-ShareAlike 4.0
creativecommons.org
✅ Free to use for personal and educational purposes
✅ Free to share with proper credit to SHK and original authors
✅ Free to adapt and modify with credit and same license
❌ Commercial use is NOT permitted
❌ Cannot be republished as invite-only or paid script
━━━━━━━━━━━━━━━━━━━━━━━━━━━━━━━━━━━━━━━━━━━━━━━━━━━━━━━━━━━━━━━━
⚠️ DISCLAIMER
━━━━━━━━━━━━━━━━━━━━━━━━━━━━━━━━━━━━━━━━━━━━━━━━━━━━━━━━━━━━━━━━
This indicator is published for EDUCATIONAL and INFORMATIONAL
purposes only. It is NOT financial advice, investment advice,
or a recommendation to buy or sell any financial instrument.
Trading and investing in financial markets — including stocks,
indices, commodities, currencies and derivatives — involves
substantial risk of loss. Past performance of any indicator,
strategy or signal does NOT guarantee future results.
The signals, labels, zones and levels produced by this script
are based purely on mathematical calculations applied to
historical price and volume data. They do not predict the
future with certainty. No indicator can.
YOU are solely responsible for your own trading decisions.
Always do your own research and analysis before entering any
trade. Always use proper risk management — including stop
losses and position sizing — on every trade.
The author (SHK) and the original authors of all combined
modules (LuxAlgo, QuantNomad, Marco Polo, ZigZag community)
accept NO liability for any financial losses incurred from
the use of this script, directly or indirectly.
This script is provided "AS IS" without warranty of any kind,
express or implied. The author makes no guarantee that the
script will function correctly on all symbols, timeframes,
brokers or data feeds.
By using this script, you acknowledge and accept that:
• All trading decisions are made entirely at your own risk
• No profit is guaranteed by using this indicator
• The author bears zero responsibility for your P&L
If you are unsure about any trade, consult a registered
financial advisor before taking action.
Trade safe. Manage your risk. Protect your capital. 🙏
━━━━━━━━━━━━━━━━━━━━━━━━━━━━━━━━━━━━━━━━━━━━━━━━━━━━━━━━━━━━━━━━ Gösterge
Gösterge

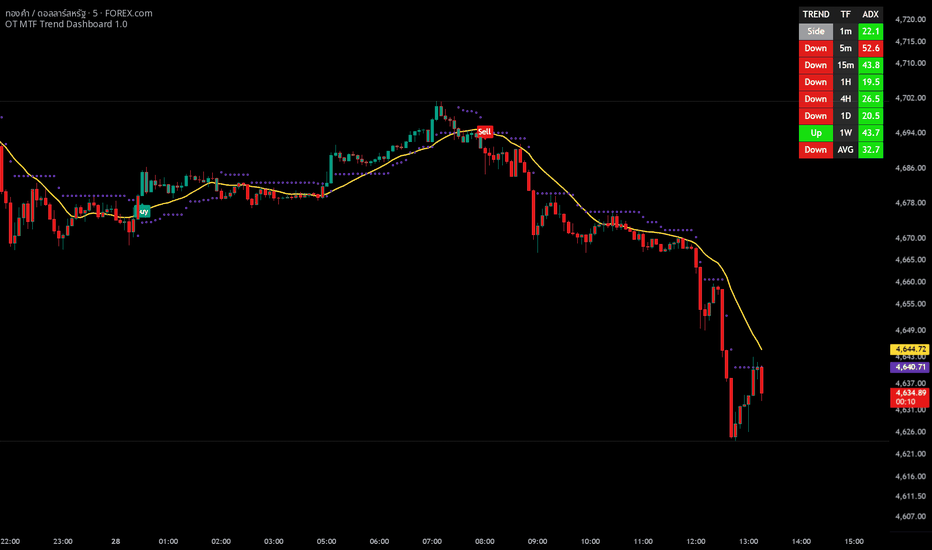
OT MTF Trend Dashboard 1.0OT MTF Trend Dashboard 1.0, is a sophisticated trend-following system designed to filter out "market noise" and focus on high-probability entries by aligning multiple technical factors across various timeframes.
Here is a breakdown of its logic and how to trade with it.
1. The Core Components (The Logic)
The script relies on a "triple-filter" logic to generate signals:
A. OT Bot (Sensitivity Filter)
This is a custom volatility-based trailing stop (similar to a Supertrend). It uses a "Key Value" (Sensitivity) and ATR to determine the immediate trend direction.
Heikin Ashi Option: It can use Heikin Ashi candles to smooth out price action, reducing "fake-outs."
SMA 17: A yellow Simple Moving Average acts as a secondary visual baseline for the short-term trend.
B. Supertrend (Main Trend Filter)
This acts as the "Master Trend." For a signal to be valid:
Buy signals only occur when the Supertrend is in a Bullish state (Price above the line).
Sell signals only occur when the Supertrend is in a Bearish state (Price below the line).
C. ADX Filter (Strength Filter)
The Average Directional Index (ADX) measures trend strength, not direction.
Active Range: The script only triggers signals when the ADX is between 15 and 45.
Logic: If ADX < 15, the market is too flat (choppy). If ADX > 45, the trend might be overextended and due for a reversal.
2. The Multi-Timeframe (MTF) Dashboard
The table on your screen is a Confirmation Hub. It looks at timeframes from 1 minute (1m) to 1 week (1W) using the following logic:
Trend Column: Uses EMA 20 and EMA 50 crossovers combined with price slope.
Green (Up): Fast EMA > Slow EMA + Positive Slope.
Red (Down): Fast EMA < Slow EMA + Negative Slope.
Gray (Side): No clear trend or low momentum.
ADX Column: Shows the trend strength for each specific timeframe.
Green: Trending (15–45).
Red: Not trending (below 15 or above 45).
3. How to Trade with this Indicator
Buying Strategy (Long)
Wait for the 'Buy' Label: This appears when the OT Bot flips bullish, the Supertrend is already bullish, and the ADX is in the "Goldilocks" zone (15–45).
Dashboard Confirmation: Look at the MTF Dashboard. Ideally, the AVG (Average) row and the timeframes higher than your current chart should be Green (Up).
Entry: Enter on the close of the candle where the "Buy" label appears.
Stop Loss: Place your stop loss slightly below the Supertrend Line or the OT Trailing Stop line.
Selling Strategy (Short)
Wait for the 'Sell' Label: This appears when the OT Bot flips bearish, the Supertrend is already bearish, and ADX is between 15–45.
Dashboard Confirmation: Ensure the MTF Dashboard shows Red (Down) on higher timeframes and the AVG row.
Entry: Enter on the close of the candle where the "Sell" label appears.
Stop Loss: Place your stop loss slightly above the Supertrend Line.
4. Pro-Tips for Success
The Power of "AVG": Never trade against the AVG Trend on the dashboard. If you are on a 5m chart but the AVG Trend is "Down," skip the "Buy" signals.
Confluence is King: The best trades happen when the Trend color and the ADX color on the dashboard are both Green across multiple timeframes.
Avoid "Side" Markets: If the dashboard is mostly Gray (Side), the market is ranging. This is where most trend-following indicators lose money. Wait for the dashboard to show a clear direction.
Yellow Line (SMA 17): Use this as a trailing exit. If price closes significantly on the "wrong" side of the yellow line, it may be time to take profits before the main signal flips. Gösterge
Negative Volume Index Oscillator [ZOM]Negative Volume Index Oscillator (NVI Oscillator) is a momentum-based indicator designed to highlight underlying market activity by focusing on periods of declining volume. Built around the classic Negative Volume Index (NVI) , this tool transforms the raw data into a normalized oscillator, making it easier to interpret shifts in trend, momentum, and potential reversals.
The oscillator measures the deviation of smoothed NVI from its long-term average, presenting this relationship as a percentage-based value centered around a zero line. This allows traders to quickly identify whether price action is supported by quieter, more “ informed ” market participation, which is often associated with institutional positioning.
A configurable signal line is included to help identify momentum shifts through crossovers and crossunders. These interactions can be used to spot early trend changes or confirm continuation depending on market context.
To provide additional structure, the indicator includes optional volatility bands derived from standard deviation. These bands help identify statistically stretched conditions where price may be overextended, increasing the likelihood of mean reversion or consolidation.
The script also features built-in divergence detection, comparing oscillator movement to price action. Bullish and bearish divergences are automatically identified, offering early warning signals of potential reversals when momentum and price begin to disagree.
Key features include:
- Oscillator derived from smoothed Negative Volume Index
- Signal line with multiple moving average options
- Volatility bands for identifying extreme conditions
- Histogram visualization for momentum strength
- Automatic bullish and bearish divergence detection
- Crossover and crossunder markers for signal clarity
- Fully customizable smoothing, lengths, and visual settings
This indicator is designed to complement price action analysis by providing a deeper view into momentum behavior during low-volume conditions, helping traders identify potential turning points and confirm trend strength. Gösterge

Gösterge

Gösterge

Gösterge

Gösterge

Gösterge

Gösterge

SHK 3 MA | SIGNAL STRENGTH MA [HA/ST/UT] | VWAP | TRIANGLE CROSS🔷 SHK 3 MA | Signal MA | VWAP | ▲▼ Cross Labels
An all-in-one trend-following overlay that combines three fully
customizable Moving Averages, an intelligent colour-coded Signal MA,
a manually anchored VWAP, and automatic triangle labels on every
MA crossover — all in a single clean indicator.
━━━━━━━━━━━━━━━━━━━━━━━━━━━━━━━
📐 THREE MOVING AVERAGES (MA 1 · MA 2 · MA 3)
━━━━━━━━━━━━━━━━━━━━━━━━━━━━━━━
Each MA is independently configurable with:
• Type — EMA | SMA | WMA | HMA | TEMA | DEMA | ZLEMA
• Length — 1 to 500
• Colour — fully customizable
Use them as trend bias lines, dynamic support/resistance,
or a classic 9/21/50 ribbon setup.
━━━━━━━━━━━━━━━━━━━━━━━━━━━━━━━
🎯 SIGNAL MA — 3-FILTER VOTING SYSTEM
━━━━━━━━━━━━━━━━━━━━━━━━━━━━━━━
A dedicated Signal MA whose colour dynamically reflects
market bias, scored from three independent filters:
✅ Heiken Ashi — Synthetic HA (non-repainting, real OHLC based)
✅ Supertrend — ATR-based trend direction
✅ UT Bot — ATR trailing stop momentum filter
🟢 Green = majority bullish (score > 0)
🔴 Red = majority bearish (score < 0)
⚪ Grey = conflicting / neutral (score = 0)
Each filter can be toggled ON/OFF independently.
Line width is also adjustable (1–5).
━━━━━━━━━━━━━━━━━━━━━━━━━━━━━━━
📊 VWAP (Manual Anchor)
━━━━━━━━━━━━━━━━━━━━━━━━━━━━━━━
Custom-built VWAP (not ta.vwap) with selectable anchor:
Session | Week | Month | Quarter | Year
The cumulative TPV/Volume resets cleanly at each anchor period,
giving accurate institutional price reference across all timeframes.
━━━━━━━━━━━━━━━━━━━━━━━━━━━━━━━
▲▼ MA CROSS LABELS
━━━━━━━━━━━━━━━━━━━━━━━━━━━━━━━
Triangle labels auto-plot at every crossover between:
• MA 1 × MA 2
• MA 2 × MA 3
▲ Up-triangle (below bar) = bullish cross
▼ Down-triangle (above bar) = bearish cross
Label text shows the exact period pair (e.g. 9×21).
Colour matches the respective MA colour. Up to 500 labels displayed.
━━━━━━━━━━━━━━━━━━━━━━━━━━━━━━━
🔔 ALERTS (6 pre-built conditions)
━━━━━━━━━━━━━━━━━━━━━━━━━━━━━━━
• MA1 crossed above/below MA2
• MA2 crossed above/below MA3
• Signal MA flipped Bullish 🟢
• Signal MA flipped Bearish 🔴
Signal MA flip alerts fire only once per state change
(not on every bar), keeping notifications clean and actionable.
━━━━━━━━━━━━━━━━━━━━━━━━━━━━━━━
⚙️ RECOMMENDED SETTINGS
━━━━━━━━━━━━━━━━━━━━━━━━━━━━━━━
Scalping / Intraday → 9 / 21 / 50 EMA | VWAP: Session
Swing Trading → 20 / 50 / 200 EMA | VWAP: Week/Month
All filters ON for strongest Signal MA confirmation.
━━━━━━━━━━━━━━━━━━━━━━━━━━━━━━━
📌 NOTES
━━━━━━━━━━━━━━━━━━━━━━━━━━━━━━━
• Built in Pine Script® v6
• Overlay indicator — works on any symbol and timeframe
• Heiken Ashi is synthetic (does not repaint real price values)
• UT Bot uses HA close as source for noise-filtered signals
• No repainting on MA or cross label logic
Best used on NSE / BSE instruments (Nifty, BankNifty, stocks)
on 5m, 15m, or 1H charts with all three filters enabled
for high-confidence trend confirmation.
━━━━━━━━━━━━━━━━━━━━━━━━━━━━━━━
⚠️ DISCLAIMER
━━━━━━━━━━━━━━━━━━━━━━━━━━━━━━━
This indicator is published for educational and informational
purposes only. It does not constitute financial advice, investment
recommendations, or a solicitation to buy or sell any financial
instrument.
All trading involves substantial risk of loss. Past performance
of any indicator or strategy does not guarantee future results.
You are solely responsible for your own trading decisions.
This script does not repaint on MA or cross label logic; however,
the Signal MA colour (HA · ST · UT filters) is calculated on the
current bar and may update until the bar closes. Always wait for
bar close confirmation before acting on any signal.
The author is not a SEBI-registered investment advisor.
Use this tool at your own risk. Always apply proper
risk management and consult a qualified financial professional
before making any trading decisions.
© SHK — All rights reserved. Please do not copy, reproduce,
or publish this script without the author's permission. Gösterge

Gösterge