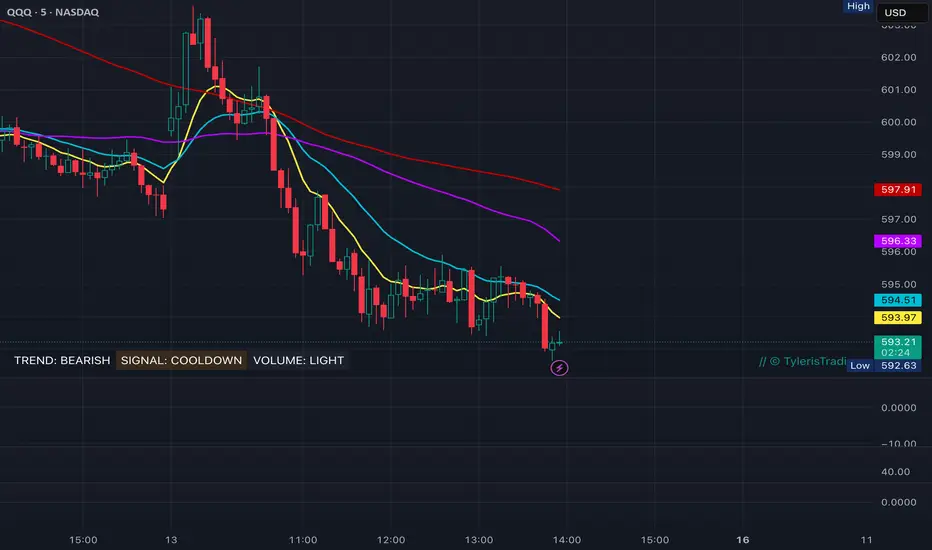
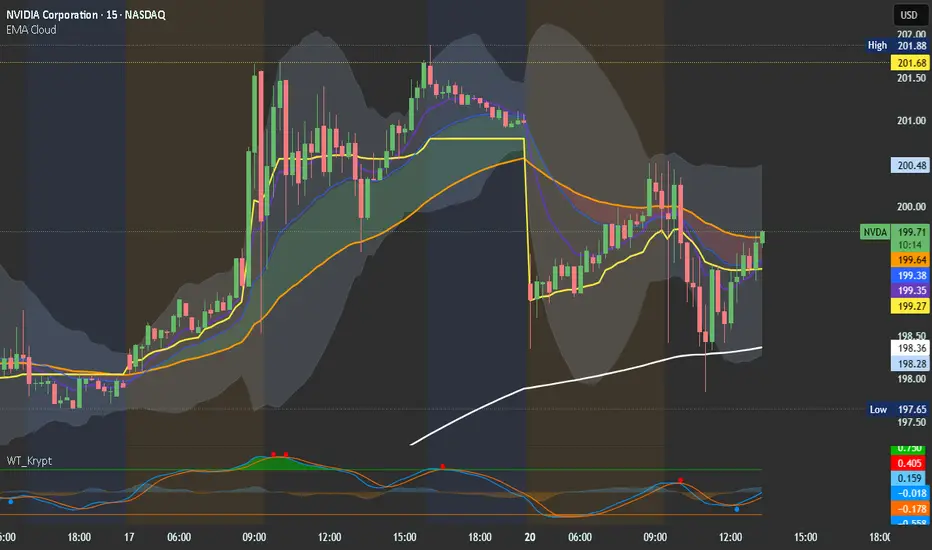
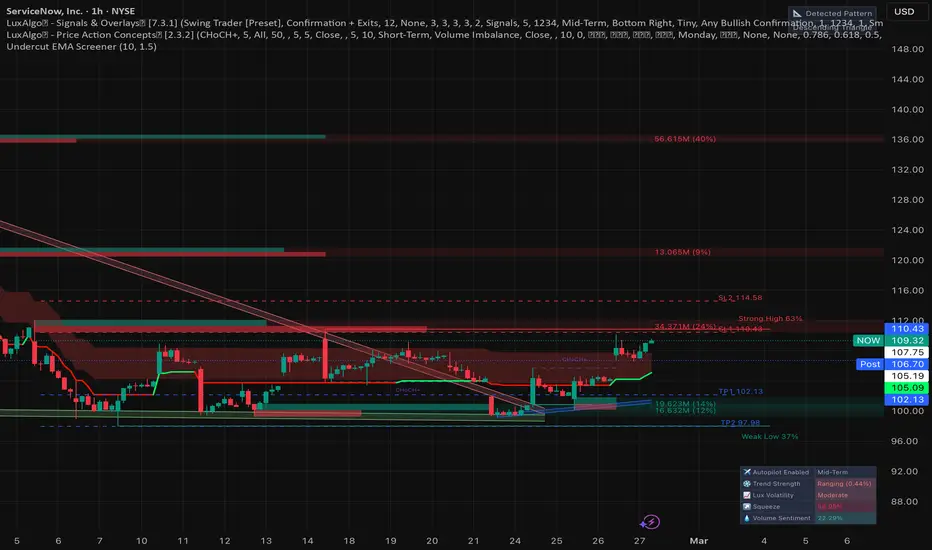
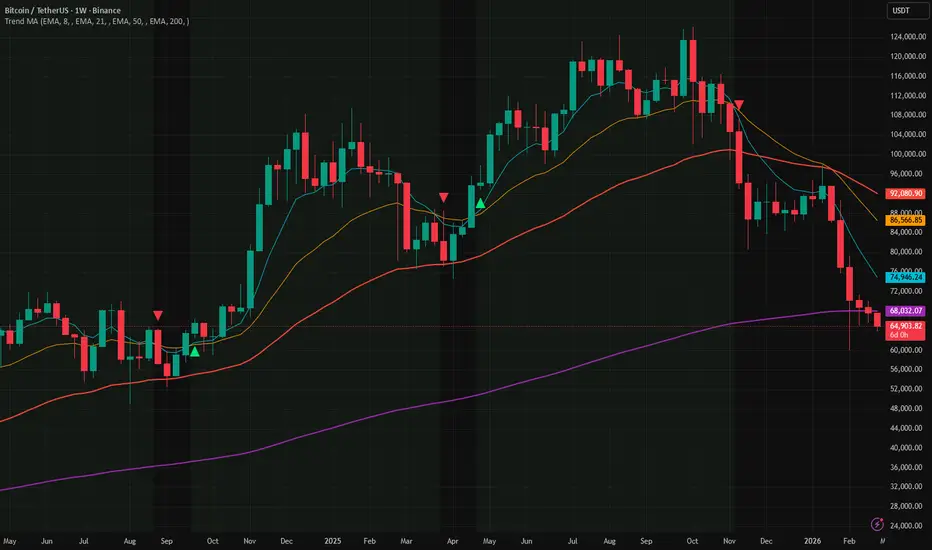
Multiple EMA20Multi-Timeframe EMA20 Levels
This indicator displays the latest EMA(20) values from multiple higher timeframes directly on the current chart. Each selected timeframe calculates its own EMA20 and plots it as a horizontal level, allowing traders to quickly see where important higher-timeframe dynamic support and resistance levels are located.
Instead of switching between different charts, you can view several timeframe EMAs simultaneously. This helps identify confluence zones, track trend alignm
Gösterge