Gösterge
Gösterge

Gösterge

Gösterge

Gösterge

Gösterge

Bank CRE Stress & Short Risk Overlay + Dashboard🏦 Bank CRE Stress & Short Risk Overlay + Dashboard
This open-source indicator overlays risk visualization and a fixed dashboard specifically for **U.S. regional bank stocks** exposed to Commercial Real Estate (CRE) lending stress (as observed in 2023–2026 cycles).
It combines:
- Static CRE exposure tiers (critical/high/elevated/short-bias/failed) based on latest known CRE loan-to-capital ratios and provisions data (sourced from FDIC Call Reports, FAU studies, FFIEC filings ~Q3/Q4 2025)
- Real-time price stress detection (EMA200 breakdown + 20-bar range low breach)
- Visual alerts (background coloring + per-bar risk labels)
- Top-right summary dashboard
Purpose & Why This Combination?
Regional banks with heavy CRE concentration became focal points during rising office/vacancy stress, higher provisions, deposit outflows, and equity pressure. This tool helps traders quickly:
- Identify which tickers carry elevated CRE risk
- See when technical breakdown aligns with fundamental vulnerability (potential short setups or high-risk avoidance zones)
- Monitor a static watchlist without needing external spreadsheets
The mashup is useful because raw fundamentals change quarterly, while price action provides real-time confirmation of stress transmission to equity. Dashboard + overlay gives instant context on any bank chart.
How It Works
1. Ticker Classification (static – update manually when new Call Reports released)
- 🔴 Critical / Short Bias: >~500% CRE exposure or high-conviction short candidates
- 🟠 High: ~375–480%
- 🟡 Elevated: ~300–350%
- ❌ Failed: Known FDIC receivership cases
- 🟢 Low/None: not in list
2. Price Stress Trigger
- Below 200 EMA (major trend break)
- Below 20-bar lowest low (range breakdown)
- (Optional stricter filter: ATR expansion – commented out by default)
3. Visuals
- Background tint: black (failed), red (critical/short + stress), orange (high + stress), yellow (elevated + stress)
- Per-bar label above candle: risk category + warning text (only shown for relevant banks)
- EMA50 (gray) & EMA200 (white) plotted for reference
4. Dashboard (top-right, updates on last bar)
- Current ticker risk level + color coding
- Price stress status
- EMA200 position
- Static high-risk watchlist
- Data freshness & disclaimer note
Alerts
- "Critical/Short Bias Breakdown" when stress triggers on red/orange tickers
- "Failed Bank Symbol" on known failed tickers
How to Use
- Apply to **regional bank stocks** (DCOM, EGBN, OZK, LOB, VLY, FLG, ZION, WAL, SNV, RF, CMA, TFC, etc.)
- Best on daily or 4h charts for swing/position trading context
- Use as a **filter / watchlist aid**:
→ Red/orange background + stress label → heightened short risk or avoidance
→ Yellow → monitor for provisioning news or CRE delinquency spikes
→ Black → avoid (historical failures)
- Update the arrays quarterly when new FDIC data drops (Q1/Q2/Q3/Q4 Call Reports)
- Combine with volume, news, sector ETFs (KRE), or broader CRE indices
Inputs & Customization
- No user inputs — risk tiers are hardcoded for simplicity & consistency
- To add/remove banks: edit the array.from() lines directly
Publishing Notes
- Publish with a clean chart (e.g., DCOM, EGBN or VLY daily/4h)
- Remove unnecessary drawings/indicators
- Screenshot showing dashboard + stress label during a breakdown period is ideal
Important Disclaimers
- Data is **static** and approximate (based on public reports up to ~Q3/Q4 2025)
- Must be manually updated — not real-time fundamental feed
- This is **not financial advice**, not investment research, and carries no accuracy guarantee
- Regional bank equities are extremely volatile — especially under CRE stress
- Trading or shorting involves substantial risk of loss
Open-source for transparency & educational use. Feedback welcome — especially updated CRE tier suggestions. Gösterge

NQ 9:45-10:15 ICT Strategy - CompleteNQ 9:45–10:15 ICT Strategy – High-Probability Nasdaq Scalper (ICT/Smart Money)
This open-source strategy is a complete, rules-based implementation of core Inner Circle Trader (ICT) / Smart Money concepts, specifically optimized for **Nasdaq futures (NQ)** during the high-volatility 9:45–10:15 AM New York time window (first 30 minutes after the 9:30 open liquidity grab phase).
Core Philosophy & Why This Combination?
ICT emphasizes that institutional order flow often creates **false moves** (liquidity sweeps of previous day high/low), followed by **market structure shifts (MSS / Break of Structure)** that reveal true directional intent, with entries taken from **mitigation of Order Blocks** (areas of institutional interest / imbalance).
This script enforces strict confluence:
- Daily bias filter (price or prev close vs daily EMA20)
- Liquidity sweep confirmation (PDH/PDL raid + reversal close)
- Bullish/Bearish Market Structure Shift (close beyond last swing high/low)
- Refined Order Block detection (last opposite candle before MSS, with defensive/aggressive mitigation logic inspired by popular ICT order block refinements)
- Tight time filter (only 9:45–10:15 NY) — captures post-open manipulation & directional resolve
- One trade per day rule — prevents overtrading in chop
The tight combination reduces false signals dramatically and aligns with ICT's focus on high-probability setups during specific market sessions.
Key Components & Logic
1. Daily Bias
- Bullish if current price > daily EMA20 (or prev daily close > EMA20 — user choice)
- Bearish otherwise
- Background tint + orange EMA line
2. Liquidity Sweep
- Low < PD Low but close > PD Low → bullish sweep (stops taken below)
- High > PD High but close < PD High → bearish sweep
- Resets daily
3. Market Structure Shift (MSS / BoS)
- Bullish MSS: close > last fractal swing high
- Bearish MSS: close < last fractal swing low
- Uses 5-bar fractal detection for swing points
- Resets daily
4. Order Block (OB) Detection & Refinement
- Bullish OB: last bearish candle (close < open) before bullish MSS
- Bearish OB: last bullish candle before bearish MSS
- Refinement options (On/Off):
- Defensive: tightens OB to body or wick depending on candle range vs ATR(55)
- Aggressive: uses full candle wick range
- OB box drawn until mitigated (price touches opposite side)
- Labeled "OB+" / "OB-"
5. Entry Window & Confluence
- Only allowed 9:45–10:15 NY time
- Long: bullish bias + low swept + bullish MSS + price mitigates bullish OB (touches high side, closes inside/above low side)
- Short: mirror logic
- One trade per day max
6. Risk & Exit
- SL = opposite side of Order Block
- TP = 2:1 RR (adjustable) from entry
- No trailing / partials — clean single target
Visuals
- Daily EMA (orange)
- Prev Day High/Low circles
- Bullish/Bearish background tint
- MSS triangles
- Order Block boxes + "OB+"/"OB-" labels
- Entry labels with price/SL/TP
Alerts
- "NQ Long: Bullish Bias + Sweep + MSS + OB"
- "NQ Short: Bearish Bias + Sweep + MSS + OB"
Realistic Backtesting & Usage Guidelines
To publish non-misleading results:
- Initial Capital: $10,000–$50,000 (realistic futures account)
- Position sizing: 1–3% of equity per trade (change default_qty_value from 100%!)
- Commission: $4–$8 round-turn per contract (typical NQ futures commission)
- Slippage: 1–4 ticks (NQ is liquid but fast-moving post-open)
- Dataset: ≥2–3 years of 1-minute or 5-minute NQ data (aim for 300–600+ trades)
- Risk per trade: 0.5–1.5% with defaults — never risk more than sustainable
The 30-minute window produces relatively few trades per year — perfect for statistical significance over long periods, but results vary heavily by market regime (trending vs. choppy opens).
How to Use
1. Apply to NQ1! or MNQ1! (continuous futures) on 1-minute or 5-minute chart.
2. Keep default NY timezone (America/New_York).
3. Start with 2:1 RR, Defensive refinement, show levels on.
4. Trade only during the window — best setups show clear sweep + MSS + OB mitigation.
5. Avoid major news overlapping the window (FOMC, CPI, etc.) or widen SL.
6. Forward-test on demo for several months — this is a high-confluence, low-frequency setup.
Publish Recommendation
- Use a clean chart: only this strategy, no extra indicators/drawings.
- Show realistic Strategy Tester view with commission/slippage applied.
- Screenshot during NY morning session with visible OB & signal.
Test thoroughly and trade responsibly. Strateji

Gösterge

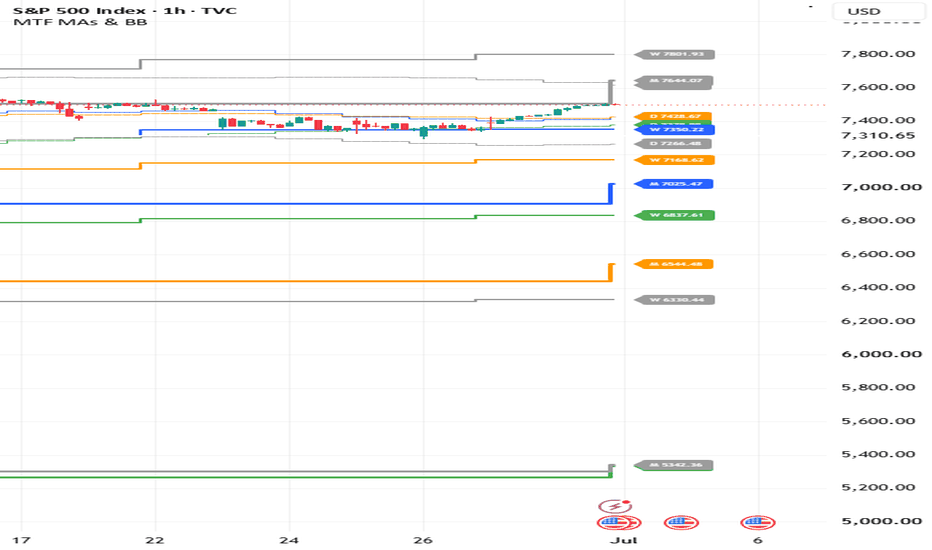
MTF Moving Averages [ST]**MTF Moving Averages ** is a professional Multi-Timeframe (MTF) indicator designed to plot Daily and Weekly trend lines directly on intraday charts (e.g., 5m, 15m, 1H).
This tool solves the common problem of losing "big picture" context while day trading. It allows you to see exactly where the Daily 20 EMA or Weekly 200 SMA sits without ever switching timeframes.
### 🛠 Key Features
1. **Stepline Accuracy (The "Step" Style):**
* Unlike standard MTF indicators that smooth out lines (creating a repainting illusion), this tool uses a **Stepline** visualization by default.
* **Why it matters:** It shows exactly what the Daily/Weekly value was *at that specific moment in time*. If the line is flat, the higher timeframe bar hasn't closed yet. This offers zero lag and true historical accuracy.
2. **Ultra-Clean Interface:**
* **Status Line Hidden:** We have removed the cluttered list of values (often shown as "Ø Ø Ø") from the chart header. The title remains strictly `MTF MAs `.
* **Data Window:** Exact values are fully accessible via the Data Window or by hovering over the lines.
3. **Dual Groups (D & W):**
* **Daily Group:** EMA 9, EMA 20, SMA 50, SMA 200.
* **Weekly Group:** EMA 9, EMA 20, SMA 50, SMA 200.
* *Note:* By default, only the **Daily 9, 20, and 50** are enabled to keep the chart clean. The SMA 200 and Weekly lines can be enabled in the settings.
### 📚 How to Use
* **Trend Filter:** Use the **Daily EMA 20 (Orange)** as your primary "Line in the Sand". If the intraday price is holding above the Daily 20, the macro trend is bullish.
* **Major Reversals:** The **SMA 200 (Red)** on Daily/Weekly frames acts as major institutional support/resistance. These are high-probability areas for bounces or rejections.
* **Confluence:** Watch for intraday setups (like flags or wedges) that form right on top of a Daily "Step". These setups have higher success rates due to higher timeframe alignment.
### ⚙️ Standardization
* Part of the suite.
* English-native codebase and settings.
* Optimized using `barmerge.gaps_off` for seamless data connectivity.
---
*Disclaimer: This tool is for educational purposes and technical analysis assistance only. Always manage your risk.* Gösterge
XAUUSD 1-Minute Scalping Strategy - Advanced Strategy for ExitsThis is a **mean-reversion scalping strategy** optimized for **XAUUSD on the 1-minute (or the 5-minute) timeframe**. It combines a classic **RSI(14)** oscillator with an optional **200-period EMA trend filter** to identify short-term overextended conditions in gold price action, while enforcing fixed, conservative exits to maintain strict risk control.
### Core Logic & Why This Combination:
The strategy enters counter-trend when RSI reaches extreme levels (below 30 for longs, above 70 for shorts), capturing quick snap-backs that frequently occur in gold's intraday volatility.
- **RSI(14)** acts as the primary momentum filter — detecting oversold/overbought exhaustion.
- The **200 EMA trend filter** (enabled by default) adds directional context: longs are allowed only when price is above the EMA (overall uptrend bias), shorts only below it (downtrend bias). This reduces whipsaws in strong trending sessions and improves trade quality without overly restricting opportunities.
- Disabling the trend filter allows pure mean-reversion trading (useful in ranging/Asian sessions), but enabling it is strongly recommended for better expectancy in most market conditions.
Entries occur only when flat (no pyramiding), keeping the system clean and directional.
### Exit Rules (Fixed at Entry):
- **Take Profit**: +10 pips (0.10 in XAUUSD price terms)
- **Stop Loss**: -5 pips (0.05 in price terms)
- **Risk:Reward** = 1:2
Exits are **set once on the entry bar** using limit/stop orders — this prevents dynamic recalculation and mimics real broker behavior more closely. The 2:1 RR gives the strategy mathematical edge even with moderate win rates.
### Performance & Realism Guidelines:
This strategy is tuned for **high-frequency scalping** on gold, which typically produces hundreds to thousands of trades per year on 1-minute data.
Recommended **backtest/publication settings** (update these in the strategy properties before publishing):
- **Initial Capital**: $10,000 – $50,000 (realistic for retail prop/swing traders; the script defaults to $1,000,000 only for visual scaling — change it!)
- **Order Size**: Fixed 0.10–0.50 lots (adjust according to account size)
- **Commission**: 3–7 USD per round-turn lot (typical ECN/raw-spread gold commission on brokers like IC Markets, Pepperstone, etc.)
- **Slippage**: 2–5 ticks (≈0.02–0.05 in price) — gold can be slippery during news/volatility spikes on 1-minute charts
- **Pyramiding**: 1 (default — no stacking)
- **Dataset**: At minimum 1–3 years of 1-minute data (aim for >500–1000 closed trades for statistical significance)
With realistic costs applied, expect win rate ≈55–70%, profit factor >1.4–1.8 in favorable periods, but results vary significantly across trending vs. ranging regimes and news events.
**Risk per trade** remains very controlled (typically <0.5–1.5% depending on SL distance and position sizing) — never exceeds sustainable levels.
### Important Usage Notes:
- Check thoroughly the curve-fitted back tests.
- Gold is extremely volatile on 1-minute charts; check major news (NFP, FOMC, FED) unless you widen SL/TP dynamically (you can manually implement it here).
- Always forward-test on demo first and use proper position sizing.
- The built-in dashboard shows live stats (net P&L, win rate, profit factor, current RSI, position status, etc.) for quick monitoring.
- Restricted Sample Size for Precision
Happy scalping — trade responsibly! 🚀 Strateji

Gösterge

Gösterge

Gösterge

Gösterge

MAD RSIMAD RSI ~ by GForge
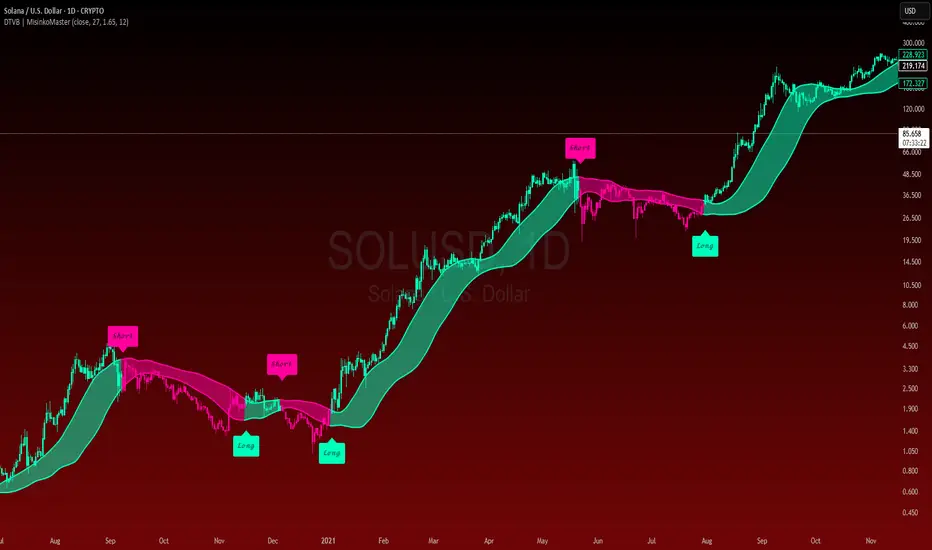
An adaptive trend-following indicator that combines RSI momentum with Median Absolute Deviation (MAD) volatility bands to identify trend direction, gauge regime strength, and generate entry/exit signals.
Core Concept
Most band-based indicators use Standard Deviation to measure volatility. The problem is that StdDev is highly sensitive to outlier candles — a single spike from news, earnings, or liquidation cascades can blow out the bands and distort signals. This indicator replaces StdDev with Median Absolute Deviation (MAD), a statistically robust volatility measure that resists outliers while still tracking genuine changes in market volatility. The result is more stable bands that better represent the true trading range.
RSI-Adaptive Mechanism
A smoothed RSI is calculated and used to dynamically scale the band width. The logic works as follows: when RSI is near 50 (neutral/indecisive), the bands stay at their base width. As RSI moves further from 50 in either direction — indicating stronger bullish or bearish momentum — the bands widen proportionally. This creates a self-adjusting system: during strong trends the bands expand to avoid premature exits, and during choppy consolidation they contract to keep signals responsive.
The RSI smoothing parameter applies an EMA on top of the raw RSI to control how quickly the adaptive multiplier responds. A low smoothing value makes the bands react quickly to momentum shifts. A higher value smooths out the adaptation, which can reduce whipsaws in noisy conditions.
Oscillator & Signal Logic
The indicator computes a Basis line (Simple Moving Average) and places the adaptive MAD bands above and below it. Price position within these bands is then normalized into an oscillator ranging from 0 to 100, where 0 means price is at the lower band, 50 means price is at the basis, and 100 means price is at the upper band.
Signals are generated when this oscillator crosses key thresholds:
A long signal fires when the oscillator crosses above the Long Threshold, indicating price has moved convincingly into the upper portion of the adaptive channel.
A short/exit signal fires when the oscillator crosses below the Short Threshold, indicating momentum has weakened and price is falling back within the channel.
The thresholds are independently configurable. For example, setting a Long Threshold of 80 means you require price to push well above the midpoint before entering, while a Short Threshold of 30 means you exit relatively early before price reaches neutral. This asymmetry can be tuned for different risk appetites — tighter thresholds produce more signals with smaller moves, wider thresholds produce fewer signals but filter out more noise.
Key Parameters
Source — the price input for all calculations. Close is standard, but hl2, hlc3, or ohlc4 can provide smoother behavior on volatile instruments.
RSI Length — controls the RSI lookback period. Longer values produce a smoother RSI that changes the adaptive multiplier gradually. Shorter values make it more reactive.
RSI Smoothing — additional EMA smoothing applied to the RSI before it feeds into the adaptive multiplier. Set to 1 for no extra smoothing.
Basis Length — the SMA period for the center line of the channel. This is the trend anchor. Longer values track slower trends, shorter values hug price more closely.
MAD Length — lookback for the Median Absolute Deviation calculation. Controls how many bars contribute to the volatility estimate. Longer values produce more stable bands, shorter values adapt faster.
Volatility Multiplier — the base scaling factor for band width before RSI adaptation is applied. Higher values widen the bands and reduce signal frequency. Lower values tighten them and increase signal frequency.
Visuals
A gradient cloud beneath price provides an at-a-glance read of trend regime and strength. Bar colors reflect the oscillator position. Signal markers appear as diamonds above and below bars.
Usage Notes
This is a tool to assist your analysis, not a standalone trading system. Always apply your own risk management and confirm signals with additional context.
Past performance does not guarantee future results.
Default settings are a starting point — optimize for your specific instrument, timeframe, and trading style.
The MAD calculation is particularly well-suited for instruments prone to sudden spikes or gap moves where Standard Deviation-based indicators tend to produce erratic signals.
Developed by GForge Gösterge

Gösterge

Gösterge

Gösterge

Gösterge

Gösterge

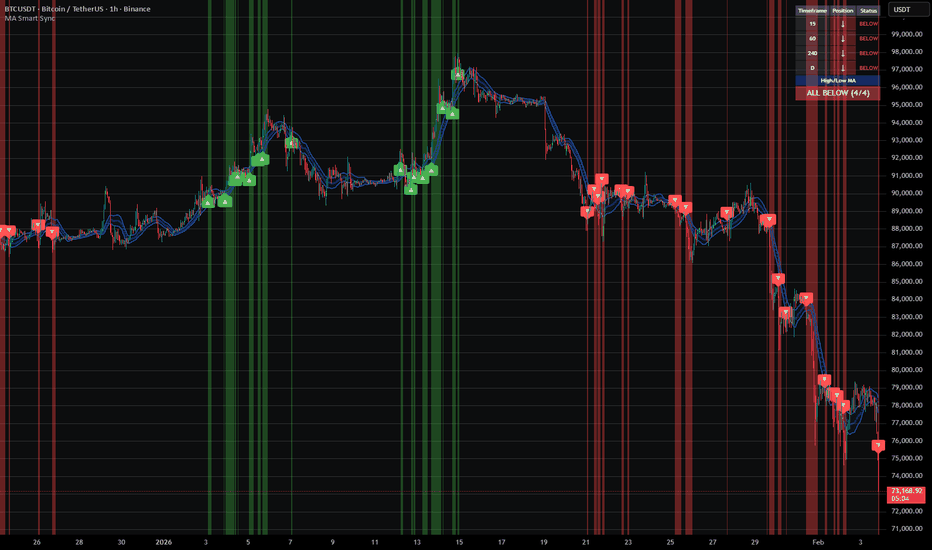
MA Smart SyncMA Smart Sync determines the market bias by evaluating the price position relative to a moving average channel on four independent timeframes and returning a confluence signal when a configurable number of them agree.
Unlike standard MTF trend indicators that rely on EMA crossovers or slope direction, this script builds a channel around each timeframe and classifies price into three discrete zones: above, below, or inside. The "inside" state acts as a neutral filter, preventing false confluence signals during consolidation — a key distinction from binary up/down dashboards.
The channel itself can be constructed using five different methods selectable from a single input: High/Low MA (separate MAs applied to high and low), Close ± ATR, Close ± Standard Deviation, Close ± percentage offset, or classic Bollinger Bands. All five use the same MA type and length inputs, making it straightforward to compare how different volatility envelopes behave on the same instrument without rebuilding the indicator.
How to use:
— Set four timeframes matching your trading plan (defaults: 15m, 1h, 4h, D).
— Choose the channel method that fits your instrument's volatility profile. ATR-based channels adapt well to forex; StdDev and Bollinger suit equities and indices.
— Set "Minimum Confluence" to 3 or 4. A value of 4 means all timeframes must agree before a signal fires.
— The background color and arrow labels update only when bias changes, keeping the chart clean.
— Use the status table (top-right) to monitor each timeframe independently and identify which TFs are lagging. Gösterge
Gösterge