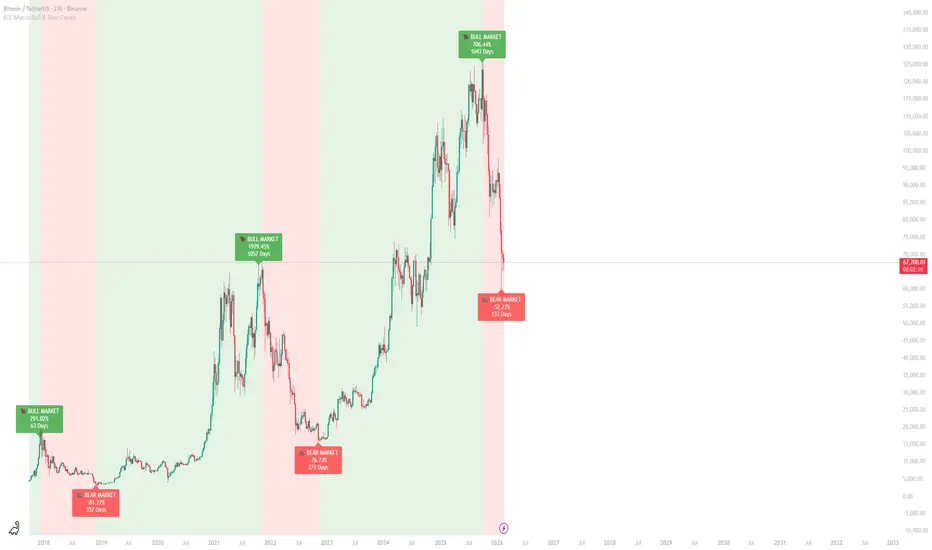
Gösterge

High Volume Impulse Candles (3x/4x)Here’s a polished **description you can use when publishing your High-Volume Impulse Candle indicator** on TradingView:
---
### **Title:**
High-Volume Impulse Candles (3x / 4x Thresholds)
### **Description:**
This indicator highlights **high-volume impulse candles** on any timeframe, making it easy to spot strong buying or selling pressure in the market.
**Features:**
* **Orange Candle:** Volume **3×–4×** above the 20-bar average → strong impulse
* **Red Candle:** Volume **>4×** above the 20-bar average → extreme impulse
* Works on **all timeframes** and is suitable for **BTC and other crypto pairs**.
* Simple, clean, and visually intuitive – instantly shows market momentum without clutter.
**Usage:**
* Use in conjunction with your **trend analysis** (e.g., EMA stack) to identify **high-probability entries**.
* Helps detect **potential breakouts, reversals, and explosive moves**.
* Works best when combined with **support/resistance levels** or higher timeframe confirmations.
**Inputs:**
* Volume SMA Length (default: 20 bars)
* Impulse Thresholds: Orange (3×), Red (>4×)
**Disclaimer:**
This indicator is a **tool to identify momentum** and should be used alongside your **risk management and analysis strategy**. Past impulses do not guarantee future price movement.
---
If you want, I can also **draft a shorter “TradingView-ready” version** that’s **concise, catchy, and optimized for the public library**, which tends to attract more users.
Do you want me to do that?
Gösterge

Gösterge

Gösterge

Gösterge

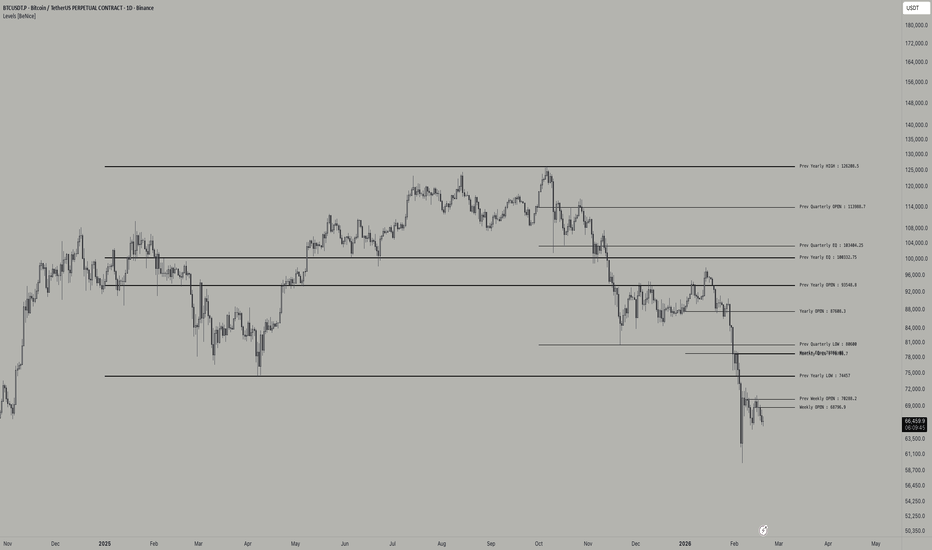
Levels [BeNice]
Levels is a precision mapping tool for traders who rely on High Timeframe (HTF) levels to define their daily bias. It automates the process of marking Open, High, Low, and Equilibrium (EQ) levels across all major lookback periods.
💎 Key Functionalities
Dynamic HTF Mapping: Supports Yearly, Quarterly, Monthly, Weekly, Daily, and H4 timeframes.
Monday Range Specialist: Specifically tracks Monday's price action, a vital zone for setting the weekly narrative.
EQ (Equilibrium) Tracking: Automatically plots the mid-point of any given period, helping you identify Discount and Premium zones instantly.
Clean UI Logic: Features a built-in "anti-overlap" array system. If multiple levels occupy the same price point, the script optimizes the visuals to keep your chart professional and readable.
Full Customization: Control line styles (Solid, Dotted, Dashed), colors, text sizes, and line extensions to fit your personal chart aesthetic.
💡 Pro Trading Tip
Use these levels as Liquidity Targets or Points of Interest (POI). When price interacts with a Prev. Weekly High or a Monthly Open, look for the Reversal Pro+ SFP signals to confirm high-probability trade entries. Gösterge
Smart Money Concepts AI - AdaptiveSmart Money Concepts AI scores every Fair Value Gap and Order Block with a 5-factor quality engine so you can instantly see which zones are worth trading and which are noise.
◈ How It Works
This indicator detects three core Smart Money / ICT concepts and layers an AI scoring system on top.
Market Structure tracks swing highs and lows to identify Break of Structure (BOS) and Change of Character (CHoCH). BOS means the trend is continuing. CHoCH means it may be reversing. The indicator automatically classifies each break and draws labeled lines on your chart. CHoCH lines are solid and thicker since they're the more significant events. BOS lines are dashed. Both can be toggled independently.
Fair Value Gaps (FVGs) are 3-candle imbalances where price moved so fast it left a gap. The indicator detects these automatically and draws scored boxes on the chart. Each FVG gets a quality score from 0 to 100. Higher-scored zones appear more vivid; lower-scored zones fade out. When price fills the gap (mitigation), the box turns dashed.
Order Blocks (OBs) are the last opposite candle before a structural break. They represent institutional accumulation or distribution. When a bullish CHoCH/BOS fires, the indicator looks back for the last bearish candle near the swing low and marks it as a demand zone. Bearish OBs work in reverse. Each OB is scored by displacement strength, volume, and trend alignment.
◈ The AI Scoring Engine
Every zone gets a 0-100 quality score based on 5 factors:
For FVGs:
Gap Size vs ATR: sweet spot is 0.3x to 1.5x ATR. Too small = noise, too big = likely fills fast
Displacement Strength: body-to-range ratio of the middle candle. Full-body candles = institutional conviction
Volume: displacement candle volume vs 20-period average
Trend Alignment: does the FVG direction match the EMA trend?
Structure Alignment: does it align with the current BOS/CHoCH direction?
For Order Blocks:
OB Size: tighter zones (0.3-1.0 ATR) score higher for precision
Post-OB Displacement: how far price moved after leaving the OB. Bigger moves = stronger institutional interest
Volume, Trend, and Structure: same alignment checks as FVGs
The score directly controls visual opacity. High-scoring zones are vivid and prominent, low-scoring zones are subtle and transparent. You can filter to "High Only" to hide zones scoring below 50.
◈ Signals
Signals fire when price enters a scored FVG zone with structural and trend alignment. If a scored Order Block overlaps the FVG, the score increases further.
★ Bright signals = high confluence (score ≥ 70 default). FVG + OB overlap + structure + trend all confirm.
○ Dim signals = moderate confluence (score ≥ 50). The setup exists but not all factors align perfectly.
By default, only ★ bright signals are shown to keep the chart clean. You can enable dim signals in settings if you want to see every zone touch. A configurable cooldown (default 10 bars) prevents signal spam.
All signals are non-repainting. They only appear on confirmed bar closes.
◈ How to Read the Dashboard
SMC AI ◈: header
Structure: current direction (▲ BULLISH / ▼ BEARISH / — RANGING) with bias label
Trend(50): whether the EMA trend agrees with structure (✓ ALIGNED = go / ✗ COUNTER = caution)
Best FVG: quality score of the highest-rated active FVG in the current direction, with visual bar
Best OB: quality score of the highest-rated active Order Block, with visual bar
Signal: last signal state (★ LONG / ○ SHORT / — WAITING) with the actual entry score
Zones: count of active bull/bear FVGs and OBs on chart
The Signal row shows the actual score from when the signal fired, so it always matches the label on the chart.
◈ Recommended Settings
Forex (EUR/USD, GBP/JPY) 1H to 4H: Swing Length 5, ATR 14, Trend EMA 50, Signal Cooldown 10
Forex scalping 15min: Swing Length 3, ATR 10, Trend EMA 34, Signal Cooldown 5
Crypto (BTC, ETH) 1H to 4H: Swing Length 5, ATR 14, Trend EMA 50, Signal Cooldown 10
Gold / Commodities 4H to Daily: Swing Length 7, ATR 14, Trend EMA 50, Signal Cooldown 15
Indices (NAS100, SPX500) 15min to 1H: Swing Length 3 to 5, ATR 10, Trend EMA 34, Signal Cooldown 8
For aggressive setups: Lower Min Signal Score to 40, enable dim signals, show more FVGs (8 to 10)
For conservative setups: Raise Min Signal Score to 70, filter FVGs to "High Only", increase cooldown
◈ Key Features
✓ Non-repainting: all signals confirmed on bar close
✓ AI zone scoring: 5-factor quality engine, 0-100 per zone
✓ Visual hierarchy: opacity reflects score, you instantly see what matters
✓ Mitigation tracking: filled FVGs and broken OBs fade automatically
✓ Rich tooltips: hover any signal for full breakdown
✓ 9 alert conditions: BOS, CHoCH, bull/bear signals, AI-confirmed signals
✓ Signal clutter control: cooldown + dim toggle keeps charts clean
✓ Fully customizable: colors, zone counts, thresholds, all adjustable
✓ 100% original code: not derived from any existing script
◈ What This Is NOT
This is not a "paint arrows and win" indicator. SMC/ICT trading requires understanding context. Where is structure pointing? Which zones are institutionally significant? Is the trend aligned? This indicator helps you answer those questions faster by scoring every zone objectively.
Always use proper risk management. Past performance does not guarantee future results.
Happy trading. Gösterge

Gösterge

Gösterge
Gösterge

Gösterge
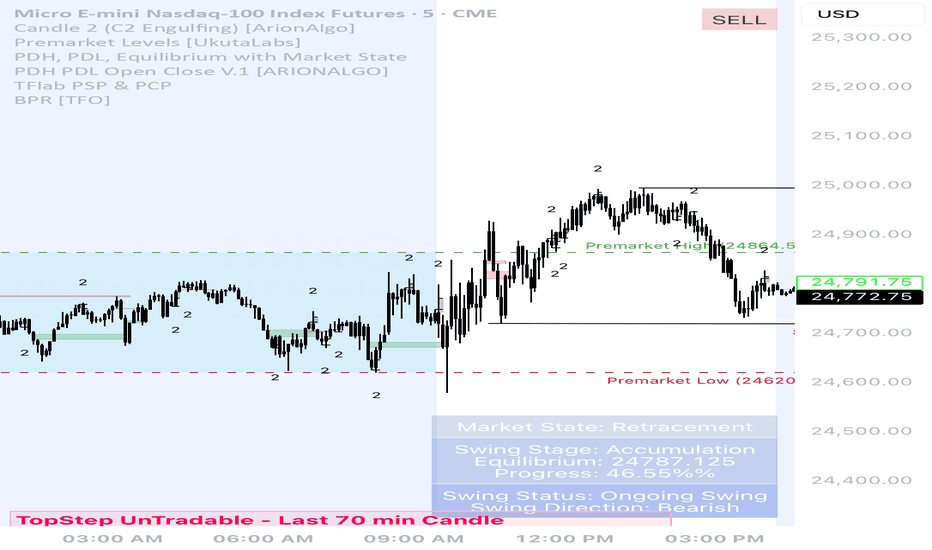
Bob's Matrix 2.0 - Signal StrengthSuggested Title: Institutional Matrix & Signal Strength
Description:
This indicator is a comprehensive battle station designed for high-precision institutional trading, based on Smart Money Concepts (SMC) and Fractal Timeframe Confluence. Its primary goal is to eliminate subjectivity and confirm market direction through total data alignment.
How does it work?
The indicator analyzes in real-time the Bias of 5 key timeframes: Daily (D1), 4 Hours (H4), 1 Hour (H1), 15 Minutes (15M), and 5 Minutes (5M). It uses a price-action logic comparing opening and closing prices to determine who controls the order flow at every level of the market.
Key Features:
Institutional Matrix: A dynamic visual panel showing Bullish (BULL) or Bearish (BEAR) bias across all fractals.
Signal Strength: A proprietary algorithm that calculates the percentage of confluence between all timeframes.
100% / 0%: Full institutional alignment (High Probability).
40% - 60%: Accumulation or retracement zone (Indecision).
SMC Optimized: Ideal for confirming entries after a Liquidity Sweep, a CHoCH (Change of Character), or when mitigating an Order Block.
Manipulation Detection: Easily identify when lower timeframes (M5/M15) are fighting the major trend, helping you avoid common market traps.
How to Trade it:
For professional execution, follow the Institutional Cascade workflow:
Check the Daily bias to establish the master direction.
Wait for the H1 setup to align with the Daily trend.
Look for your entry trigger on M5/M15 only when the Signal Strength exceeds 80%, ensuring you are trading alongside "Smart Money."
"The market is a device for transferring money from the impatient to the patient." Gösterge

Alpaca-trade
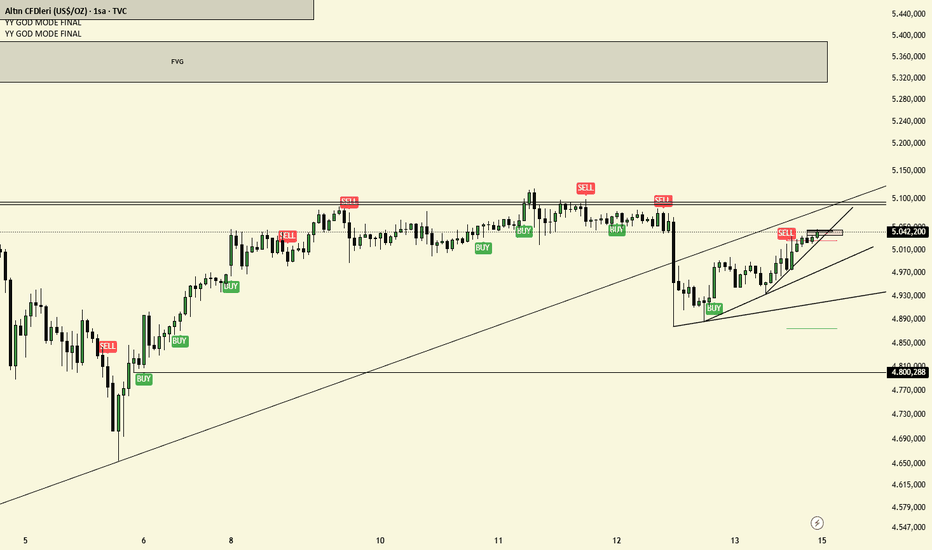
V3S-GodMode Synced Strategy คือเครื่องมือ All-in-One สำหรับเทรดเดอร์สาย ICT / SMC (Smart Money Concepts) ที่ออกแบบมาเพื่อการเทรด Gold (XAUUSD) และ Futures โดยเฉพาะ รวบรวมเครื่องมือวิเคราะห์โครงสร้างราคาและเวลา (Time & Price) ที่สำคัญที่สุดไว้ในหน้าจอเดียว พร้อมระบบ Clean Chart ที่ช่วยให้กราฟไม่รก
🚀 Key Features (ฟีเจอร์หลัก):
1. 🏛️ Market Structure & Trend
Trend Filter: กรองเทรนด์หลักด้วย EMA 200 (ปรับแต่งได้)
VWAP: เส้นค่าเฉลี่ยถ่วงน้ำหนักปริมาณการซื้อขาย
Swing Detection: ระบุจุด Swing High/Low อัตโนมัติ (เลือกดูย้อนหลังหรือดูแค่ปัจจุบันได้)
2. ⏰ Time & Sessions
Session Ranges: กล่องแสดงช่วงเวลา Asia, London, และ New York พร้อมเส้นกึ่งกลาง (Mean Threshold)
Daily Levels: เส้นราคาสำคัญประจำวัน (Previous Day High/Low, True Day Open, New Day Open)
Clean Chart Mode: โหมดพิเศษแสดงผลเฉพาะสัปดาห์ปัจจุบัน ช่วยให้โหลดกราฟไวและไม่รกตาย้อนหลัง
3. 🧠 ICT Concepts & Macros
ICT Macro Tracker: ติดตามช่วงเวลา Macro สำคัญ (เช่น 02:50, 09:50) พร้อมเส้นราคาเปิดของช่วงเวลานั้นๆ
Quarterly Theory: เส้นแบ่งช่วงเวลา 90 นาที (Q1-Q4) และ Micro Cycles (23 นาที)
SMT Divergence: ตรวจจับความขัดแย้งของราคากับสินทรัพย์อ้างอิง (เช่น DXY)
4. 💎 Smart Money & Entry Models
Inversion FVG (IFVG): แสดง Fair Value Gaps ที่ถูกทำลายและเปลี่ยนหน้าที่เป็นแนวรับ/ต้าน (Credit: LuxAlgo logic)
CISD (Change in State of Delivery): ระบบแจ้งเตือนจุดกลับตัวเมื่อเกิดการกวาด Liquidity + FVG + Displacement ในช่วง Killzone
5. 🏆 Gold Special Features
Round Numbers: เส้นแนวรับแนวต้านจิตวิทยา (Psychological Levels) สำหรับทองคำ ปรับระยะห่างได้ (เช่น ทุกๆ $5 หรือ $10)
6. 🛠️ Quality of Life
Dashboard & Watermark: แสดงสถานะและชื่อระบบแบบมืออาชีพ
Customizable: ปรับสี เปิด/ปิด ฟีเจอร์ต่างๆ ได้ตามใจชอบผ่านเมนูตั้งค่า
⚠️ Disclaimer: เครื่องมือนี้มีไว้เพื่อช่วยในการวิเคราะห์ทางเทคนิคเท่านั้น ไม่ใช่คำแนะนำทางการเงิน การลงทุนมีความเสี่ยง ผู้ใช้งานควรศึกษาและบริหารความเสี่ยงด้วยตนเอง
-------------------------------------------------------------
Here is the English Version of the description, ready for you to copy and paste into TradingView! 😎
📝 V3S-GodMode Synced Strategy
Title: V3S-GodMode Synced Strategy
Description:
V3S-GodMode Synced Strategy is an All-in-One trading toolkit designed specifically for ICT / SMC (Smart Money Concepts) traders focusing on Gold (XAUUSD) and Futures markets. It consolidates the most critical Price Action and Time analysis tools into a single, comprehensive indicator, featuring a "Clean Chart Mode" to keep your workspace uncluttered and professional.
🚀 Key Features:
1. 🏛️ Market Structure & Trend
Trend Filter: Filters the primary market direction using a customizable EMA 200.
VWAP: Displays the Volume Weighted Average Price for intraday analysis.
Swing Detection: Automatically identifies Swing Highs and Swing Lows (Toggle available for historical or current data only).
2. ⏰ Time & Sessions
Session Ranges: Visual boxes for Asia, London, and New York sessions, complete with a Mean Threshold (50%) line.
Daily Levels: critical daily price levels, including Previous Day High/Low (PDH/PDL), True Day Open (TDO), and New Day Open (NDO).
Clean Chart Mode: A unique feature that displays data only for the current week, significantly improving chart loading speed and reducing visual noise from historical data.
3. 🧠 ICT Concepts & Macros
ICT Macro Tracker: Tracks essential Macro windows (e.g., 02:50, 09:50) and plots the opening price line for each specific macro period.
Quarterly Theory: Vertical dividers for 90-minute cycles (Q1-Q4) and Micro Cycles (23-minute intervals).
SMT Divergence: Detects divergences between the asset price and a reference asset (e.g., DXY) to spot potential reversals.
4. 💎 Smart Money & Entry Models
Inversion FVG (IFVG): Highlights Fair Value Gaps that have been invalidated and flipped their role to support or resistance (Credit to LuxAlgo logic).
CISD (Change in State of Delivery): An alert system identifying potential reversal points based on Liquidity Sweeps + FVG + Displacement occurring specifically within Killzones.
5. 🏆 Gold Special Features
Round Numbers: Automatic psychological support and resistance lines for Gold, with adjustable increments (e.g., every $5, $10, or custom values).
6. 🛠️ Quality of Life
Dashboard & Watermark: Displays the system status and indicator name with a professional look.
Fully Customizable: Toggle any feature on or off and customize colors to match your personal trading style via the settings menu.
⚠️ Disclaimer: This tool is intended for technical analysis assistance only and does not constitute financial advice. Trading involves significant risk. Users should conduct their own research and manage their risk accordingly. Gösterge

Gösterge
Gösterge
Multi-TF Candle CounterThis indicator counts candles starting from a specific date across up to 4 different timeframes at once. It's designed to help traders track market cycles and identify potential turning points using the Denizhan number sequence.
Key Features:
✅ Multi-Timeframe Support
Current chart timeframe
5-minute candles
15-minute candles
1-hour candles
✅ Smart Label Placement
Shows higher timeframe counts only on the first candle of that period
Example: On a 1-minute chart, the 5m counter only appears every 5 minutes
Prevents chart clutter while maintaining accuracy
✅ Number Sequence Highlighting
Automatically highlights special numbers: 1, 3, 7, 13, 21, 31, 43, 57, 73...
These numbers follow the pattern: n² - (n-1)
Special numbers appear in RED for easy identification
✅ Fully Customizable
Enable/disable each timeframe independently
Choose custom colors for each timeframe
Set label position (High, Low, Close, Open)
Single start/end date applies to all timeframes
Toggle special number highlighting on/off
How to Use:
Add to Chart: Apply the indicator to any chart
Set Date Range: Confirm the start and end dates (applies to all timeframes)
Enable Timeframes: Turn on the timeframes you want to track
Customize Colors: Set different colors for each timeframe to distinguish them
Watch for Red Numbers: Special Denizhan numbers appear in red as potential turning points
Use Cases:
Cycle Tracking: Monitor how many candles have passed since a significant event
Multi-Timeframe Analysis: See relationships between different timeframe counts
Pattern Recognition: Identify when multiple timeframes align at special numbers
Reversal Points: Watch for Denizhan numbers as potential support/resistance timing
Settings Overview:
Start Date (All TF)
End Date (All TF)
Each Timeframe Has:
Enable toggle
Text color
Label location
Special number highlighting
Note: This indicator works on any timeframe but is most effective on lower timeframes (1m, 5m, 15m) when tracking higher timeframe counts. Gösterge

Gösterge

Gösterge

[CT] Displacement FVG Toolkit Displacement FVG Toolkit is a complete ICT market-structure and execution toolkit designed to help you identify when price is truly repricing, where that repricing left inefficiencies, and how to frame trades with clear context, confirmation, and invalidation. The indicator brings together six institutional-grade concepts into one workflow, Displacement, Fair Value Gaps, Reload Zones, Dealing Range premium and discount, CISD, and Market Structure breaks, so you can stop reacting to random candles and start trading the sequence that professional order flow tends to follow, impulse, imbalance, retrace, and continuation or reversal.
The Displacement tool is the engine that decides whether a candle represents meaningful participation or ordinary noise. Displacement is measured by comparing the current candle’s size to the average candle size over a user-defined lookback. You can choose whether the script uses the candle body size or the full high-to-low range for this calculation. When the candle exceeds the average by your selected displacement factor, it is flagged as displacement. Displacement is important because it is the clearest visible clue that the market has moved from balanced auction to aggressive repricing, which is the environment where inefficiencies form and where your best retest trades are born. In the photo, the yellow bars represent the displacement bars, and the indicator prints Buy and Sell markers on those displacement events. The user also has full control to color displacement bars to a color of their choice, so whether you prefer bright yellow, muted gray, or any custom brand color, you can set the exact bullish and bearish displacement bar colors in the inputs. If you do not want bar coloring at all, you can simply turn off displacement bar coloring and use only the markers.
The Structure Filter is a powerful addition that prevents displacement from becoming “any big candle.” When enabled, the indicator requires the displacement candle to also break recent structure, meaning price must break above a recent high for bullish displacement or below a recent low for bearish displacement. You can decide whether the structure break is judged by a candle close beyond the prior structure level or by a wick that pierces it. Close-based structure breaks are cleaner and generally reduce false positives, while wick-based breaks are more sensitive and can trigger earlier at the cost of more noise. This filter matters because a large candle in the middle of chop is not the same as a large candle that actually breaks a meaningful swing point, and the indicator gives you a way to enforce that distinction mechanically.
The Fair Value Gap tool identifies the most valuable type of imbalance, the three-candle FVG, but it only plots those gaps when they are created by validated displacement. A bullish FVG forms when the current candle’s low is above the high from two candles ago, showing that price skipped a region without fully transacting through it. A bearish FVG forms when the current candle’s high is below the low from two candles ago. These gaps represent unfinished auction, a fast repricing that often leaves behind an inefficiency the market may later revisit to rebalance. You can choose to extend FVGs to the right for a set number of bars so you can see the levels well into the future, or you can keep them confined to the period when they formed. You can also choose whether mitigated FVGs remain visible or are hidden. Mitigation in this script means price has traded back into the gap far enough to invalidate it as an active inefficiency, and when that happens you can either keep it on the chart as historical context or remove it to keep your chart clean. The script also manages object limits by keeping only a user-defined maximum number of FVGs, trimming older ones as needed so the indicator remains stable.
Reload Zones are derived directly from the FVGs and are built for execution. Instead of treating the entire gap as the same, the indicator highlights the portion of the imbalance that most often functions as the highest-quality retest area for continuation entries. For bullish FVGs, the Reload Zone is drawn as the upper portion of the gap, and for bearish FVGs it is drawn as the lower portion, which keeps your focus on the retest region that is closest to the direction of repricing and typically provides tighter invalidation. The indicator also includes an optional Invalidation line that marks the far edge of the full FVG, giving you a clean and consistent “line in the sand” for risk management. The intended use is straightforward, you wait for displacement to print and create an FVG, you allow price to retrace into the Reload Zone, and you look for rejection behavior that confirms responsive participation, such as wicks into the zone that close back out, sharp reaction candles, or structure holding in the direction of the displacement. When price accepts inside the zone with multiple closes and slow grind, that’s often a sign the inefficiency is being repaired rather than defended, and the reload entry loses quality. Because reload zones are tied to displacement-generated FVGs, they naturally filter out weaker imbalances and focus you on the kind created during true repricing.
The Dealing Range tool provides context by defining a rolling high-to-low range over a user-defined lookback, then splitting that range into premium and discount. The indicator plots DR High, DR Low, and a DR Mid 50% line, and can optionally show PD 62% and PD 38% reference levels inside the range. The fill visually highlights premium above the midpoint and discount below it, which helps you avoid the most common retail mistake, buying in premium and selling in discount without a strong reason. The dealing range is not meant to be a rigid “support and resistance box.” It is meant to help you frame location. In general, long ideas have better location when price is in discount or reclaiming the midpoint with momentum, and short ideas have better location when price is in premium or rejecting the midpoint from below. This becomes especially powerful when combined with your other tools, because a bullish displacement and FVG that forms in discount and then holds the reload zone tends to have much better continuation odds than the same pattern forming at the very top of premium into overhead liquidity.
CISD in this indicator is your liquidity-sweep and directional-shift engine, designed to answer a very specific question, did price just take liquidity and then flip orderflow enough to justify a new directional bias. The script first maps swing liquidity using pivot highs and pivot lows over your selected swing period, then tracks when those levels are wicked or mitigated within an expiry window. When a swing high or swing low is taken, the CISD logic watches for the characteristic shift pattern that follows, and when it qualifies it prints a CISD level and establishes a trend state. The “Noise Filter” setting controls how strict the CISD trigger is, higher values reduce noise and produce fewer but more meaningful CISDs, while lower values produce more signals but may include weaker shifts. The indicator also distinguishes between a normal CISD and a stronger CISD that occurs after opposing liquidity was recently wicked within your liquidity lookback, and those stronger events are marked with the directional ▲/▼ symbols so you can immediately recognize when a sweep-and-shift sequence likely occurred instead of a random flip.
A key feature you asked for, and that this indicator includes, is that CISD levels can extend in a very controlled way so you can keep trading them without guessing where the level “ends.” The current timeframe CISD lines are drawn at the origin level and then the script can extend only the most recent X CISD lines out past the current bar by a user-defined number of bars, without creating gaps or redrawing incorrectly. This means your newest CISD levels remain visually “live” and tradable into the immediate future, while older CISDs automatically restore to their original endpoints and behave normally. This is important for execution because it keeps the focus on the levels that are most likely to matter now, while still preserving history without clutter.
The MTF CISD add-on is what gives you institutional alignment, because it allows a higher timeframe CISD to print onto your execution timeframe. The script computes CISD on the selected HTF using request.security and then draws HTF CISD lines on your chart in real time. You can choose “Confirmed HTF only,” which means the HTF CISD only prints when the higher timeframe candle closes, or you can turn confirmation off to see developing HTF CISDs while the HTF candle is still building. The HTF line style is configurable, and the HTF lines can extend to the right so they behave like real mapped levels. The HTF label is also supported and can be pinned to the right edge with an x-offset, so you always know which timeframe the CISD came from without having to guess. Optional HTF markers can print ▲/▼ on the bar where a new HTF CISD event is detected, which gives you a fast “regime shift” alert that pairs extremely well with your displacement and FVG tools.
CISD also includes a candle coloring option so you can visually trade the bias without constantly reading every label. You can keep candle coloring off, turn on an overlay candle layer using plot candle, or use bar color to recolor the native chart candles. The trend that drives candle color can be the current timeframe CISD trend or, if enabled, the HTF CISD trend so your execution timeframe candles reflect the higher timeframe shift. In the combined script, displacement bar coloring still has priority if you leave it enabled, meaning displacement bars will show your displacement color choice first, and the CISD candle coloring will apply where displacement is not overriding. That’s intentional, because displacement bars are “event bars,” while CISD coloring is “state,” and you want to see both without confusion.
In terms of how to use CISD with the rest of this indicator, the cleanest institutional workflow is to treat CISD as the directional context and trigger, and use displacement, FVG, and Reload Zones as the execution framework. A fresh HTF CISD is your “macro shift” that tells you which side is likely building control, then you wait for displacement on your execution timeframe that agrees with that bias and produces an FVG. The Reload Zone becomes your location for entry on the retrace, BOS/CHOCH tells you if structure is truly transitioning or continuing, and your invalidation stays anchored to the far edge of the FVG or the CISD level depending on which is tighter and more structurally meaningful. When CISD and displacement disagree, that’s usually a “stand down or reduce size” condition unless you’re explicitly trading a reversal, because it often means the market is still in rotation or repairing imbalance rather than trending cleanly.
The BOS and CHOCH tool is the structure confirmation layer. The indicator finds swing highs and swing lows using a pivot-based swing length and then plots structure lines at those pivots. Breaks are detected either by close or by wick, based on your setting. BOS, Break of Structure, signals continuation in the current structural regime, while CHOCH, Change of Character, signals a likely regime change. The indicator uses a simple internal state to differentiate BOS from CHOCH, so you can read structure shifts in real time rather than labeling everything as a generic “break.” You can display structure as lines, labels, or both. The lines extend until price breaks them, then they stop at the break so you can visually see exactly where the market transitioned. This module is especially useful for keeping you out of the trap of assuming a pullback is a reversal. If you see displacement and FVGs but no structural confirmation, you can reduce size or wait. If you see a CHOCH that aligns with a displacement shift and then price returns to a reload zone, you have a much higher quality reversal framework.
When you put these tools together, the intended trading workflow becomes a complete narrative. First you identify meaningful movement through displacement, and if you use the structure filter you ensure it is not just a large candle but a break in the auction. That displacement then creates an FVG, the inefficiency left behind by repricing. The Reload Zone marks the most tradable retest area of that inefficiency, and the invalidation line gives you a clear risk boundary. The Dealing Range tells you whether you are taking that setup from a favorable location, discount for longs or premium for shorts. BOS and CHOCH provide the final confirmation layer that tells you whether you are trading continuation or a genuine structural shift. This structure keeps you from chasing breakouts, because it naturally trains you to wait for the pullback into the reload zone and to only participate when price proves acceptance and rejection behavior at the level.
This indicator is built to be flexible. You can run it as a clean displacement plus imbalance tool by focusing on displacement, FVGs, and reload zones, or you can turn it into a full context-and-confirmation system by adding dealing range and BOS/CHOCH. If you want a high-signal, low-noise chart, keep the structure break requirement on, use close-based breaks, limit the number of active gaps, and hide mitigated gaps. If you want more sensitivity and earlier signals, use wick-based breaks and allow more gaps to remain visible. The goal is always the same, to help you see when the market is actually repricing, to mark the price areas where that repricing left unfinished business, and to give you a consistent way to execute retests with defined risk and clear structural context. Gösterge

Sakalau02 Weekly Daily SessionsSakalau02: Weekly Daily Sessions – The Architecture of the Trading Week
The "Sakalau02 Weekly Daily Sessions" is a high-definition visual mapping tool designed to dissect the trading week into distinct daily blocks. More than just a period separator, this script defines the "field of play" for each day, allowing you to visualize where liquidity builds and how price interacts with temporal boundaries.
Here is why this script is the cornerstone of a professional Top-Down analysis:
📅 High-Definition Daily Structure
The indicator transforms your chart into a logical map of the week, providing visual support for all 7 days, with a focus on active trading from Monday to Friday.
Visual Identity: Each day is assigned its own unique color, helping you instantly recognize repetitive market signatures (like the "Tuesday Reversal" or "Mid-week Expansion").
Timezone Precision: Featuring a dedicated Timezone Input, the script ensures that daily boxes open exactly at 00:00 according to your chosen financial hub (UTC, New York, London, etc.).
📐 Range and Liquidity Analysis
Through its Dynamic Box System, the script monitors price evolution in real-time:
High/Low Tracking: Automatically expands the box boundaries as price carves out new daily highs or lows.
The 0.5 Level (Daily Equilibrium): Automatically calculates the midpoint of the entire day. This is the critical "Fair Value" zone where price decides whether to trend or mean-revert.
Open/Close Trajectory: A discreet line tracks price relative to the daily open, providing an instant read on the intraday bias (Bullish/Bearish).
⚡ Precision Alert System
Never miss a structural shift. The indicator comes equipped with built-in alerts for:
Session Starts: Be notified the moment a new daily cycle begins.
Liquidity Sweeps (New High/Low): Receive alerts the second price breaches the current day’s high or low—perfect for executing Judas Swings or Expansion setups.
💎 Versatile Display Modes
Boxes Mode: Encapsulates price for a clear view of market structure.
Zones Mode: Highlights the background for a cleaner integration with secondary indicators.
Timeline Mode: Marks the base of the chart, keeping the price action area completely untouched.
Piața nu este doar preț, este ritm. În timp ce alții se pierd în zgomotul fiecărei secunde, eu definesc limitele zilei. O structură creată pentru traderul care știe că volumul urmează timpul, iar profitul urmează disciplina — păstrați ochii pe echilibrul zilei!" — Semnat, Andrei (Sakalau02) ⏳ Gösterge

[CT] MTF CISD w/ExtensionsThis indicator is a modified version of “Change in State of Delivery CISD” originally created by © AlgoAlpha and released under the Mozilla Public License 2.0. The core CISD logic, including how the script identifies qualifying bullish and bearish state changes and how it draws the original CISD levels, comes from AlgoAlpha’s work. The version you are using has been modified by © ChaosTrader63 to add multi time frame CISD functionality, optional HTF labeling and styling controls, and a configurable method to extend a user selected number of the most recent current time frame CISD levels beyond the last candle.
At its core, CISD is designed to identify moments when price behavior suggests a meaningful shift in control, where one side of the market has effectively “taken delivery” and the prior state has changed. The script watches price swings, then tracks specific candle state transitions that can act like triggers. When the conditions are met, it prints a CISD level as a horizontal line originating from the candle that defined the trigger and extending to the detection candle, creating a clear reference level that can behave like a decision point for future price interaction. In practice, those levels often act as areas where price may react, reject, or accept, because they represent the point where a meaningful state change was confirmed by price behavior rather than by a simple moving average or lagging trend filter.
The indicator also includes swing based liquidity tracking to provide context around potential liquidity events. It detects swing highs and swing lows using a pivot period you control, then maintains those swing levels as “liquidity lines” until they are either mitigated or expire after a set number of bars. When price wicks into one of those swing liquidity levels and confirms the mitigation, the script records that event. If a CISD trigger happens shortly after, and the new state change occurs with evidence that opposing liquidity was just taken, the script flags that as a stronger event by marking it on the chart. This is meant to separate normal CISD signals from those that occur after a sweep, because a sweep plus a decisive state change is often more meaningful than a state change that happens in the middle of noise.
The user controls in the calculations section determine how sensitive or selective the CISD detection is. The noise filter controls how strict the script is about qualifying the internal structure that leads to a CISD event. Higher values reduce noise and typically produce fewer, more selective CISD levels, while lower values will produce more frequent levels that may be less reliable in choppy conditions. The swing period controls how far back the script looks when identifying pivot highs and lows, which changes how “major” a swing must be to count as liquidity. The expiry bars setting controls how long older liquidity levels remain active before they stop updating or are removed, and the liquidity lookback determines how recently a swing mitigation must have occurred for the script to treat the CISD as happening with a sweep.
Visually, the script colors candles based on the current CISD trend state. When a bearish CISD is detected, the trend state flips bearish and candles are shaded using the bearish color with a user controlled transparency blend, and when a bullish CISD is detected the trend state flips bullish and candles are shaded using the bullish color. This makes the tool useful not only for marking levels, but also for keeping a simple “state” view on the chart so you can see when the indicator believes control has shifted. If you enable the option to use HTF trend for candle coloring, then the candle shading can reflect the higher time frame trend state instead of the local chart state, which is helpful when you want to trade a lower time frame while staying aligned with the higher time frame CISD bias.
The modifications add a higher time frame CISD layer so you can see more significant CISD levels from a chosen HTF while trading on a lower time frame chart. When enabled, the script computes CISD on the higher time frame through a request security call and then draws HTF CISD lines onto your current chart. You can require confirmed HTF signals only, which means the HTF CISD will print only after the HTF candle closes, reducing repaint style behavior and preventing the level from appearing and disappearing mid-candle. The HTF CISD lines keep the original bullish and bearish color scheme, and you can choose whether they render as solid or dashed to visually separate HTF structure from current time frame structure. The script can also place a label on the HTF CISD level, showing the selected HTF, for example “15 min HTF CISD,” and you can control the label background color, text color, size, and a horizontal offset so the label sits to the right of the current price rather than directly on top of the level.
The other key modification is the extension system for the current time frame CISD levels. The original script draws CISD levels from the origin candle to the detection candle, which is the “normal” behavior and is still preserved for all CISD levels. The enhancement allows you to choose how many of the most recent current time frame CISD levels you want to extend past the last candle by a defined number of bars. This is designed for traders who want their freshest decision levels projected into the future so they can be used as immediate references for reaction, acceptance, rejection, entries, or targets, without cluttering the chart by extending every single historical level. Because the extension uses the original line and simply moves the line’s end point to bar index plus your offset, it extends cleanly from the true starting point with no visual gap, and it automatically updates as new bars print. When a level is no longer within the most recent group, the script restores the original endpoint so older CISD lines revert back to normal and do not continue extending.
To use the indicator effectively, start by choosing whether you want it to be a current time frame decision tool, a higher time frame structure tool, or both. If you are trading lower time frames, enabling HTF CISD with confirmed only is usually the cleanest way to stay aligned with the dominant structure while avoiding levels that shift during an unclosed HTF candle. Then tune the swing period and noise filter to your market. If you are seeing too many levels in chop, increase the noise filter and consider a longer swing period so only larger structural transitions qualify. If you are missing important shifts, reduce the noise filter slightly so the script becomes more responsive. For execution, treat CISD levels like state change reference prices. When price returns to a bullish CISD level, look for acceptance above it to confirm continuation or rejection below it to warn of failure, and do the inverse for bearish levels. The liquidity sweep markers are especially useful as a context filter, because a CISD that occurs after a sweep often represents a more forceful transition where one side grabbed liquidity and then reversed state, which can create cleaner follow-through or stronger reaction zones.
Overall, this modified version keeps AlgoAlpha’s original CISD and liquidity framework intact, but adds the two things traders typically need when using a state change concept in live execution: the ability to overlay higher time frame CISD structure on a lower time frame chart, and the ability to project only the most relevant recent CISD levels into future bars so the levels are immediately actionable without turning the chart into a wall of extended lines. Gösterge

Sakalau02 10 sessionsMarket Sessions: The Institutional Chronological Compass
The "Market Sessions - By Sakalau" indicator is a high-precision visualization tool designed to map the temporal structure of financial markets directly onto your chart. It acts as a chronological guide, helping traders identify volatility cycles and the institutional "changing of the guard" across global financial hubs.
Here is why this script is essential for your strategy:
🌐 Extensive Global Coverage
Unlike standard indicators that only track the "Big Three" (London, New York, Tokyo), this script by Sakalau supports up to 10 fully customizable sessions. This allows you to track specific liquidity pockets, such as the Frankfurt open, Hong Kong, or Mumbai.
📊 Visualizing Market Phases
The indicator uses a Box-based visual system to encapsulate price action within specific timeframes. This makes it easy to identify:
Accumulation Phases: Typically seen during low-volume sessions (Sydney/Asia) where price moves sideways in a tight range.
Expansion/Trend Phases: Identified when a new session (London/NY) breaks out of the previous session’s high or low.
Distribution/Reversals: Indicated when price reaches the boundaries of a session box and fails to sustain the move.
🧠 Advanced Technical Insights
The script does more than draw shapes; it extracts crucial data for execution:
Open/Close Lines: Highlights the session's starting price versus its current trajectory at a glance.
0.5 Median Level (Equilibrium): Automatically plots the midpoint of each session's range. In institutional trading, this is considered "Fair Value"—a magnet for price and a major support/resistance area.
Performance Management: The Lookback feature ensures your chart remains fast and responsive by limiting processing to a set number of days.
🎨 Customization & Clarity
Display Modes: Choose between Boxes, Zones (background highlights), or Timeline views.
Aesthetics: Total control over colors, opacity, and line styles (solid, dashed, dotted) for a premium visual experience.
P.S
Alții caută confirmări, eu desenez zonele ✍️. O unealtă creată pentru cei care înțeleg că în trading, CÂND tranzacționezi este la fel de important ca CE tranzacționezi — nu uitați să verificați 0.5-ul! — Semnat, Andrei (Sakalau02)🧭🎯⌛💎 Gösterge

Sakalau02 - 10 SessionsThis Pine Script indicator, "Market Sessions - 10 Sessions", is a professional-grade visualization tool designed to map the temporal structure of the financial markets directly onto your chart. It acts as a "chronological compass," helping traders identify volatility cycles and the institutional "changing of the guard" across global financial hubs.
Here is a breakdown of its core features and why it is ideal for highlighting market phases:
## Comprehensive Global Coverage
While most indicators only track the "Big Three" (London, New York, Tokyo), this script provides support for up to 10 customizable sessions.
Standard Sessions: Tokyo, London, New York, and Sydney.
Extended Hubs: Includes Frankfurt, Hong Kong, Singapore, Shanghai, Toronto, and Mumbai.
Why it matters: This allows you to track specific liquidity pockets, such as the Frankfurt open (which often front-runs London) or the crucial Asian-Pacific overlaps.
## Visualizing Market Phases
The indicator uses a Box-based visual system to encapsulate price action within specific timeframes. This helps in identifying:
Accumulation Phases: Typically seen during lower-volume sessions (like late Sydney or early Tokyo) where price moves sideways in a tight box.
Expansion/Trend Phases: Easily identified when a new session (like London or NY) breaks out of the previous session’s high or low.
Distribution/Reversals: Indicated when price reaches the upper or lower boundaries of a session box and fails to sustain the move.
## Key Technical Insights
The script doesn't just draw boxes; it provides "internal" session data to refine your entries:
Open/Close Lines: Highlights the session's starting price versus its current trajectory, helping you see if a session is "bullish" or "bearish" at a glance.
0.5 Median Level: Automatically plots the mid-point (50% level) of each session's range, which often acts as a significant "fair value" support or resistance area.
Pips & Percentage Tracking: Built-in hooks to calculate the volatility (range) of each session.
## Advanced Customization & Cleanliness
Overlap Management: Includes a "Merge Overlaps" feature to keep the chart clean during periods where multiple major markets are open simultaneously.
Lookback Control: To prevent chart lag, you can limit the history (e.g., last 150 days), ensuring the script runs smoothly even on lower timeframes.
Multi-Display Modes: Choose between Boxes, Zones (background highlights), or Timeline views depending on your preference for price action clarity.
## Summary for Trading Strategy
This indicator is perfect for Power of 3 (PO3) or ICT-style traders who rely on "Time and Price." By highlighting exactly when New York opens relative to London, or where the "London Lunch" stagnation occurs, it helps you avoid "choppy" low-liquidity periods and focus on high-probability volatility windows.
Alții caută confirmări, eu desenez zonele. ✍️ Sakalau02: Semnat, Andrei. (Nu uitați să verificați 0.5-ul!) Gösterge