Volume Profile Sniper ► Overview
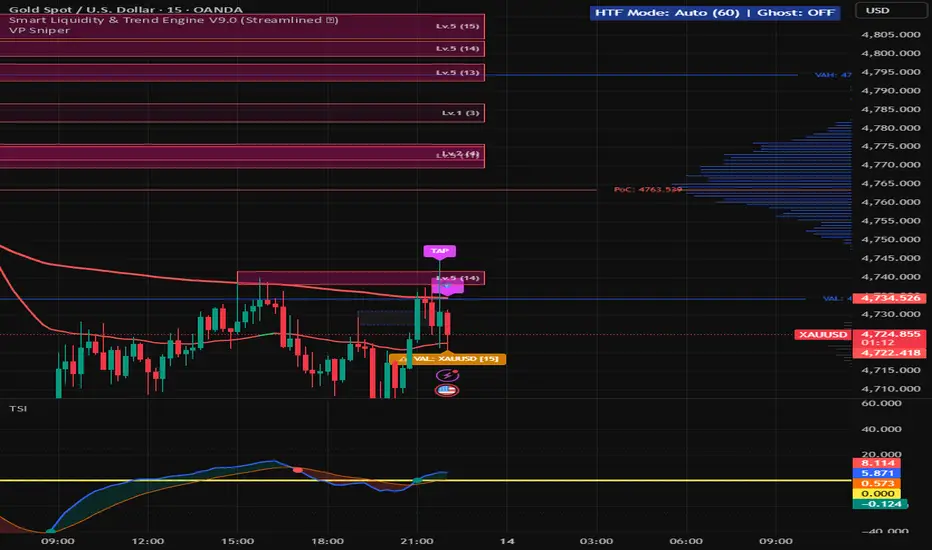
The Volume Profile is a staple tool for order flow and support/resistance traders, but manually monitoring price action around key volume nodes can be tedious. The Volume Profile Sniper (VP Sniper) is designed to bridge the gap between passive level-drawing and active execution. It calculates a dynamic Volume Profile and introduces a unique Proximity Radar System that alerts you exactly when the price enters a micro-zone around key liquidity levels.
► What Makes This Script Original?
Standard Volume Profile indicators simply draw lines on the chart. Traders often miss entries because the price misses the exact line by a few ticks.
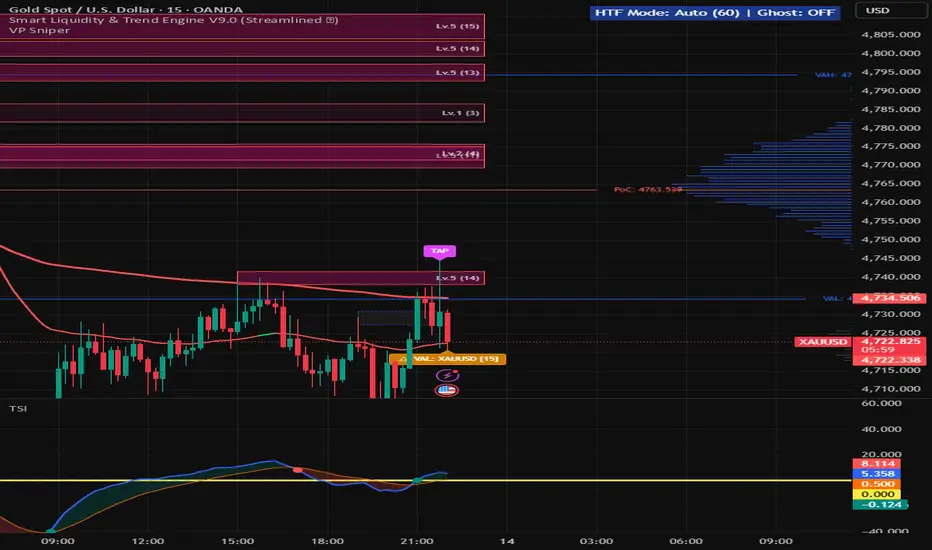
The originality of the VP Sniper lies in its Proximity Tolerance (%) logic. Instead of requiring a strict, exact price cross, the script builds an invisible percentage-based "kill zone" (tolerance band) around the Point of Control (PoC), Value Area High (VAH), and Value Area Low (VAL). When the price enters this specific percentage buffer, the script proactively prints visual "Sniper" tags on the chart (⚠️ VAL, ⚠️ VAH, 🎯 PoC) and fires alerts. This proactive approach allows traders to prepare for an entry before or as the level is tested, rather than after the fact.
► How It Works (Underlying Concepts)
Volume Binning: The script scans historical bars based on either a fixed lookback depth or the visible chart range. It determines the highest and lowest prices within that window and divides the range into user-defined price rows (bins). It then distributes the volume into these bins. You can choose to calculate 'Both' volumes, or isolate 'Bullish' / 'Bearish' volumes to see where buyers or sellers dominated.
Value Area Calculation: The script first identifies the Point of Control (PoC) – the price bin with the highest volume. To calculate the Value Area (VA), it uses an iterative outward expansion algorithm. It starts at the PoC and compares the volume of the bins immediately above and below it, adding the larger volume to a running total until it captures the target percentage of the total volume (default is 68%, representing one standard deviation in a normal distribution).
Radar Alert Logic: For the sniper alerts, the script calculates dynamic upper and lower boundaries: Upper Bound = Level * (1 + Tolerance %) and Lower Bound = Level * (1 - Tolerance %). If the current bar's high or low penetrates this specific math band, the alert is triggered.
► How to Use It in Trading
Reversion Trades (Fading the Edges): In a ranging market, the Value Area represents fair value. Traders can use the Radar alerts at VAH (Value Area High) to look for short opportunities (price is overvalued) and VAL (Value Area Low) for long opportunities (price is undervalued). The proximity alert ensures you catch the wick rejections.
Breakout & Retest: If price breaks strongly out of the Value Area, traders can wait for the Radar to alert them on a pullback retest of the VAH or VAL from the outside, turning former resistance into support (or vice versa).
The PoC Magnet: The PoC acts as a center of gravity. If you are in a trade from the VAL or VAH, the PoC alert serves as an excellent dynamic Take-Profit (TP) zone, as price naturally gravitates back to high-volume nodes.
► Key Settings
Lookback & Bins: Choose between Fixed lookback depth or Visible Range. Adjust the number of volume bars (bins) for higher or lower resolution.
Volume Type: Filter the profile by Bullish, Bearish, or Total volume.
Sniper Entry Settings: Enable/disable the radar. Tweak the Proximity Tolerance (%) (e.g., 0.1% or 0.05%) based on the volatility of the asset you are trading. Lower timeframes or less volatile assets require a tighter tolerance.
(Disclaimer: This script is for educational and analytical purposes only. Past performance does not guarantee future results. Always use proper risk management.) Gösterge

Smart Liquidity & Trend Engine V9.0Overview
The Smart Liquidity & Trend Engine is a systematic trading tool designed to dynamically identify high-probability reversal and continuation zones. Instead of relying on static support/resistance levels or traditional pivot points, this script utilizes a custom Weighted Multi-Timeframe Fractal Clustering Algorithm combined with momentum-based execution triggers. It is explicitly engineered for day traders and scalpers (particularly on XAUUSD and Forex pairs) who look for institutional liquidity sweeps followed by strong directional displacement.
► Originality & Core Concepts (How it works under the hood)
Most standard Support/Resistance indicators plot lines at every single pivot, creating chart clutter. This script solves that through a mathematical clustering approach:
Weighted Fractal Engine: The script simultaneously scans for fractals on the current Timeframe (LTF, weight = 1) and a Higher Timeframe (HTF, weight = 3).
ATR-Based Clustering: When multiple fractals form within a predefined price proximity (calculated using an ATR Multiplier), they are merged into a single "Liquidity Zone".
Strength Scoring (Lv.1 to Lv.5): As more fractals cluster into the same ATR threshold, the zone's score increases. A minimum score (default: 3) is required to validate a zone. An HTF fractal (3 pts) instantly creates a valid zone, while it takes three independent LTF fractals (1+1+1) to validate the same area.
Invalidation (Ghost Zones): Support/Resistance is not permanent. Once a candle physically closes beyond the upper/lower bounds of a Liquidity Zone, the zone is immediately invalidated, marked as a "Ghost," and stops participating in future signal calculations.
► Signal Execution Logic (How signals are generated)
This script does not print signals simply because the price touches a zone. It requires a sequence of events:
The "TAP" Signal (Preparation): Occurs when the price wicks into or touches a valid Liquidity Zone but respects the boundary. This indicates a potential liquidity grab or mitigation.
The "Diamond 💎" Signal (Execution): This is the ultimate entry trigger. It only prints when ALL the following conditions are met simultaneously:
Proximity: The price must be near an active Liquidity Zone (filtered by maximum ATR distance to prevent chasing late entries).
Momentum Confirmation: There must be a valid price action event—either a strong directional displacement (where the candle body is strictly greater than ATR * Displacement Multiplier) OR a valid Engulfing pattern.
Trend Alignment (Binary EMA): The signal must align with the macro trend. The trend is NOT determined by EMA crossovers, but strictly by the Slope (ta.rising/ta.falling) of the Slow EMA (default 200).
V-Reversal Override (Counter-Trend Exception): If the price drops into an incredibly strong historical zone (e.g., Strength >= 6 / Lv.4), the script allows a counter-trend Diamond signal to print, capturing aggressive V-shaped bottoms/tops at major HTF levels.
► How to Use It
Timeframe Selection: The script works beautifully on lower timeframes (e.g., M5, M15). By default, the HTF parameter is set to Manual (60 mins), meaning your M5 chart will automatically weigh H1 pivot levels heavily. You can also toggle "Auto HTF" to let the script maintain a dynamic 4x-12x timeframe multiplier.
Trade Execution:
Wait for a price approach towards a deeply colored box (Lv.3 to Lv.5).
Look for a TAP label to confirm the zone is being tested.
Do NOT enter immediately. Wait for the 💎 Diamond shape to appear, which confirms that momentum has stepped in (Displacement/Engulfing) to push the price away from the liquidity zone.
Set your Stop Loss just outside the tested Liquidity Zone or Ghost Zone.
Session Filtering: For optimal volatility, utilize the built-in Session Filter (e.g., New York session) to only receive alerts during high-volume hours.
(Disclaimer: This script is for educational and analytical purposes only. Past performance does not guarantee future results. Always use proper risk management.) Gösterge

Gösterge

Gösterge
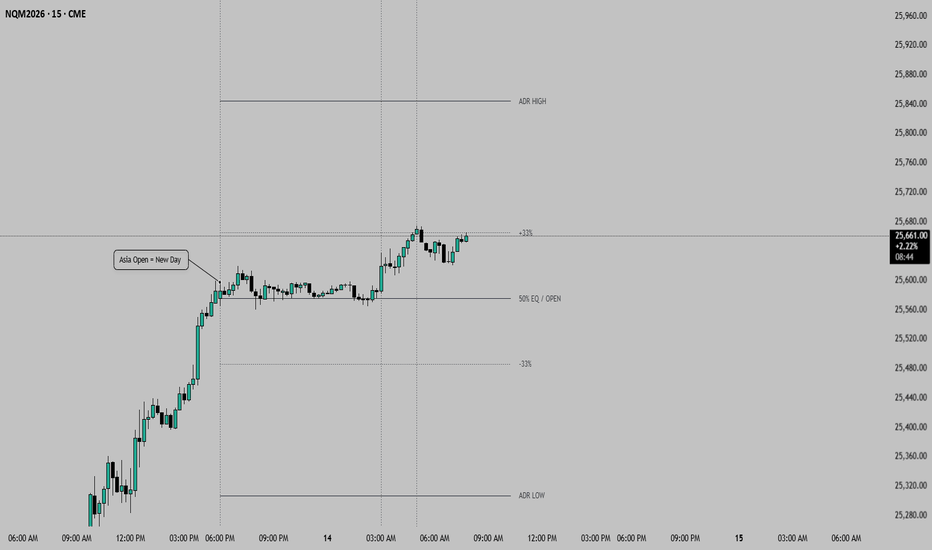
Average Session RangeAverage Session Range
This indicator calculates and displays the average true range of the three major trading sessions (Tokyo, London, and New York) over a user-defined number of past sessions. It also shows the current session's range in real-time, helping traders quickly assess volatility expectations for the active session.
Key Features:
Three Major Sessions: Automatically detects and tracks Tokyo, London, and New York sessions
Flexible Session Handling: Choose between UTC (Auto DST) mode for accuracy across daylight saving changes, or Manual (AEST) mode with customizable session times
Multiple Display Modes:
Dollar ($) – Shows monetary value based on pointvalue (great for futures & CFDs)
Points – Raw price range
Pips – Converted to pips (ideal for forex)
Lookback Period: Average calculated over the last 1–20 sessions (user adjustable)
Clean Table Display: Elegant table in the bottom-right corner showing:
Current active session
Current session range (live updating)
Average range for the current session type
Why It's Useful:
Quickly see if the current session is expanding or contracting relative to its historical average
Better session-based volatility awareness
Ideal for day traders, scalpers, and breakout traders who trade around session opens and ranges
Particularly helpful on indices, forex majors, and futures contracts
Customization Options:
Number of sessions to average (1–20)
Display unit ($, Points, or Pips)
Session mode (UTC Auto DST or Manual AEST)
Full color customization for the table (header and values)
Perfect for traders who want a simple, at-a-glance view of how much movement to expect during each major trading session. Gösterge

Gösterge

Gösterge

Auction Intelligence█ AUCTION INTELLIGENCE
Auction Market Theory Overlay
An Auction Market Theory (AMT) overlay that analyzes market structure through volume profile analysis. It detects profile shape (D/P/b/DD), identifies balance vs. imbalance states, and tracks value migration — giving you the same auction-based framework used by institutional traders to understand market behavior.
Free and Open Source.
█ THE CONCEPT: WHY AUCTION MARKET THEORY MATTERS
Standard indicators tell you what happened. AMT tells you why . Markets are continuous two-sided auctions where buyers and sellers negotiate fair value:
Balance — Price rotates within an accepted value area. Expect mean-reversion and range-bound trading.
Imbalance — Price breaks away from the value area. One side dominates. Expect continuation.
Profile Shape — The distribution of volume tells you who is in control and what to expect next.
Value Migration — The direction where the POC and Value Area are shifting reveals the underlying trend.
█ CORE FEATURES
1. Volume Profile Engine
Distributes each bar's volume proportionally across price rows, building a volume-at-price distribution:
POC (Point of Control) — Highest volume row = strongest S/R level
VAH (Value Area High) — Upper boundary of the 70% value area = resistance
VAL (Value Area Low) — Lower boundary of the 70% value area = support
2. Profile Shape Detection
Automatically classifies the volume distribution into four distinct shapes:
D-shape — Balanced. Volume evenly distributed, POC near center. Expect rotation.
P-shape — Bullish. Volume concentrated in upper half. Buyers in control.
b-shape — Bearish. Volume concentrated in lower half. Sellers in control.
DD (Double Distribution) — Two distinct volume clusters. Market transitioning between value areas.
3. Balance vs. Imbalance Recognition
Three-factor analysis combining price position, VA width dynamics, and trend strength. The chart background colors automatically when imbalance is detected (cyan = bullish discovery, red = bearish discovery).
4. Value Migration Tracker
Monitors how the POC and Value Area midpoint shift over time:
Bullish Migration ▲ — POC and VA migrating higher = institutional buying
Bearish Migration ▼ — POC and VA migrating lower = institutional selling
Neutral ─ — No significant migration = consolidation
█ AUTO-TIMEFRAME ADAPTATION
All parameters automatically adjust based on the chart timeframe:
1-5 min → Lookback 30, 18 Rows, Migration Len 5
15-30 min → Lookback 40, 20 Rows, Migration Len 8
1 Hour → Lookback 50, 24 Rows, Migration Len 10
4 Hour → Lookback 70, 28 Rows, Migration Len 15
Daily → Lookback 100, 32 Rows, Migration Len 20
Weekly+ → Lookback 150, 40 Rows, Migration Len 30
Disable Auto-TF to use manual settings for full control.
█ DASHBOARD
A compact, dark-themed info panel displaying:
State — Current AMT state (BALANCE / IMBALANCE) with context
Shape — Detected profile shape (D / P / b / DD) with description
Migration — Value migration direction and strength
Position — Current price position relative to Value Area
POC / VAH / VAL — Key volume-based levels
█ ALERTS (4 CONDITIONS)
Balance → Imbalance — Market leaving the value area
Imbalance → Balance — Market returning to the value area
Profile Shape Changed — Volume distribution pattern shift
Value Migration Shift — Directional bias change in POC/VA migration
█ PRO VERSION
The PRO version (Auction Intelligence PRO v2.0) adds:
Initial Balance Range — IB Tracking + IB Extension Detection
Failed Auction Detection — VA Breakout Failures
Excess & Poor High/Low — Wick analysis at session extremes
Auction Rotation Factor — POC-cross frequency as market efficiency measure
Day Type Classification — Trend/Normal/Normal Var./Neutral/Double Dist. (Dalton)
Previous Day Value Area — PDPOC/PDVAH/PDVAL as reference levels
Enhanced Confluence Score — 0-12 scale with A+ to D grading
13 Alert Conditions
█ NON-REPAINTING
The volume profile is calculated from confirmed bar data only. The rolling lookback window recalculates on each confirmed bar using historical high/low/volume — no future data is used. No repainting.
█ WORKS ON
Crypto, Forex, Stocks, Futures, Indices — any timeframe from 1 minute to Monthly.
█ DISCLAIMER
This indicator is for educational and informational purposes only. It does not constitute financial advice. Always do your own research and manage your risk. Past performance does not guarantee future results. Trading involves substantial risk of loss.
Gösterge

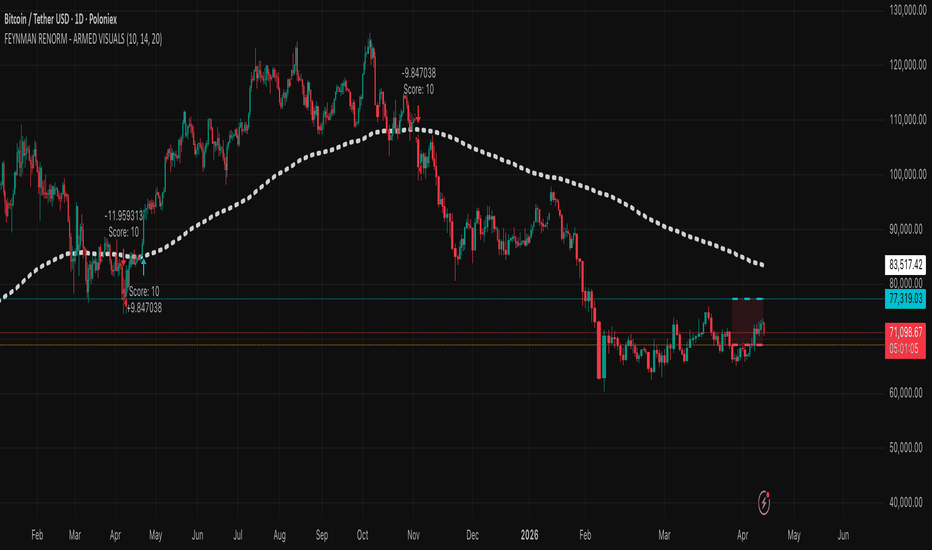
Feynman Renormalization: Armed Confluence & Risk Framework [Aht]The Philosophy
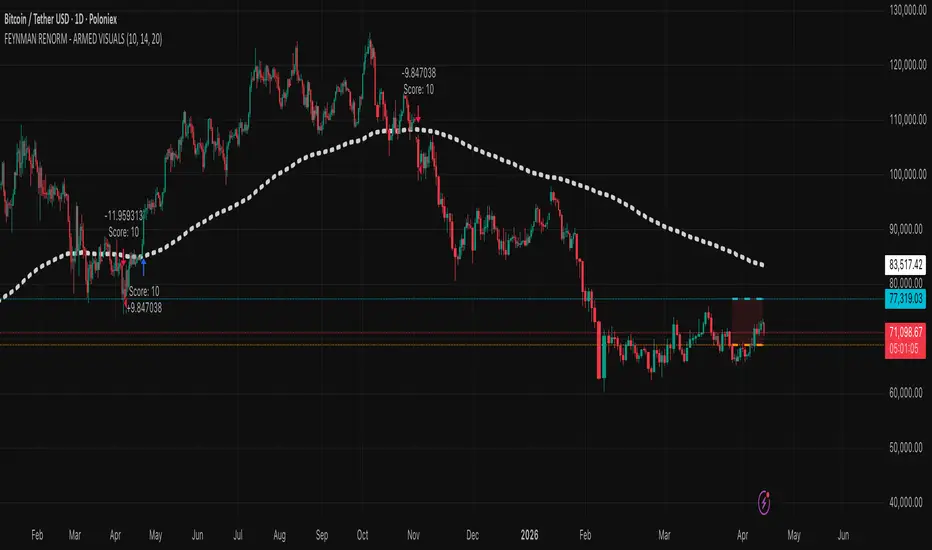
This strategy is built on the principle of Price Renormalization. In high-leverage markets (like XAU/USD), price rarely moves in a straight line; it oscillates between energy states. This script identifies when the "Energy" (Trend + Volume + Momentum) has reached a critical threshold—an Armed State—before committing capital.
Core Mechanics
The system operates on a 16-point proprietary scoring engine that filters for high-probability institutional order flow:
Macro Energy (EMA 200): Ensures alignment with the primary institutional trend.
Volume Weighting: Confirms that price movement is backed by real participation, not just retail noise.
Confluence Scoring: An "Armed" status is only triggered when the Min Score (Default: 10) is met across four technical dimensions.
Dynamic Renormalization Levels: Uses ATR-based stop-entry levels to ensure we only enter when price breaks out of the "Noise Box."
Visual Intelligence
The script features a dynamic Visual Risk Box:
Aqua/Orange Axis: Real-time tracking of the Renorm levels.
Bold White Transition: The borders turn bold white the moment the system is ARMED, providing an immediate visual cue for the user to prep for execution.
Visual Intelligence
The script features a dynamic Visual Risk Box:
Aqua/Orange Axis: Real-time tracking of the Renorm levels.
Bold White Transition: The borders turn bold white the moment the system is ARMED, providing an immediate visual cue for the user to prep for execution.
Technical Specifications
Strategy Type: Trend-Following / Breakout.
Instruments: Optimized for XAU/USD, BTC/USD, and Major Forex pairs.
Timeframe: Recommended 15m or 1H for optimal confluence.
Execution: Orders are processed on the close of the confirming bar to prevent "repainting" or false triggers.
How to Use
Monitor the Label: The top-right label will switch from "Scanning" to "🔥 ARMED" when confluence is high.
The Risk Box: Watch the aqua and orange borders. When they turn Bold White, the strategy is actively placing stop-orders.
Adjust the Sensitivity: Increase the Min Score (default 10) for more conservative, high-quality signals, or decrease it for more frequent "scalp" opportunities.
Disclaimer
This is a quantitative strategy for educational and research purposes. Given the leverage potential in financial markets, always use a disciplined risk management approach.
Instructions for You (PineScript Check)
Version: I've confirmed this uses //@version=6. Ensure your TradingView editor is set to V6 (the latest standard).
Performance: I included process_orders_on_close=true. This ensures your backtest results are realistic and not inflated by intra-bar "cheating."
Visuals: The white border transition is the "hook" that makes this look like a premium institutional tool. Strateji
Market Environment Analyzer■ Overview
This indicator acts as your personal market analyst, automatically outputting a comprehensive "market environment" report directly on your chart. Instead of a simple scoring system, it uses a meticulously constructed logic tree to understand the market's "context," providing objective and contradiction-free analysis just like a professional trader would in their mind.
■ The Core Feature: The "Subtraction" Logic
To solve common indicator flaws—like MACD fakeouts in ranging markets or oscillator traps (staying overbought/oversold) during strong trends—this system features the ability to intentionally ignore unnecessary indicators depending on the context.
Hyper-Trend Restriction: When ADX exceeds 40 (anomalous trend), the system deems oscillators (RSI/Stoch) as "paralyzed" and warns against dangerous counter-trend signals.
Dead Range Exclusion: When ADX drops below 20 (dead volatility), MACD crossovers are flagged as "noise/fakeouts," and their internal logic evaluation is skipped.
■ 5 Blocks of Analysis
Spatial Analysis: Evaluates macro trends and current phases (pullbacks, ranges, etc.) based on Moving Averages (20/50/200) alignment (Perfect Order) and price positioning.
Volatility & Momentum: Measures market heat using ATR and trend propulsion via ADX.
Internal Logic: Analyzes vector synchronization between MACD and DMI, including high-resolution momentum acceleration/deceleration via MACD histograms.
Local Stress: Combines RSI, Stochastics, and Bollinger Bands (±2σ, ±3σ) to calculate local overbought/oversold conditions and support/resistance.
Final Verdict: Synthesizes the macro context and local stress to provide optimal strategies like "Buy the Dip," "Avoid Chasing," or "Stand Aside."
--------
■ Overview (UK English)
This indicator serves as your bespoke market strategist, automatically generating a comprehensive "market environment" brief directly onto your chart. Rather than relying on a rudimentary scoring system, it utilises a meticulously constructed logic tree to interpret the market's "context," delivering objective and contradiction-free analysis akin to the mindset of an institutional trader in the City.
■ The Core Feature: The Philosophy of "Subtraction"
To resolve common indicator flaws—such as MACD whipsaws in ranging markets or oscillator traps during fierce trends—this system is equipped to intentionally disregard redundant indicators based on the prevailing context.
Hyper-Trend Restriction: When ADX exceeds 40 (runaway trend), the system deems oscillators (RSI/Stoch) "paralysed" and explicitly warns against perilous counter-trend operations.
Dead Range Exclusion: When ADX falls below 20 (stagnant volatility), MACD crossovers are identified as "noise," and their internal vector analysis is entirely skipped.
■ 5 Blocks of Analysis
Spatial Analysis: Evaluates macro trends and current phases (retracements, consolidations) based on Moving Averages (20/50/200) alignment and price structure.
Volatility & Momentum: Measures market heat using ATR and trend propulsion via ADX.
Internal Logic: Analyses vector synchronisation between MACD and DMI, detailing momentum acceleration or deceleration via MACD histograms.
Local Stress: Synthesises RSI, Stochastics, and Bollinger Bands (±2σ, ±3σ) to gauge local overheating and key support/resistance zones.
Final Verdict: Combines the macro context with local stress to deliver actionable intelligence such as "Buy the Dip," "Do Not Chase," or "Stand Aside."
--------
■ 概要 (Japanese)
このインジケーターは、現在の相場環境を複数のテクニカル指標から総合的に読み解き、プロのトレーダーが頭の中で行っている「環境認識」をテキストレポートとしてチャート上に自動出力するシステムです。単なる点数制ではなく、緻密に構築された論理ツリーにより相場の「文脈(コンテキスト)」を理解し、矛盾のない客観的な分析結果を提示します。
■ 最大の特徴:「プロの引き算」ロジック
多くのインジケーターが抱える「レンジ相場でのMACDのダマシ」や「強いトレンド相場でのオシレーターの張り付き(逆張りの罠)」を解決するため、本システムは状況に応じて**【不要な指標をあえて無視する】**機能を搭載しています。
ハイパートレンド時の機能制限: ADXが40を超える異常なトレンド相場では、オシレーター(RSI/Stoch)の買われすぎ・売られすぎ判定を「機能不全(張り付き)」とみなし、危険な逆張りシグナルを警告・遮断します。
デッドレンジ時の評価除外: ADXが20を下回るボラティリティの死んだ相場では、MACD等の追従指標によるクロスを「ノイズ(ダマシ)」と判定し、内部ロジックの評価をスキップします。
■ 5つの解析ブロック
空間認識: 移動平均線(20/50/200)の並び(パーフェクトオーダー等)と価格の位置関係から、大局のトレンドと現在のフェーズ(押し目・戻り・レンジ等)を判定。
市場熱量とモメンタム: ATRによるボラティリティと、ADXによるトレンドの推進力を計測。
内部ロジック解析: MACDとDMIのベクトル同期に加え、MACDヒストグラムの増減から「モメンタムの加速/減速」まで高解像度に分析。
局所ストレス: RSI、ストキャスティクス、ボリンジャーバンド(±2σ, ±3σ)を複合し、局所的な過熱感とサポート/レジスタンスを算出。
総合判定: 上位の文脈と局所ストレスを掛け合わせ、「押し目買い」「突っ込み売り警戒」「ノートレード」などの最適解を提示。
Gösterge

Gold Pro Stacking Dashboard V2Master Guide: Gold Pro Stacking Dashboard V2
This guide will help you master the Gold Pro Stacking Dashboard V2. This indicator is designed for high-probability "stacking" entries on the 5-minute timeframe, ensuring that when you enter a trade, the entire market structure and the fundamental drivers (Dollar and Yields) are working in your favor.
1. The Dashboard Columns
The dashboard in the top-right is your "Command Center." Here is exactly what each metric tells you:
Trend Bias (EMA20): Shows if the price is trading above or below a sloping EMA on that specific timeframe.
🟢 Green (Bullish): Price is trending up.
🔴 Red (Bearish): Price is trending down.
Volume: Tracks institutional activity and momentum.
🟠 Orange (HIGH): Big players are entering the market. This is exactly what you want to see for a breakout.
⚪ Grey (NORMAL): Standard retail volume.
Market State (The Score): This is the heart of the "Stacking" logic.
NEUTRAL: The timeframes are mixed. Do nothing.
STRONG BULL / BEAR: 4 out of 5 factors are aligned. Good for aggressive traders.
🔥 SUPER STACK: The "Holy Grail" signal. All 4 timeframes, the DXY, and Bond Yields are perfectly aligned.
💤 LOW VOLATILITY: The market is "dead." The indicator will hide signals here to prevent you from getting chopped out.
2. The Fundamental Drivers
At the bottom of the table, you will see the DXY Index (US Dollar) and 10Y Bond Yields.
Gold has a strong inverse relationship with both of these assets.
If the DXY and Yields are Green (Bullish), Gold should ideally be Falling.
The dashboard automatically factors this into the Super Stack signal. A "Super Buy" will only occur if the Dollar and Yields are weakening.
3. On-Chart Visuals
Beyond the dashboard, the indicator plots visual cues directly on your candles:
🏷️ GOLD BUY / GOLD SELL Labels: These appear when a "Super Stack" is confirmed.
Note: The signal only triggers if the current candle breaks the high/low of the previous candle, confirming that momentum has actually started.
🕯️ Bar Coloring (Context): The candles themselves are subtly colored based on the macro 4-hour trend.
If the bars are Greenish, the "Big Picture" is Bullish.
If the bars are Reddish, the "Big Picture" is Bearish.
🔵 Vol+ Dots: Tiny circles above or below the bars indicating high volume pressure on the 5m chart.
4. How to Trade (The Checklist)
🟢 The Perfect Long (Buy) Setup:
Check 4H Bias: Are the bars greenish? (HTF Trend is up).
Monitor Dashboard: Wait for the Stack Status to move from "Neutral" to "Strong Bull."
Fundamental Check: Ensure DXY and Yields are showing "Bearish (XAU↑)".
Execute: When the GOLD BUY label appears and volume is HIGH, enter the trade.
Stop Loss: Place your stop loss safely below the most recent 5m swing low.
🔴 The Perfect Short (Sell) Setup:
Check 4H Bias: Are the bars reddish? (HTF Trend is down).
Monitor Dashboard: Wait for the Stack Status to move to "Strong Bear."
Fundamental Check: Ensure DXY and Yields are showing "Bullish (XAU↓)".
Execute: When the GOLD SELL label appears and volume is HIGH, enter the trade.
Stop Loss: Place your stop loss safely above the most recent 5m swing high.
5. Professional Tips
⚠️ Avoid "DXY Conflict": If Gold is moving up but the DXY is also moving up, be very careful. This is often a fake-out. Wait for the fundamentals to align properly.
⏰ London & New York Open: The most reliable "Super Stacks" happen during the first 2 hours of the London open and the first 2 hours of the New York open.
🛑 Trust the Low Volatility Filter: If the dashboard says "LOW VOLATILITY," walk away from the screen. These are the times when Gold is most likely to hit your stop loss due to random, directionless noise. Gösterge

Gösterge

Gösterge
Gösterge

O'Neill TerminalThe O'Neill Terminal PineScript indicator, designed to overlay on price charts and present market dynamics using a physics-inspired orbital framework combined with a Bloomberg-style terminal interface.
The code is structured into six logical sections:
Bloomberg Design System
The script first defines a color palette that mimics the Bloomberg Terminal aesthetic. It includes amber as the primary highlight color, along with green, red, cyan, dark background, and gray. These colors are later used for chart elements and the on-screen telemetry panel.
Quantitative Engine (Niche Metrics)
This section calculates the core analytical components of the orbital model using a configurable lookback period (default 20).
Central Axis (axis)
A volume-weighted moving average (VWMA) acts as the equilibrium axis. This represents the gravitational center of the system where price tends to stabilize.
Z-Score (z_score)
Measures statistical deviation of price from its mean using standard deviation. It quantifies how far price has moved from equilibrium in sigma units, identifying extreme conditions.
Angular Velocity (velocity)
Calculated as the rate of change (ROC) of price over 5 periods. This represents rotational speed within the orbital framework.
Angular Acceleration (acceleration)
Calculated as the rate of change of velocity. This captures changes in momentum and helps identify divergence between speed and force.
Relative Mass (rel_mass)
The ratio of current volume to its moving average. This models the “mass” of capital entering the system, amplifying movement when elevated.
Kinetic Energy (kinetic)
Derived from ATR relative to price. This measures volatility intensity and represents vibrational energy inside the orbital structure.
Terminal Status Logic
The script assigns a market state based on Z-score thresholds:
Above +2 sigma - OVERBOUGHT
Below -2 sigma - OVERSOLD
Between ±0.5 sigma - EQUILIBRIUM
Otherwise - NEUTRAL
Each state is paired with a corresponding color for visual emphasis in the terminal.
Chart Plots
The indicator plots minimal visual elements:
The central axis (VWMA equilibrium line)
Upper hull boundary at +2 standard deviations
Lower hull boundary at -2 standard deviations
These boundaries represent the structural limits of the orbital system.
Bloomberg UI Helper Function
A reusable function formats rows in a table using monospaced font and aligned columns. This function is used to render the telemetry terminal with consistent styling.
Terminal Rendering
A table is created in the top-right corner of the chart, simulating a live telemetry terminal. It updates on the last bar and displays:
System header and status label
Orbital state (derived from Z-score)
Z-score value
Velocity (price ROC)
Acceleration (momentum change)
Relative mass (volume intensity)
Kinetic energy (ATR-based volatility)
Last price
Countdown timer to next candle close
Hull stability index
The Hull Stability index is calculated as:
stability = 100 − (|Z-Score| × 25)
This provides a percentage-based measure of how stable price is relative to the orbital hull. Lower values indicate structural stress and higher probability of reversal.
Overall, the indicator functions as a physics-inspired telemetry dashboard. It interprets price movement as an object inside a rotating system, where deviation from equilibrium, momentum dynamics, capital mass, and volatility energy combine to define market state and potential turning points. It was fun creating it :) Gösterge

Gösterge

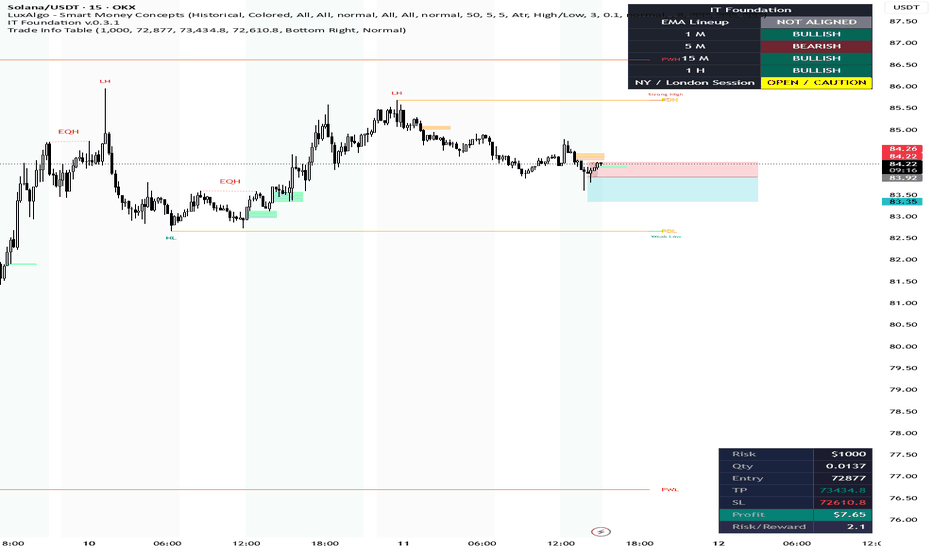
Seba'sCalcThis indicator acts as a real-time trade planning panel directly on your chart.
Simply enter your Invested Amount, Entry price, Take Profit (TP), and Stop Loss (SL)
in the settings — the table calculates and displays everything else automatically.
────────────────────────────────────────
WHAT IT DISPLAYS
────────────────────────────────────────
• Risk — Your total capital at risk (invested amount)
• Qty — Position size derived from your investment and entry price
• Entry — Your planned entry price
• TP — Take Profit level (highlighted in teal)
• SL — Stop Loss level (highlighted in red)
• Profit — Expected dollar profit if TP is hit (Qty × (TP − Entry))
• Risk/Reward — Ratio of potential profit to potential loss
────────────────────────────────────────
HOW IT WORKS
────────────────────────────────────────
Qty = Invested Amount ÷ Entry Price
Profit = Qty × (TP − Entry)
Risk Amount = Qty × (Entry − SL)
Risk/Reward = Profit ÷ Risk Amount
────────────────────────────────────────
CUSTOMIZATION
────────────────────────────────────────
• Table position — Top/Bottom, Left/Right, or Center
• Text size — Tiny, Small, Normal, or Large
• Profit row color changes automatically (teal = profit, red = loss)
────────────────────────────────────────
WORKS ON ALL ASSETS
────────────────────────────────────────
Crypto, Forex, Stocks, Commodities — any market where you define
your own entry, TP, and SL levels.
────────────────────────────────────────
HOW TO USE
────────────────────────────────────────
1. Add the indicator to your chart
2. Open Settings (gear icon)
3. Enter your Invested Amount, Entry, TP, and SL
4. The table updates instantly on the last bar
No repainting. No signals. Pure planning tool. Gösterge
Gösterge

Gösterge

Gösterge

Gösterge
Gösterge

Gösterge