Gösterge
Temel Analiz
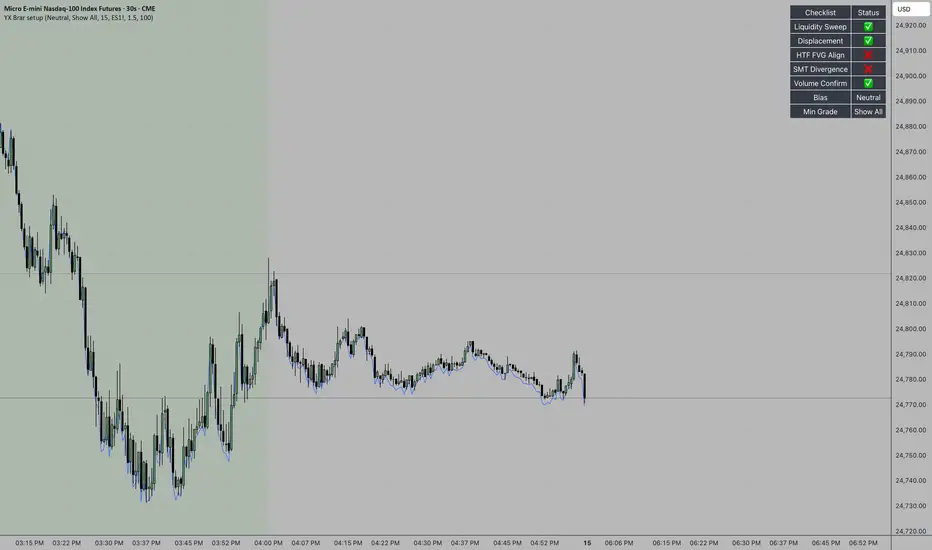
MNQ - 5MMNQ - 5M | Institutional Edge & Opening Range Academy
Overview
The MNQ - 5M is a high-precision execution and educational tool specifically engineered for the Micro E-mini Nasdaq-100 (MNQ). Designed for the trader who values clarity over noise, this script automates the New York 5-Minute Opening Range strategy, integrating institutional confluences like Anchored VWAP, Golden Zone Fibonacci, and CVD-based Volume Analysis.
Key Features
Automatic 5M Opening Range: Automatically plots the high and low of the 9:30 AM NY candle with a clean, semi-transparent design.
Dual-Trend Alignment: Features a built-in 1H Master Trend filter to ensure you only trade in the direction of the institutional flow.
Golden Zone Detection: Identifies high-probability retracement areas between the 38.2% and 78.6% Fibonacci levels.
Institutional Confluences: Integrates EMA 200 (Major Trend), EMA 89 (Dynamic Support), and Anchored VWAP starting exactly at the opening bell.
Smart Execution Labels: Clear BUY and SELL signals that only appear when price action, volume (CVD), and safety filters (1.5 ATR) align.
Anti-Saturation Logic: Limited to 2 high-probability signals per trend to promote discipline and prevent overtrading.
How to Use
Preparation: Watch for the Blue Opening Range box at 9:30 AM NY time.
Wait for the Hook: Look for price to break the range and pull back to a confluence zone (EMA, VWAP, or Golden Zone).
Execution: Enter when the "BUY" or "SELL" label appears alongside an engulfing or rejection candle.
Risk Management: The built-in 1.5 ATR filter warns you if you are too close to a major EMA "wall."
Technical Settings
EMA 200: Black (Thickness 4) - The Trend Anchor.
EMA 89: Sky Blue (Thickness 1) - Dynamic Support.
VWAP: Purple (Thickness 3) - Institutional Baseline.
Gösterge

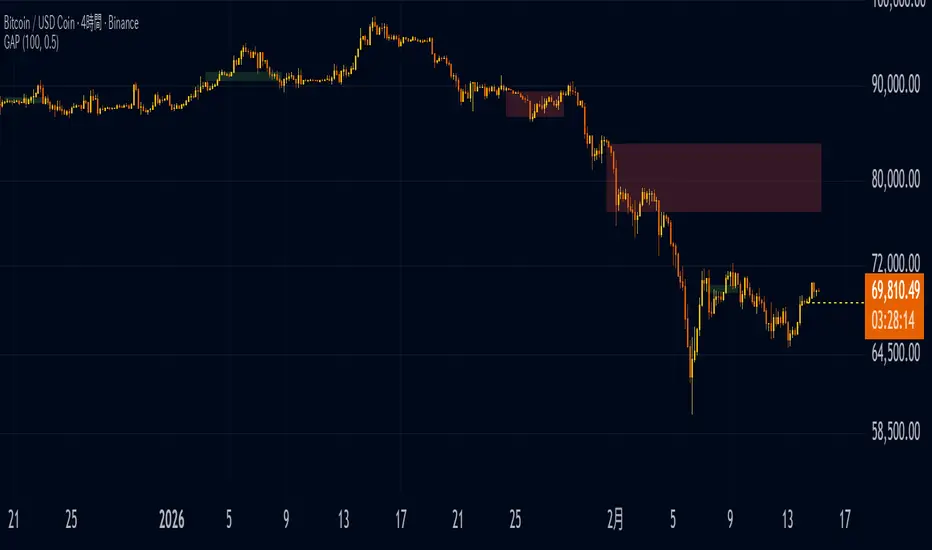
Bitcoin CME GAP [SAKANE]This indicator detects and visualizes the weekend gap in CME Bitcoin futures (BTC1!), defined as the difference between the Friday settlement price and the Monday opening price. It stores the final CME close, waits for trading to resume, and then measures the gap. If the gap exceeds the user-defined threshold, it is displayed as a box on the chart. The box remains active until price returns to the gap’s closing level or a specified number of bars has elapsed. During the CME weekend closure, a horizontal reference line marks where CME last settled, providing a clear anchor for price positioning.
A key feature is that the gap is displayed correctly even on spot or perpetual BTC charts. Because futures prices often trade at a premium or discount relative to spot markets, plotting CME levels directly would misplace the gap. This script calculates the price difference between CME and the chart instrument and shifts the gap vertically into the chart’s price space while preserving its true size. As a result, traders can see the actual gap location where market participants are likely to react, without distortion from futures basis differences.
Gap-fill detection is performed using CME futures prices themselves. The script evaluates whether the CME high or low has reached the prior CME close level that defines the gap. This ensures that once the gap is filled in the futures market, it is considered filled everywhere. Because of this CME-based validation combined with spot-space visualization, users can determine whether a gap has closed without switching to the BTC1! chart.
CME gaps are widely observed by market participants because price frequently revisits and fills these discontinuities. By highlighting both the location and the fill status of the gap, this indicator helps track the gap-closure tendency and provides insight into short-term liquidity imbalances, derivatives-driven dislocations, and the market’s process of price repair.
Gösterge
Gösterge

Liquidity Day Series V1
Short Description (English):
Automatically tracks Previous Day High (PDH) and Low (PDL) as key institutional liquidity levels with customizable session visualizations and real-time alerts.
Full Description (English):
Liquidity Day Series V1 is a specialized tool designed to identify critical price action levels used by institutional traders. By focusing on the Previous Day’s High (PDH) and Previous Day’s Low (PDL), this script highlights zones where massive liquidity often rests, leading to significant breakouts or reversals.
Key Features:
High-Visibility Liquidity Lines: Automatically plots bold, high-contrast lines for daily levels. The thickness and colors are fully customizable to fit any chart theme.
Smart Market Sessions: Features integrated background shading for Asia, London, and New York sessions. This helps traders identify market context and volatility windows where liquidity sweeps are most likely to occur.
Precision Signals: Includes built-in Buy/Sell signals triggered when the price confirms a breakout above or below the daily liquidity walls.
Advanced Alert System: Supports both static alertcondition and dynamic alert() functions, delivering real-time price data notifications directly to your device.
How to Use:
Monitor the Walls: Watch how price reacts as it approaches the bold PDH (Green) or PDL (Red) lines.
Trade the Sessions: Focus on breakouts that occur during the London or New York sessions for higher probability setups.
Confirm the Break: Look for the triangle signals which confirm a successful crossover/crossunder of the liquidity levels.
Session Visibility: Toggle individual market sessions (Asia/London/NY) to clear chart clutter.
Line Styles: Adjust the "Line Thickness" (1-5) for maximum visibility on high-resolution monitors.
Data Source: Uses non-repainting request.security with lookahead enabled to ensure levels are plotted correctly from the start of the day.
Past performance is not indicative of future results. This script is for educational purposes. Trading involves risk; please use appropriate risk management.
Gösterge

Liquidity Day Strategy V1Title: Liquidity Day Strategy V1
Overview
Liquidity Day Strategy V1 is a professional-grade trading tool built on the principles of Institutional Liquidity. It automatically identifies and highlights the Previous Day's High (PDH) and Previous Day's Low (PDL) as critical "Walls of Liquidity." These levels are widely used by institutional traders for stop-hunting or as breakout triggers.
This script combines precise price-action levels with Session Visualization, allowing traders to see exactly when and where liquidity is being captured during the Asia, London, and New York market windows.
Key Features
Bold Liquidity Markers: Automatically plots thick, neon-colored lines for PDH and PDL, ensuring you never miss a key daily level.
Session Backgrounds: Visual overlays for Asia, London, and New York sessions to help you trade during peak volatility. Each session can be toggled on/off independently.
Built-in Strategy Engine: Includes a backtesting module to track performance, Win Rate, and Drawdown directly on your chart.
Dynamic Alert System: Real-time notifications for both "Buy Side" and "Sell Side" breakouts, including live price data in the alerts.
Input Settings & Risk Management
To ensure consistency across different assets (Gold, Forex, or Crypto), this strategy uses Percentage-Based risk management:
Take Profit (%): Sets your target gain. Adjust this based on the asset's average daily range (ADR).
Stop Loss (%): Defines your maximum risk per trade to protect your capital.
Session Visibility: Fully customizable colors and toggles for each trading session to keep your chart as clean or as detailed as you prefer.
Line Styles: Adjustable thickness and color for liquidity levels to suit any chart theme (Dark/Light).
How to Trade
Breakout Confirmation: The strategy triggers a Long entry when the price closes above the PDH and a Short entry when it closes below the PDL.
Session Context: Look for breakouts occurring during the London or NY Open for higher probability moves.
Risk Calibration: Use the Strategy Tester to find the optimal TP/SL ratio for your specific timeframe.
Disclaimer
This script is provided for educational and informational purposes only. Trading financial markets involves significant risk of loss. Past performance, whether real or simulated, is not a guarantee of future results. Always practice proper risk management.
Strateji

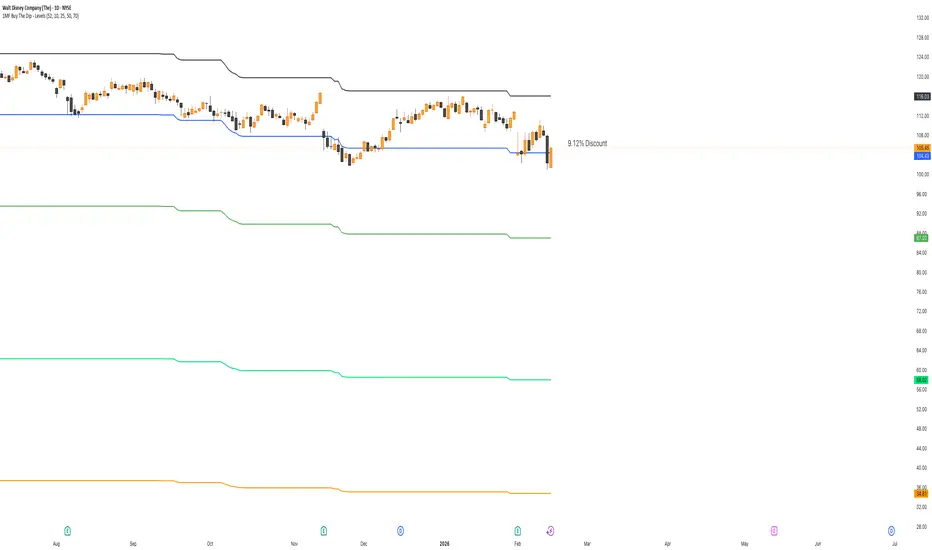
1MF Buy The Dip - LevelsThis indicator marks the highest point in a defined amount of time, then it draws a line on up to 4 discount levels defined; and add a label with the current discount from said high.
It helps while wondering how much is a stock discounted from the previous high reached before the drop, and to add alerts to buy once price breaks down specific levels.
DEFAULT VALUES
21 periods lookback for highs
10, 25, 50, & 70% discounts
Gösterge
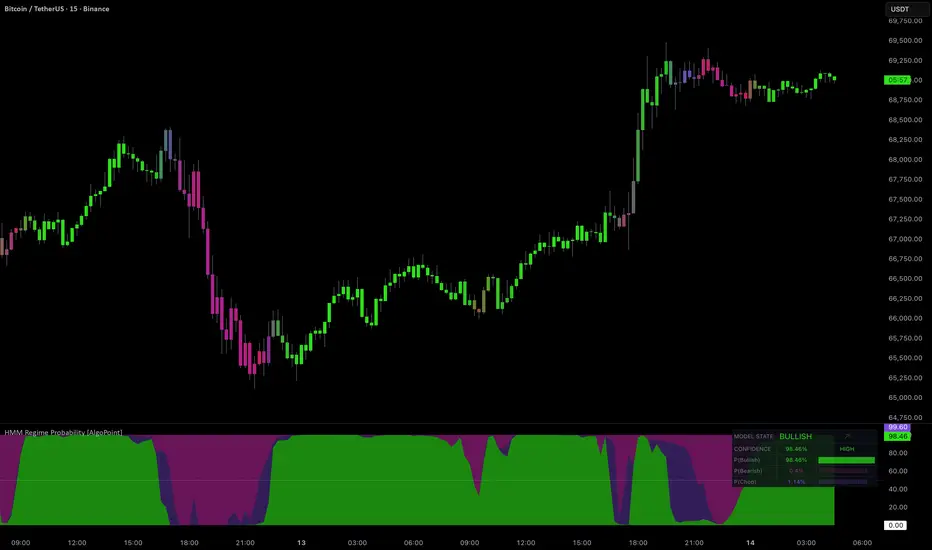
Hidden Markov Model: Regime Probability [AlgoPoint]Hidden Markov Model: Regime Probability
Traditional technical indicators are deterministic and lagging; they tell you what the price has already done. The Hidden Markov Model (HMM) Regime Probability system takes a completely different, quantitative approach. It uses probabilistic mathematics to estimate the unobservable "Hidden State" (Market Regime) the price is currently operating in.
Inspired by the mathematical models used by institutional quantitative hedge funds, this script doesn't just look at price direction—it calculates the probability of the market being in a specific regime based on real-time observations of Momentum and Volatility.
1. The Three Hidden States (Regimes)
The market is modeled as existing in one of three hidden states:
↗ Bullish Regime: High positive momentum with low or stable volatility. (Steady, grinding uptrends).
↘ Bearish Regime: High negative momentum with high volatility. (Aggressive sell-offs and panic).
↕ Chop / Chaos Regime: Zero/low momentum with high volatility. (Whipsaw, ranging, and unpredictable noise).
2. How It Works (The Quant Engine)
Since Pine Script does not natively support complex matrix optimization, this script builds a robust Pseudo-HMM using a predefined Transition Matrix and Bayesian Updates.
Observables (Emissions): The script calculates the Z-Scores of Smoothed Momentum (Rate of Change) and Volatility (ATR).
Emission Probabilities (Gaussian PDF): It feeds these Z-Scores into a Gaussian Probability Density Function to see how well the current market matches the expected profile of a Bull, Bear, or Chop regime.
Bayesian Update: Using a predefined Markov Transition Matrix (the statistical inertia of a trend), it updates the prior probabilities to give you a real-time percentage (0-100%) for each regime.
3. Advanced Visual Features & UI
We built a custom UI/UX engine to make digesting complex probabilities instantaneous:
Exponential Color Smoothing (Bar Colors): As the probability of a regime increases, the bar colors smoothly transition. We implemented an exponential color blending algorithm to prevent abrupt, distracting color changes and eliminate "muddy" colors during transitions.
Pro Quant Dashboard: A built-in HUD (Heads-Up Display) provides a quick summary. It features a dominant state readout, an overall "Confidence Score", and ASCII-style mini progress bars (████░░░) for rapid visual processing of probabilities without needing to read the numbers.
Stacked Area Oscillator: The bottom panel displays a 0-100 stacked area chart, showing the exact distribution of probabilities across Bull (Green), Chop (Purple), and Bear (Red) states.
4. How to Use This Tool
This is not a standalone Buy/Sell signal indicator. It is a Strategy Filter and a Risk Manager.
When Bull/Bear Probability is Dominant (>50%): The market is trending. Turn ON your trend-following indicators (like Moving Averages or Breakout systems) and ignore overbought/oversold signals.
When Chop Probability is Dominant (>50%): The market is noisy. Turn OFF your trend-following systems. Either switch to Mean Reversion strategies (like RSI or Bollinger Bands) or stay in cash until a clear regime emerges.
Watch the Confidence Score: If the Dashboard shows "LOW" confidence, it means the probabilities are split (e.g., 34% Bull, 33% Chop, 33% Bear). Wait for the model to gain confidence before committing capital.
5. Alerts
The script includes non-repainting alerts that trigger only when the dominant regime changes:
HMM Regime: BULLISH 🚀 * HMM Regime: BEARISH 🩸 * HMM Regime: CHOP ⚖️
6. Settings
Lookback Period: The window used to calculate the Z-scores for momentum and volatility.
Transition Matrix: Allows advanced users to tweak the statistical likelihood of the market staying in its current state versus transitioning to a new one.
Color Transition Speed: Adjusts the smoothness of the bar coloring. A lower value creates a buttery-smooth fade between regimes, while a value of 1.0 makes it instant.
Gösterge
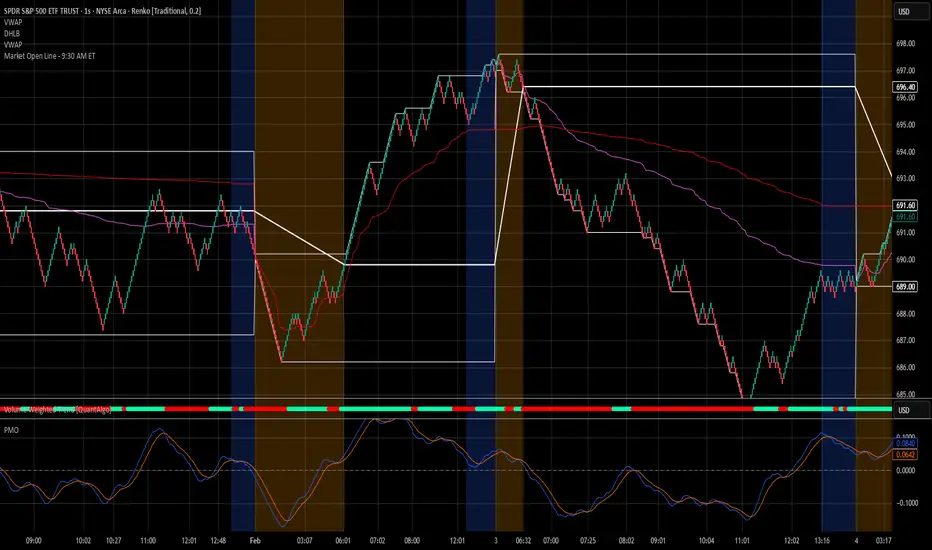
Market Open Line - 9:30 AM ETI've created a PineScript indicator that draws a horizontal line at the exact opening price from 9:30 AM Eastern Time.
Key Features:
Detects when the market opens at 9:30 AM ET
Captures the opening price at that exact time
Draws a horizontal line that extends from 9:30 AM through the rest of the trading session
Resets daily for a fresh line each trading day
Includes an optional label showing the price level
I tried to find other scripts that performed this same function on all chart types (i.e. Renko) but no other scripts worked for all use cases.
Cheers!
Gösterge
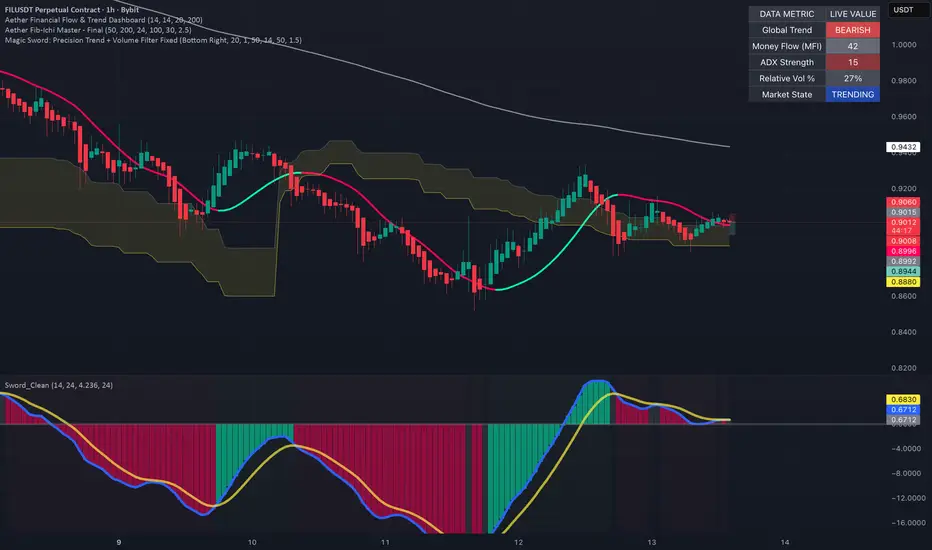
Magic Sword: Precision Trend + Volume Filter Fixed (Bottom RightMagic Sword: Precision Trend + Volume Filter Fixed (Bottom Right, 20, 1, 50, 14, 50, 1.5)
Gösterge

Magic Sword: Precision Trend + Volume Filter Fixed
The SWORT Precision Volume Trend Filtered is a sophisticated technical analysis tool designed to identify high-probability market entries by merging three critical data pillars: Price Momentum, Volume Flow, and Trend Consistency.
Key Features:
Precision Filtering: Utilizing advanced smoothing algorithms, the indicator filters out "market noise" and minor price fluctuations, ensuring you stay focused on the primary trend.
Volume Integration: Unlike standard trend followers, it validates price movements through volume analysis, confirming that a trend has the institutional "weight" to continue.
Adaptive Sensitivity: It dynamically adjusts to market volatility, providing responsive signals during breakouts while maintaining stability during consolidation phases.
Visual Clarity: Designed for immediate interpretation, it offers clear visual cues (color-coded trends or signals) to help traders minimize emotional bias and execute with discipline.
Gösterge
Fair Interest Rate Ladder (Auto + Info)Description:
The Fair Interest Rate Ladder indicator is designed to visualize the "fair value" of interest rate instruments (bond futures, rate swaps, etc.), accounting for accrued interest or carry costs. It plots a step-line that converges toward a target base point as the expiration date approaches.
Key Features:
Auto-Spread Detection: The indicator automatically detects if you are using a spread formula (e.g., ZN1!-100). If detected, the anchor point automatically shifts from 100 to 0.
Adjustable Rate & Direction: Easily set the annual percentage rate and choose the price convergence direction (upward or downward toward expiration).
Leap Year Accuracy: Mathematically precise calculations based on the actual number of days in the current year (365 or 366).
Dashboard: A real-time table in the top-right corner displays the exact Fair Value and the countdown of days remaining until expiration.
Expiration Tracking: A distinct red "zero line" and a visual label marking the contract's end date.
How to use:
Input the start and expiration dates of your contract, set the current interest rate, and the indicator will show where the price should theoretically be trading today.
Russian (Русский)
Описание:
Индикатор Fair Interest Rate Ladder предназначен для визуализации «справедливой стоимости» процентных инструментов (фьючерсов на облигации, ставки) с учетом накопленного купона или процентного дохода. Он строит ступенчатую линию, которая стремится к целевой точке (базе) по мере приближения даты экспирации.
Основные возможности:
Автоматика для спредов: Индикатор автоматически определяет, используете ли вы формулу спреда (например, ZN1!-100). В этом случае точка нуля автоматически смещается со 100 на 0.
Гибкая настройка ставки: Возможность задать годовую процентную ставку и направление движения цены (вверх или вниз к экспирации).
Учет високосных лет: Математически точный расчет на базе количества дней в текущем году (365 или 366).
Инфо-панель: В правом верхнем углу отображается таблица с текущим расчетным значением Fair Value и счетчиком дней до экспирации.
Визуализация экспирации: Четкая красная линия «горизонта» и метка даты окончания контракта.
Как использовать:
Введите дату начала и дату экспирации вашего контракта, укажите актуальную ставку, и индикатор покажет, где должна находиться цена сегодня относительно её теоретического идеала.
Gösterge

Geopbytech Risk Based Lots Calculator📊 Geopbytech – Risk Based Lots Calculator
Built by Juan C. Delgado
A lightweight and fast position size calculator designed to help traders determine optimal lot size directly from the TradingView chart.
No more switching to external websites during live execution.
Simply input:
Account Size (USD)
Risk Ratio %
Stop-Loss distance (pips or points)
The tool instantly calculates the correct lot size based on proper risk management.
🔹 How It Works
The calculator determines:
Risk ($) = Account Size × Risk %
Lot Size = Risk ($) ÷ (Stop-Loss Units × $ Value per Unit per 1 Lot)
Everything updates instantly as you change values.
🔹 Example
Account Size Risk % Stop Loss Result
$10,000 1% 20 pips 0.50 lots
$5,000 1% 15 pips 0.33 lots
$8,000 2% 30 pips 0.53 lots
🔹 Default Configuration (Forex – EURUSD)
By default, the script is optimized for standard Forex pairs like EURUSD.
You only need to:
Enter Account Size
Enter Risk %
Enter Stop-Loss in pips
The script automatically calculates pip value using standard 100,000 contract size.
🔹 Trading Gold (XAUUSD)
If you are trading Gold:
Enable:
✔ Override $ per unit (non-FX)
Then adjust:
• Override $ per 1 unit per 1 lot
(or use Custom Unit Size if needed depending on broker specification)
Because gold brokers may use different contract sizes.
🔹 Trading Indices
For indices (NAS100, US30, SPX, etc.):
You can:
• Leave override OFF (if TradingView provides correct point value)
OR
• Enable Override and manually define $ value per point per lot
Depends on your broker's contract specification.
🔹 Trading Cross Pairs (GBPJPY, EURJPY, etc.)
For Forex crosses:
Leave override OFF.
If calculation warning appears:
Adjust "Custom Unit Size" to match correct pip structure.
Example:
GBPJPY may require adjusting unit size depending on feed.
🔹 Inputs Explained
Account Size (USD)
Your total trading account balance.
Risk Ratio %
Percentage of account you are willing to lose per trade.
(Example: 1% = disciplined risk management)
Stop-Loss (pips / points)
Distance from entry to stop loss.
This must match what you use in the TradingView position tool.
Custom Unit Size (price)
Advanced setting.
Used when your symbol does not follow standard pip or tick logic.
You define how much price movement equals 1 unit.
FX Contract Size
Default: 100,000 (standard lot in Forex).
Only change if your broker uses non-standard contract sizes.
🎨 UI Customization
You can customize:
• Theme (Dark / Light / Midnight)
• Dashboard Position
• Transparency
• Text Size
• Warning visibility
⚠️ Important Notes
This tool calculates position size based on TradingView symbol specifications.
Broker contract sizes may vary.
Always verify:
Pip value
Contract size
Margin requirements
Final order size
Before placing a live trade.
⚠️ Disclaimer
This tool is provided for educational and informational purposes only.
It does not constitute financial advice, investment advice, or trading recommendations.
Trading involves substantial risk and may result in loss of capital.
Use at your own risk.
👤 Author
Built by Juan C. Delgado
Geopbytech
Gösterge

Sessions [ARCHI]Trading Session Highlighter
Overview
Sessions highlights the four major forex trading sessions directly on your chart with colored boxes: **Sydney**, **Asia (Tokyo)**, **London**, and **New York**. Instantly see which session is active, where the high/low of each session was, and how sessions overlap.
🔑 Key Features
📦 **Session Boxes** — Each session is drawn as a transparent box spanning the session's high-to-low range. The box updates in real time as new highs and lows are printed.
🏷️ **Centered Labels** — Session names are displayed at the top-center of each box for quick identification.
🌍 **4 Major Sessions** — Sydney (Yellow), Asia/Tokyo (Blue), London (Green), New York (Red). All times are based on UTC.
☀️ **DST / Summer Mode** — One-click toggle to adjust session times for Daylight Saving Time. When enabled, Sydney, London and New York sessions shift by 1 hour. Asia (Tokyo) is unaffected as Japan does not observe DST.
🎨 **Fully Customizable Colors** — Adjust box background and border colors independently for each session.
📈 How to Use
Session Context
- Know **which session you're trading in** — different sessions have different volatility and liquidity profiles.
- **Asia** tends to range, **London** tends to trend, **New York** brings the most volatility.
Session High/Low as Support & Resistance
- The **high and low of each session** often act as intraday support and resistance levels.
- A break of the **Asia session high/low** during London open is a classic setup.
Overlap Zones
- The **London–New York overlap** (13:00–16:30 UTC) is the highest volume period in forex.
- Look for the biggest moves and best setups during overlaps.
Kill Zones
- Use session boxes to identify **kill zones** — the first 1–2 hours of London and New York where institutional order flow is heaviest.
## ⚙️ Settings
| Parameter | Default | Description |
|-----------|---------|-------------|
| Summer Mode (DST) | Off | Shifts session times by -1 hour for DST |
| Sydney Box | Yellow (90% transparent) | Sydney session background color |
| Sydney Border | Yellow (60% transparent) | Sydney session border color |
| Asia Box | Blue (90% transparent) | Asia session background color |
| Asia Border | Blue (60% transparent) | Asia session border color |
| London Box | Green (90% transparent) | London session background color |
| London Border | Green (60% transparent) | London session border color |
| NY Box | Red (90% transparent) | NY session background color |
| NY Border | Red (60% transparent) | NY session border color |
🕐 Default Session Times (UTC, Winter)
| Session | Start | Duration | End |
|---------|-------|----------|-----|
| Sydney | 23:00 | 1h | 00:00 |
| Asia (Tokyo) | 00:00 | 9h | 09:00 |
| London | 08:00 | 8.5h | 16:30 |
| New York | 13:00 | 9h | 22:00 |
💡 Tips
1. Works best on **M5 – H1** timeframes for clear intraday session visualization.
2. On **higher timeframes** (H4+), boxes may overlap significantly — consider using on intraday charts only.
3. Combine with VWAP, volume profile, or order flow tools for confluence-based entries at session boundaries.
4. The **London open** and **New York open** are statistically the best times for breakout trades.
Gösterge

Day trade futures - ES VWAP Pullback v2.0 [Signals]ES VWAP Institutional Pullback v2.0
—— STRATEGY VERSION ——
A futures day-trading system built specifically for /ES (S&P 500 E-mini) on the 5-minute timeframe. Designed around the premise that institutional algorithms benchmark entries against VWAP and that the highest-probability trades come from entering trend continuations after pullbacks — not from predicting reversals.
This is not a typical MACD crossover strategy. Every component is filtered and confirmed before a signal fires.
█ HOW IT WORKS
The system requires four conditions to align before entering a trade:
1. Higher-Timeframe Trend Confirmation
Uses a 50 EMA pulled from the 15-minute chart via request.security(). Price must be above this EMA for longs, below for shorts. This replaces the common approach of plotting a 200 EMA on the entry timeframe, which on a 5-minute chart represents ~17 hours of data and reacts too slowly to intraday regime changes.
2. VWAP Institutional Bias
Price must be above the session VWAP for longs, below for shorts. VWAP is the benchmark institutional algorithms use to evaluate execution quality. Trading in the direction of VWAP bias aligns your entries with the dominant order flow.
3. MACD Histogram Reversal (Not Raw Crossover)
Rather than entering on a standard MACD line crossover (which lags significantly on short timeframes), the system detects when the MACD histogram flips from negative to positive territory after being negative for at least two consecutive bars. This catches the exact moment selling pressure exhausts and buying momentum resumes — typically 1–3 bars earlier than a traditional crossover.
4. Volume Spike Confirmation
The entry bar must have volume ≥ 1.2× its 20-bar simple moving average. A MACD histogram flip on thin volume is noise. Requiring a volume spike confirms that institutional participation is actually present at the reversal point.
█ SESSION FILTER
Futures trade nearly 24 hours, but VWAP-based strategies degrade outside Regular Trading Hours when volume thins and price action becomes erratic. The system enforces a hard session window of 9:30 AM – 3:30 PM Eastern by default. All positions are automatically closed at session end if the EOD close option is enabled.
█ RISK MANAGEMENT
Dynamic ATR-Based Stops
Stop loss is calculated as 1.5× the 14-period ATR at the moment of entry. During volatile opens, your stop widens to give the trade room. During quiet midday action, it tightens to protect capital. This replaces fixed-point stops that get hunted during volatility expansion.
Partial Profit at 1R
When price reaches 1× your initial risk (the 1R level), 50% of the position is closed automatically. This locks in profit and reduces psychological pressure on the remaining runner.
Trailing Stop
After reaching the 1R trigger, a trailing stop activates at 0.75× ATR behind the current price. It only moves in your favor — never backward. This lets winners run in trending sessions while protecting gains.
Full Take Profit at 2R
The remaining position targets 2× the initial risk. Combined with the partial at 1R, the effective average exit on a full winner is approximately 1.5R.
█ BACKTEST REALISM
The strategy models:
• $2.50 per contract commission (round-trip ~$5.00, typical for /ES)
• 2-tick slippage ($25 per contract)
• No fills on close — orders process on the next bar
This matters. Many published strategies show inflated results because they assume zero friction. The performance you see in the Strategy Tester should be closer to what you would actually experience.
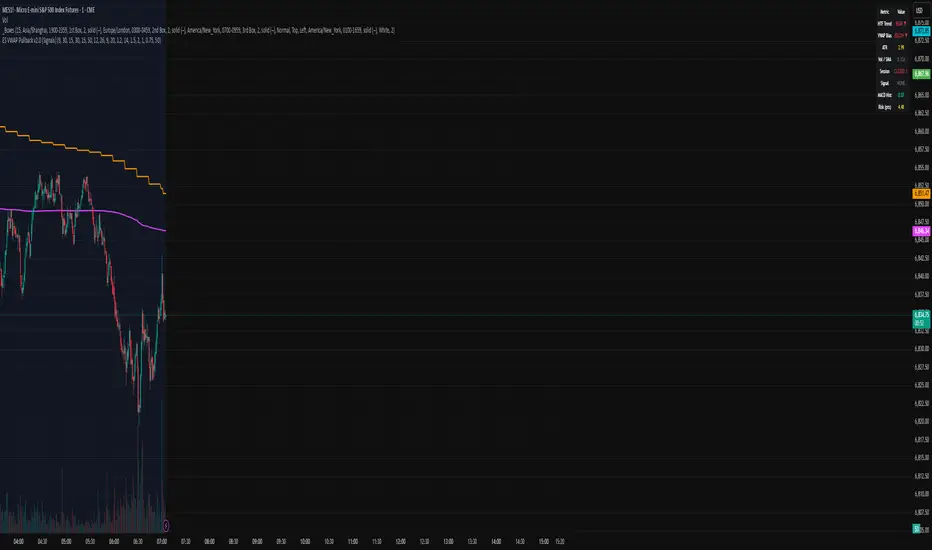
█ DASHBOARD
A real-time info table displays:
• Current HTF trend direction
• VWAP bias (above/below)
• Current ATR value
• Volume ratio vs. SMA (with color coding for spike detection)
• Session status (active/closed)
• Position status
• MACD histogram value
█ SETTINGS GUIDE
Inputs are grouped logically. Key tuning parameters:
Volume Multiple (default 1.2×) — Lower to 1.0× if you're getting too few signals in quieter sessions. Raise to 1.5× for stricter filtering.
HTF Timeframe (default 15m) — The 15-minute 50 EMA represents ~12.5 hours of trend data. You can try 30m for a slower, more conservative filter.
Trail Trigger (default 1.0R) — Set to 0.75R for more aggressive trailing. Set to 1.5R if you want the trail to activate later and give more room.
Trail Offset (default 0.75 ATR) — Lower values trail tighter (more likely to get stopped but lock more profit). Higher values give more room but risk giving back gains.
All filters (HTF, VWAP, Volume, Session) can be individually toggled off for testing which components add value in your specific market conditions.
█ WHAT THIS IS NOT
• This is not a scalping system. It targets 2R moves, not 2-tick scratches.
• This is not a reversal catcher. It trades pullbacks within established trends.
• This will not protect you from news events. Avoid FOMC, CPI, NFP, and other high-impact macro releases — no algorithm can predict those.
• This is not financial advice. Futures are leveraged instruments. Backtest results do not guarantee future performance.
█ RECOMMENDED USAGE
• Chart: /ES 5-minute
• Session: RTH only (9:30 AM – 3:30 PM ET)
• Avoid: 15 minutes before/after high-impact economic data
• Combine with: Level 2 / DOM for discretionary confirmation if available
—— INDICATOR VERSION ——
Same logic as the strategy but packaged as an indicator() for live discretionary trading:
• No backtest engine overhead — lighter on your chart
• Entry labels display exact SL, TP, and risk in points at signal time
• 1R level plotted in cyan for visual partial-profit reference
• Signal levels auto-expire after 50 bars or when SL/TP is hit
• Alert conditions registered for both long and short signals — configure through TradingView's alert dialog
Gösterge
ATRP TMGATRP Glitch. An Average True Range Percentage for those who want a solid ATRP with filters, and the ability to compare it across different assets.
Gösterge
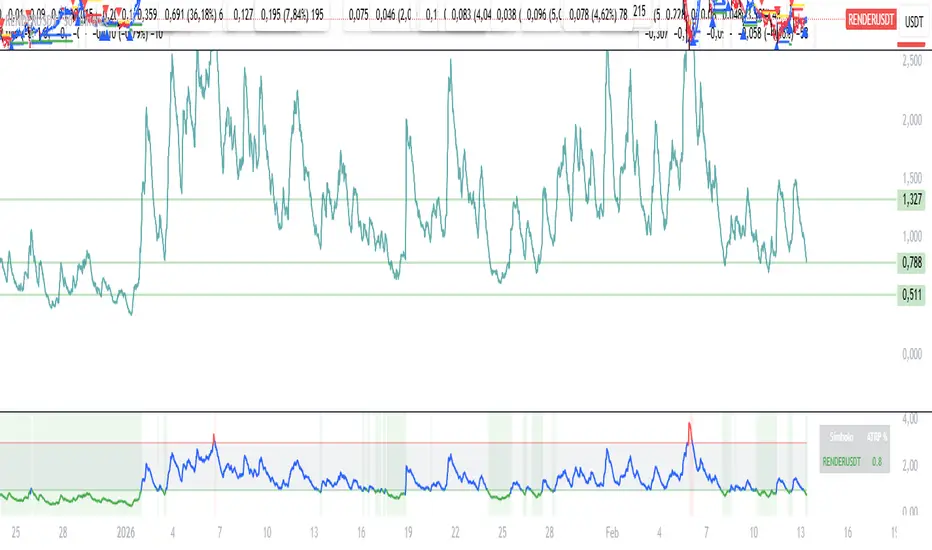
Aether OBThe Aether Clean Order Blocks is a high-precision technical indicator designed to identify institutional "Smart Money" footprints on any timeframe. Unlike standard OB indicators that clutter your chart with old data, this script focuses on Freshness and Accuracy.
Gösterge

MM FX Week (Fixed New York 17:00) - FINAL STABLE* Recolors intraday candles based on a fixed New York 17:00 (ET) custom week. Ensures consistent FX rollover timing across all timezones.
* Custom weekly candle coloring based on New York 17:00 (ET). Week calculation remains consistent regardless of user timezone.
* Fixed New York 17:00 custom week with automatic candle recoloring by weekly bias.
Gösterge
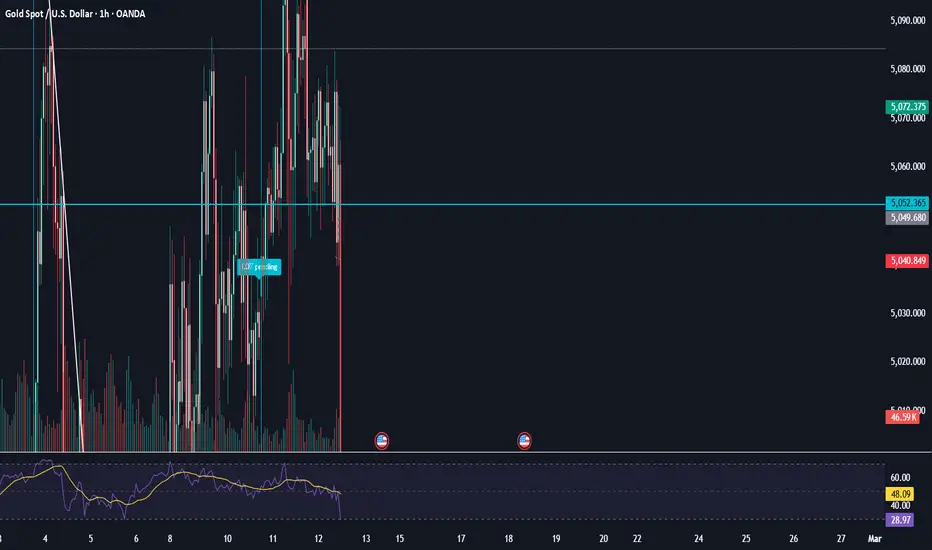
Debasement Trap: Real Wealth Tracker [Binet]Debasement Trap: Real Wealth Tracker - Script Description
Overview
A sophisticated TradingView Pine Script indicator that measures real wealth performance by adjusting nominal asset gains for monetary debasement (M2 expansion) and inflation expectations. Unlike traditional price-based indicators, this tool calculates what your investments are actually worth after accounting for purchasing power erosion.
Key Features
Core Metrics
Real Performance - Nominal gains minus purchasing power loss
Debasement Trap Detection - Identifies when assets show positive nominal returns but negative real returns
Purchasing Power Decay - Tracks cumulative wealth erosion from money supply expansion
Real Yield Analysis - Uses FRED data for 10-year inflation expectations vs nominal rates
Monetary Regime Classification - Automatic detection of repression (negative real yields) vs tightening
Advanced Analytics
High Water Mark (HWM) - Peak real performance tracking with visual reference
Time-To-Zero (TTZ) - Days until gains are fully eroded at current debasement pace
Halflife Calculation - Years for purchasing power to decline to 50%
Benchmark Comparison - Real performance vs Gold, Bitcoin, S&P 500, or custom assets
Regime Shift Detection - Alerts when monetary policy regime changes
Trap Severity Rating - Light/Moderate/Severe classification of debasement impact
Alpha Velocity - Rate of change of real performance (momentum indicator)
Data Sources
FRED M2 Money Supply (WM2NS) with automatic year-over-year calculation
FRED 10-Year Inflation Expectations (T10YIFR)
FRED 10-Year Treasury Yield (T10YIE)
Real-time benchmark pricing
User Interface
Compact or expanded HUD terminal (8-15 rows)
Comprehensive tooltips on all metrics
Color-coded risk indicators
Unicode sparklines for trend visualization
Data staleness monitoring
AI-friendly console logging
Portfolio real return analysis
Long-term wealth preservation tracking
Macro economic regime monitoring
Inflation hedge strategy validation
Asset real performance comparison
Monetary policy impact assessment
Purchasing power loss quantification
Gösterge
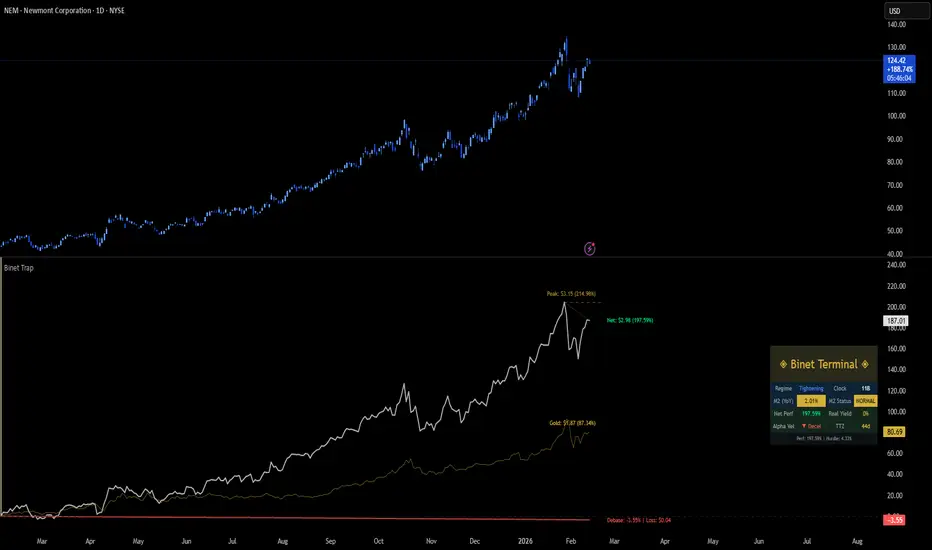
BTC Market Cap / Global M2 weighted by GoldThe market cap of Bitcoin divided by the M2 money supply of a collection of the worlds fiat currencies converted into USD and weighted by the price of gold.
Gösterge

Gösterge

Bitcoin Relative Strength: BTC vs Any Asset [Customizable]# Bitcoin Relative Strength: BTC vs Any Asset
## 📖 Description
**Compare Bitcoin's performance against ANY asset on TradingView** — S&P 500, Nasdaq, Gold, DXY, Ethereum, or any other ticker of your choice.
This indicator calculates and plots the **BTC / Asset ratio**, showing how many units of the chosen comparison asset one Bitcoin is worth. A rising ratio means Bitcoin is outperforming the selected asset; a falling ratio means it is underperforming.
### 🔑 Key Features
- **BTC vs Any Asset** — select any TradingView ticker as the comparison asset (SPX, NDX, GOLD, DXY, ETH, and more)
- **Dual Moving Averages** — EMA / SMA / WMA / VWMA / RMA with customizable lengths to identify trend direction
- **Bollinger Bands** — detect volatility compression and breakout zones on the ratio
- **RSI of Ratio** — identify overbought / oversold conditions in relative strength
- **Percentage Change** — adjustable lookback period (1–365 days) to quantify recent momentum
- **Trend Coloring** — dynamic bullish / bearish / neutral coloring based on ratio vs MA
- **Fill Zones** — optional fill between the ratio line and MA for easy visual trend spotting
- **Info Table** — real-time data panel showing ratio, individual prices, % change, trend, and MA values
- **Built-in Alerts** — MA crossovers, Golden / Death crosses, Bollinger breakouts, and RSI extremes
- **Fully Customizable** — colors, line widths, transparency, table position, text size, and more
### 📊 How to Use
1. **Add the indicator** to any chart.
2. Open **Settings → Data Sources** and choose your preferred Bitcoin ticker (e.g., BINANCE:BTCUSD) and comparison asset (e.g., SP:SPX, TVC:GOLD, FOREXCOM:DXY).
3. Enable optional overlays: Moving Averages, Bollinger Bands, RSI, or the Info Table.
4. Set alerts for key events like MA crossovers or Bollinger breakouts.
### 💡 Interpretation
| Ratio Direction | Meaning |
|---|---|
| 📈 Rising | Bitcoin outperforms the comparison asset |
| 📉 Falling | Bitcoin underperforms the comparison asset |
| ▲ Above MA | Bullish relative trend |
| ▼ Below MA | Bearish relative trend |
| Golden Cross (MA1 × MA2) | Long-term bullish shift |
| Death Cross (MA1 × MA2) | Long-term bearish shift |
### ⚠️ Disclaimer
This indicator is for **educational and informational purposes only**. It does not constitute financial advice. Always do your own research before making investment decisions.
**Indicator by:** iCD_creator
**Version:** 1.0
**Pine Script™ Version:** 6
---
Updates & Support
For questions, suggestions, or bug reports, please comment below or message the author.
**Like this indicator? Leave a 👍 and share your feedback!**
---
**#Bitcoin #BTC #RelativeStrength #BTCRatio #BTCvsSPX #BTCvsGold #BTCvsDXY #BTCvsETH #CryptoAnalysis #TechnicalAnalysis #TradingView #PineScript #Cryptocurrency #BitcoinDominance #CryptoIndicator #BTCStrength #MacroAnalysis #RatioChart #BitcoinVs #IntermarketAnalysis #CryptoTrading #BTCTrend #BTCSentiment #BitcoinPerformance #AltcoinRatio**
Gösterge

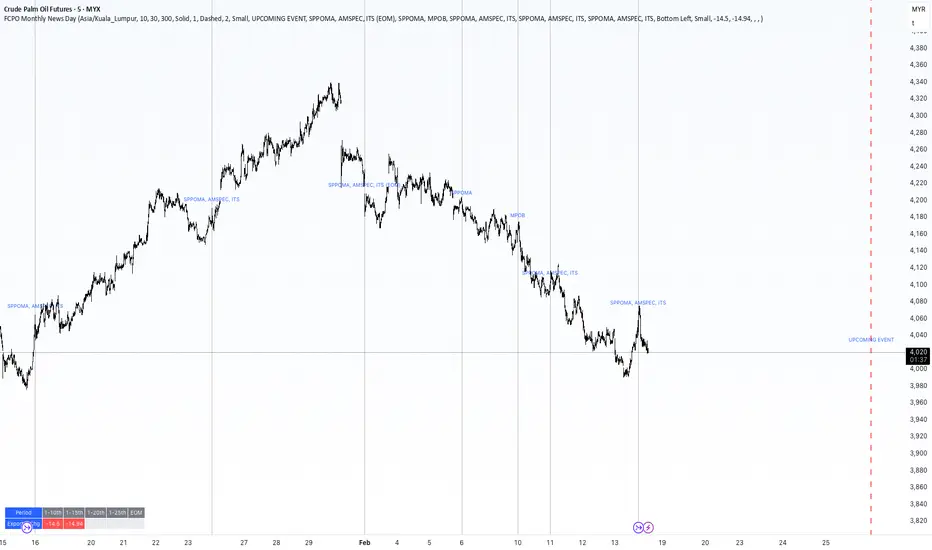
FCPO Monthly News DayFCPO Monthly News Day
Smart visual guide for key palm oil data releases
This indicator is specifically designed for FCPO traders who want to stay prepared for important palm oil industry report dates.
It automatically plots vertical lines on:
• 5th – SPPOMA
• 10th – MPOB, SPPOMA, AMPSPEC, ITS
• 15th – SPPOMA, AMPSPEC, ITS
• 20th – SPPOMA, AMPSPEC, ITS
• 25th – SPPOMA, AMPSPEC, ITS
• End of Month – SPPOMA, AMPSPEC, ITS
All lines are displayed at 10:30 AM Malaysia time.
Key Features
✅ Automatically shifts if the date falls on Saturday/Sunday
✅ Holiday-safe – if it falls on a public holiday, the line appears on the next trading day
✅ Upcoming line (default red) to highlight the next scheduled event
✅ Custom color and style for both event and upcoming lines
✅ Custom labels for each date
✅ Lightweight and clean – optimized for intraday FCPO trading
Why This Indicator Matters
FCPO traders know that:
• MPOB data can shift monthly bias
• SPPOMA / AMPSPEC / ITS export surveys can impact short-term momentum
This indicator helps you:
• Anticipate volatility
• Align your setups with news flow
• Avoid blind trading on major data days
• Plan entries around liquidity events
Built specifically for the Malaysian market (Asia/Kuala_Lumpur timezone).
Gösterge