Institutional Multi-Model AlphaOverview
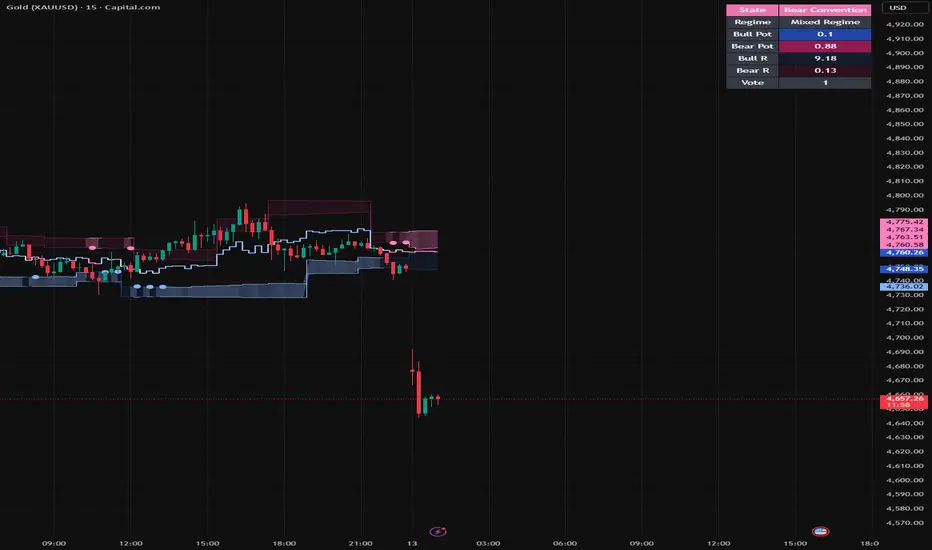
The Institutional Multi-Model Alpha is a quantitative "voting" system that aggregates seven independent algorithmic modules to determine market direction. Instead of relying on a single indicator, this tool acts as a Committee of Models, only firing long or short signals when a specific user-defined threshold of mathematical agreement is met.
The 7 Quantitative Modules
Kalman Filter: A noise-reduction algorithm that tracks the underlying price trend by filtering out "market noise."
Stat-Arb Z-Score: Measures price deviation from the mean (Standard Deviation) to identify extreme overbought/oversold conditions.
Regime Detection: Uses the ADX (Average Directional Index) and 200-day SMA to determine if the market is trending or ranging.
Volatility Risk: Analyzes the Rate of Change (ROC) of volatility to identify periods of stabilizing or expanding risk.
Linear Regression Slope: Measures the velocity and angle of the current price trend.
Momentum Cluster: Combines RSI and ROC to confirm that price movement is backed by real strength.
Beta/Correlation (SPY): Analyzes the asset's correlation to the S&P 500 (SPY) to ensure the move is supported by broader market beta.
Key Features
Ensemble Scoring: Each module outputs a score of +1 (Bullish), -1 (Bearish), or 0 (Neutral).
Weighted Thresholds: Users can set a "Signal Threshold" (e.g., 3). A signal only triggers when the net score across all 7 models exceeds that number.
Real-Time Dashboard: A visual table on the chart displays the status of every internal module simultaneously, providing full transparency into why a signal is occurring.
Multi-Asset Analysis: Includes an integrated request.security call to pull S&P 500 data for institutional-grade correlation analysis.
[Technical Specifics
Script Version: Pine Script v6
Overlay: Yes (Plots directly on price)
Visuals: Dynamic background coloring, trend-following "Quant Line," and signal shapes for easy entry/exit identification.
How to Use
Confirmation: Use the Dashboard to see if the majority of models are aligned.
Aggressive vs. Conservative: Lower the Threshold input for more frequent signals, or raise it to 5 or 6 for high-conviction, institutional-style setups.
Trend Following: The central line (Kalman Filter) changes color based on the aggregate score, serving as a dynamic trailing stop or trend bias indicator.
Gösterge

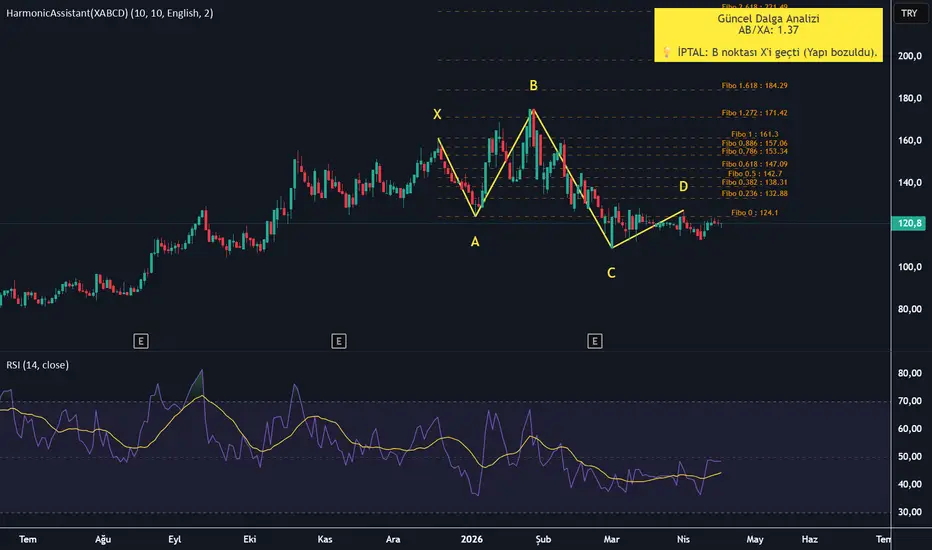
Harmonic Auto-Validator [GBB]Harmonic Auto-Validator
I built this because every harmonic indicator I tried on TradingView was doing something weird with the math.
Some draw "Gartleys" where B sits at 0.5 of XA instead of 0.618. Some skip the AB=CD validation entirely. Some draw a single line for D instead of the actual PRZ zone Carney describes in his books. After spending too many evenings trying to reverse-engineer what a few popular ones were actually checking, I decided to write my own from scratch and stick to the methodology Scott Carney lays out in "Harmonic Trading Volume One" (2004) and "Volume Two" (2007).
This is the result. Six patterns, strict ratio checks, PRZ rendered as a real zone with outlier filtering, embedded AB=CD validation, and a 0-10 score that reflects how clean the geometry actually is.
What it detects
Gartley — B at 0.618 XA, D at 0.786 XA
Bat — B around 0.5, D at 0.886
Alt Bat — B shallow (0.382), D at 1.13 (extends past X)
Butterfly — B at 0.786, D at 1.272
Crab — B around 0.5, D at 1.618
Deep Crab — B at 0.886, D at 1.618
Three tolerance presets (Strict / Standard / Lenient) control how forgiving the ratio checks are. Standard uses tolerances close to what Carney published; Lenient widens by ~40% for charts where you want to see more candidates; Strict is for when you only want near-perfect geometry.
What's actually different about this one
PRZ as a zone, not a line. Most indicators draw D at a single Fibonacci level. Carney's actual methodology defines D as a Potential Reversal Zone — the convergence envelope of multiple projections (0.786 XA, 1.27 BC, 1.618 BC, AB=CD for Gartley; different sets per pattern). HAV computes that zone, filters outliers more than 3 ATR from the median projection, and draws the resulting box. When the zone is tight (projections converge), the score goes up. When it's wide, the score goes down. This is information you actually need before deciding whether to trade the pattern.
Embedded AB=CD validation . Carney is pretty firm in the books: a harmonic pattern without an AB=CD that lands inside the PRZ is incomplete. HAV checks this explicitly and applies a -2 score penalty when the AB=CD doesn't converge. Patterns missing this convergence get a ⚠ icon on the label so you can see at a glance which ones are textbook vs. which ones are partial.
0-10 quality score combining ratio precision (how close B and D are to their ideal Fibonacci levels), PRZ tightness (how narrow the convergence zone is relative to ATR), and confluence count (how many projections actually landed inside the zone). The default `Min Score` filter is 6, but you can raise it for higher-conviction-only scanning or lower it to see more candidates.
Confirmed-only display by default . No "forming" patterns that disappear when D doesn't print where projected. When HAV draws a pattern, the geometry is locked in. There's an opt-in **Borderline mode** that shows patterns scoring 4.0-5.9 with dashed lines and a (B) prefix on the label — useful for confluence with other tools or for educational purposes, but these never trigger alerts.
Diagnostics table showing exactly what the engine is doing: how many 5-pivot windows it tested, where each gate filtered candidates (direction / structure / XA size / each ratio band / confluence / score), how many of each pattern type were accepted. If you're wondering "why didn't HAV draw a Gartley on this chart that I can see with my eyes," the diagnostics will usually tell you which gate it failed.
Alerts
Two ways to get alerted when something fires.
Unified alert with JSON payload — set up one alert on "Any alert() function call" and you'll get structured JSON when any pattern of any direction confirms. The payload includes ticker, timeframe, pattern type, direction, score, AB=CD convergence status, PRZ top and bottom, all four ratios, and the prices and timestamps of all five pivots. Plug it into a webhook for Telegram, Discord, your own backend, whatever. This is what I use for scanning many charts at once and routing everything to a single notification stream.
12 named alert conditions — bullish/bearish × 6 patterns. If you just want "alert me on Crab patterns on this one chart" without messing with webhooks, these show up in TradingView's standard alert dialog.
Both fire on bar close only. No repainting.
Honest expectations on signal frequency
Harmonic patterns are rare on any single chart. Like, actually rare. Across my testing:
Daily timeframe, you might get 1-4 patterns per year on a single instrument
4H, maybe 5-15 patterns per month
Lower TFs (5m, 15m), dozens per week
This is by design — strict ratio checking filters out most of the 5-pivot zigzags that other indicators happily call "harmonic patterns." If you put HAV on one daily chart and stare at it for a week expecting signals, you will be disappointed.
The way this thing actually shines is across many charts at once. Drop it on 30+ instruments across daily and 4H, set up the unified JSON alert, route to a Telegram channel or Discord webhook, and let the patterns come to you. That's the workflow it's built for.
What it is and isn't
It is: a pattern detection and verification tool. A confluence/confirmation aid for traders who already have a setup and want to know if a harmonic pattern is also forming there. A teaching tool — the diagnostics show you exactly what's happening at every step.
It isn't: a complete trading system. There are no entry signals, no SL/TP automation, no win-rate claims. The decision to trade a pattern is yours, and Carney's books contain the actual entry/management methodology if you want to follow it strictly.
Settings worth knowing about
Tolerance Preset — start with Standard. If you're seeing too few patterns, try Lenient. If you're seeing too many low-quality ones, try Strict.
Min Score — default 6 keeps things clean. Drop to 4-5 if you want to see borderline geometry. Raise to 7-8 for highest-conviction-only.
Show Borderline Patterns — opt-in. Adds dashed/dimmed display for patterns that scored 4.0-5.9. Doesn't trigger alerts.
Log Scale — default Off. Carney's books and most charting tradition use linear-scale Fibonacci. If you're working on heavy long-term crypto charts where price moved by orders of magnitude, you might prefer "On" or "Auto."
S how Diagnostics Table — default On. Shows the detection statistics in the top-right. Toggle off if it's in the way of other indicators.
Show Distribution Stats — opt-in addition to the diagnostics. Useful if you're calibrating tolerances yourself or curious about an asset's natural retracement profile.
Patterns that aren't included
I deliberately didn't add Cypher, Shark, or 5-0 in this version. Cypher (Oglesbee) uses a completely different structural approach than the Carney patterns and didn't fit cleanly into the same scoring framework. Shark and 5-0 use OXABC labeling with C as the entry rather than D, which would have meant a parallel detection engine. Maybe in v1.1 if there's demand. The six patterns above cover the bulk of what shows up in real markets anyway.
Source notes
If you want to read the actual methodology this is implementing, the references are:
Scott M. Carney, "The Harmonic Trader" (1999) — the original self-published book where the framework first appeared, including the PRZ concept and the 0.886 retracement
Scott M. Carney, "Harmonic Trading Volume One" (2004, 2nd ed. 2010) — the formal Pearson/FT Press treatment, Bat pattern, ideal Gartley ratios, AB=CD requirements
Scott M. Carney, "Harmonic Trading Volume Two" (2007, 2nd ed. 2010) — Crab, Alt Bat, 5-0, RSI BAMM execution model, advanced patterns
Scott M. Carney, "Harmonic Trading Volume Three: Reaction vs Reversal" (2016) — execution refinement, Harmonic Strength Index, additional management strategies
H.M. Gartley's original 1935 "Profits in the Stock Market" is where the Gartley pattern itself was first described, but the specific Fibonacci ratios (0.618 / 0.786) were Carney's contribution decades later — Gartley used different proportions.
Feedback, bug reports, "this thing didn't draw a pattern that's clearly there" reports — all welcome in the comments. I'll be running this myself across crypto, forex, and indices, and the feedback loop is genuinely how this gets better.
The Good, the Bad and the Bitcoin Gösterge

Bullish Sweep & Reclaim for BTC M15Bullish Sweep & Reclaim — Indicator Summary
Disclaimer:
This indicator is tuned and tweaked to find entries on the bitcoin 15 minute time frame only, I have not tested it on any other asset or time frames. use it wisely and manage your TP and SL as the patterns form.
i have back tested this strategy till 2020 and have tweak the numbers to give the cleanest most promising setup, i suggest keeping all values in the settings the same. or if you're a pro, feel free to tweak it more and test it further and share back with me if you find better values.
Although this is a fractal setup which works on most time frames, it is only tuned to catch setups on the M15 Chart
Overview
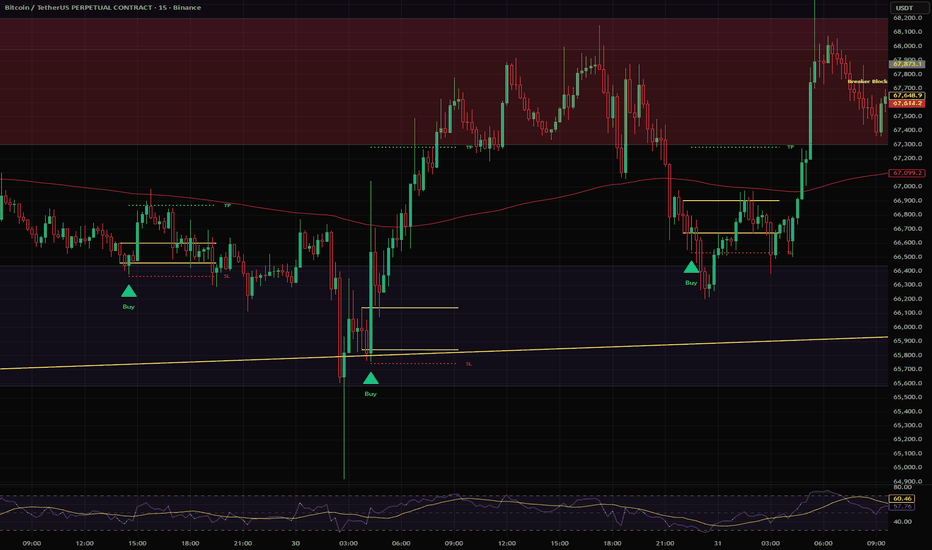
The Bullish Sweep & Reclaim indicator is a pattern-based tool built for the 15-minute timeframe, designed primarily around Bitcoin (BTC) price behavior. It identifies a specific three-leg liquidity grab sequence where the market flushes out stops below a recent low before reversing sharply back upward. The indicator marks these moments on the chart in real time, plotting a buy signal, a take profit level, a stop loss level, and the key price zone that anchors the setup.
The Core Pattern
The setup is built on three distinct candles, each playing a specific role.
The first leg is called the Drop Candle. This is a bearish candle that acts as the origin of the setup. It represents a meaningful downside move where sellers were in control. The Drop Candle establishes the key price range — its high and low are used later to define the take profit target and the zone that price must reclaim.
The second leg, C2, is any candle after the Drop Candle whose close falls below the Drop Candle's low. This confirms that selling pressure continued and that liquidity — in the form of stop loss orders from buyers — has been building up beneath that level.
The third leg, C3, is the signal bar. This is the current candle, and for the pattern to fire it must do two things simultaneously: its low must sweep below the C2 low, and it must close back above the Drop Candle's wick low. This combination signals that the market reached down to grab the liquidity sitting below those stops, then rejected sharply, with buyers stepping in and closing price back inside the prior range. This is the classic sweep and reclaim structure.
Drop Candle Filters
Because not every bearish candle is worth trading, the indicator includes a layered filter system to qualify the Drop Candle before it is used as the setup anchor. Each filter is independently toggled, giving full control over how strict the criteria are.
The RSI filter requires the RSI to be below a user-defined threshold at the time the Drop Candle forms, ensuring it occurred during genuine bearish momentum rather than a minor pullback. The default threshold is 54, which can be tightened to 45 or lower for fewer but higher-conviction signals.
The SMA filter requires the Drop Candle's low to pierce below a simple moving average — defaulting to the 100-period SMA. This ensures the candle pushed into a statistically significant area of price, filtering out shallow dips that lack structural importance.
The VWAP filter requires the Drop Candle to close below the session VWAP. Since VWAP represents the average price weighted by volume, a close below it confirms the candle formed in a bearish value zone rather than above fair value.
The Bollinger Band midline filter requires the Drop Candle's low to be below the BB basis — the 20-period SMA at the center of the Bollinger Bands. This adds a volatility-adjusted confirmation that the candle extended meaningfully below the midpoint of recent price action.
Optional filters include an EMA close filter and a volume multiplier filter, both disabled by default but available for further precision.
Exit Levels
When the pattern fires, the indicator automatically calculates and plots both a take profit and a stop loss.
The stop loss is placed just below the sweep low with a small configurable buffer.
The take profit has four options: the Drop Candle's high, or the Drop Candle's range extended by 1.5×, 2.5×, or 3× from the entry close.
Two solid yellow horizontal lines mark the Drop Candle's high and low zone on the chart for visual reference.
Alerts
A built-in alert condition fires on every valid signal, making it straightforward to set up TradingView notifications for any ticker or timeframe without needing to watch the chart continuously. Gösterge
Volume Displacement Engine [JOAT]Volume Displacement Engine
Introduction
Volume Displacement Engine (VDE) is an open-source volume regime oscillator that measures the ratio of short-term volume activity to long-term volume baseline, smooths it into a clean oscillator, and classifies current market activity into four distinct regimes: Low, Normal, High, and Extreme. The histogram and background tint update in real time with regime-specific coloring, reference lines mark each threshold boundary, and breakout signals fire when price closes beyond a rolling high or low during elevated volume regimes. A consolidation detection layer identifies consecutive low-volume bars as ranging periods. Trade outcomes from breakout signals are tracked for statistical win rate context, displayed in a structured dashboard.
The core problem VDE solves is the absence of context in standard volume indicators. Raw volume bars communicate size but not relevance — a large bar on a trending instrument in a high-liquidity session is very different from the same bar during off-hours. By expressing volume as a ratio to a rolling baseline and classifying it into regimes, VDE communicates whether current activity is institutionally significant (High or Extreme) or routine (Normal/Low). Price breakouts during High or Extreme volume are fundamentally different propositions than the same price moves on thin volume — VDE makes that distinction explicit and actionable.
Core Concepts
1. Volume Ratio Oscillator
The core calculation divides a short-term volume simple moving average by a long-term volume simple moving average, then applies an EMA smoothing pass to reduce bar-to-bar noise:
float rawRatio = volShort / math.max(volLong, 1.0)
float volRatio = ta.ema(rawRatio, i_smoothLen)
A ratio above 1.0 means recent volume is above the long-term average — activity is elevated. A ratio below 1.0 means recent volume is below the baseline — activity is depressed. The smoothing EMA gives the oscillator a cleaner shape while maintaining responsiveness to regime changes.
2. Four-Tier Regime Classification
Four threshold boundaries define the regime tiers. All thresholds are fully configurable:
Low: Ratio below the low threshold (default: 0.70) — below-average activity, reduced institutional participation
Normal: Ratio between low and normal ceiling (default: 0.70–1.20) — baseline activity
High: Ratio between normal ceiling and high threshold (default: 1.20–1.80) — elevated activity, potential institutional flow
Extreme: Ratio above the high threshold (default: 1.80+) — exceptional volume surge, likely significant price event
3. Breakout Signal Detection
Breakout signals are generated when price closes beyond the rolling highest high or lowest low of the configurable lookback window during a High or Extreme volume regime. This combines price displacement with volume confirmation, filtering out low-conviction breakouts that occur on thin volume:
bool bullBreak = barstate.isconfirmed and close > hh and (isHigh or isExtreme)
bool bearBreak = barstate.isconfirmed and close < ll and (isHigh or isExtreme)
4. Consolidation Detection
When multiple consecutive bars fall below the consolidation volume threshold, VDE identifies the period as a consolidation zone. The minimum bar count ensures short dips below the threshold are not misclassified as ranges. A dotted reference line marks consolidation periods in the oscillator pane, providing context for identifying compression before expansion moves.
5. Gradient Fill and Regime Tint
The oscillator histogram is colored to match the current regime. A fill between the histogram and the 1.0 baseline uses the regime color with transparency, providing a visual area representation of volume expansion or contraction. During High and Extreme regimes, a background tint activates in the oscillator pane to immediately draw attention to elevated activity periods without requiring inspection of the histogram height.
Features
Volume Ratio Oscillator: Short/long MA ratio smoothed by EMA — measures relative volume displacement from baseline
Four-Tier Regime Classification: Low, Normal, High, and Extreme regimes with independent color coding and configurable thresholds
Histogram Coloring: Bar color matches current regime — immediate visual reading of activity level
Regime Background Tint: High and Extreme volume periods highlighted with a pane background color for immediate attention
Threshold Reference Lines: Horizontal dashed lines at each regime boundary and at the 1.0 baseline for quick ratio reading
Gradient Regime Fill: Fill between oscillator and baseline communicates expansion/contraction area visually
Price Breakout Signals: Bull and bear breakout signals fire when price closes beyond rolling extremes during elevated volume regimes only
Consolidation Detection: Consecutive below-threshold volume bars identified as consolidation periods
Breakout Win Rate Tracking: Outcomes from breakout signals tracked against ATR-based TP/SL levels for statistical context
Non-Repainting: All signals gated on barstate.isconfirmed
Dashboard (Top Right): Current regime label, vol ratio value, consolidation status, and win rate breakdown for High and Extreme regime breakouts
Vol Momentum Columns: 3-bar rate-of-change of the vol ratio displayed as green/red column bars in the oscillator pane — shows whether volume activity is accelerating or decelerating relative to 3 bars prior
Rolling 20-Bar Vol Ratio Peak Reference Line: A purple reference line tracks the rolling 20-bar peak vol ratio — provides a visual ceiling for recent activity levels and highlights when the current ratio is approaching or exceeding recent extremes
Vol Ratio Delta in Dashboard: Vol ratio delta shown in real time in the dashboard with a directional arrow (▲/▼) — communicates whether volume pressure is building or fading on the current bar
CONS Label on Consolidation Start: A "CONS" label fires at the bar when a consolidation zone begins — marks the exact start of identified compression periods directly on the oscillator
Breakout Strength Labels: "BRK +X.XX" and "BRK -X.XX" labels appear at each breakout signal showing the vol ratio value at the moment of the break — communicates the institutional conviction level behind each breakout directly on the chart
Input Parameters
Volume Engine:
Short Vol Window: Short-term volume MA period (default: 10)
Long Vol Window: Long-term volume MA period (default: 40)
Ratio Smooth: EMA smoothing length for ratio (default: 3)
Low Vol Threshold: Ratio below which regime is Low (default: 0.70)
Normal Vol Ceiling: Ratio above which regime is High (default: 1.20)
High Vol Threshold: Ratio above which regime is Extreme (default: 1.80)
Consolidation:
Consolidation Window: Lookback window for consolidation range (default: 8)
Consolidation Vol Max: Maximum ratio to qualify as a consolidation bar (default: 0.80)
Min Consolidation Bars: Minimum consecutive qualifying bars to declare consolidation (default: 4)
Breakout Signal:
Breakout Lookback: Rolling high/low lookback window (default: 20)
ATR Length: Period for ATR calculation (default: 14)
ATR SL Multiplier: Stop loss distance (default: 1.5)
Reward:Risk Ratio: TP multiple (default: 3.0)
Show TP/SL Labels: Toggle label display in the oscillator pane (default: enabled)
How to Use This Indicator
Step 1: Read the Regime
Glance at the dashboard regime label and histogram color. A grey histogram (Low) indicates the market is in a quiet, low-participation period — avoid breakout strategies during these windows. A teal histogram (Normal) is baseline. An amber histogram (High) or red (Extreme) signals institutional-grade activity.
Step 2: Identify Consolidation Periods
When the dotted consolidation line is active in the oscillator pane, the market is in a low-volume compression phase. These periods typically precede expansion moves — the direction of the subsequent breakout, confirmed on volume, is a key signal.
Step 3: React to Breakout Signals
Breakout signals (triangles at the top/bottom of the oscillator pane) only fire during High or Extreme regimes. When a bull breakout label appears, price has closed above the rolling high on elevated volume — a confirmed displacement. The ATR TP/SL levels from that bar define the immediate risk/reward.
Step 4: Monitor the Ratio Trend
The oscillator line trending upward while above 1.0 indicates sustained institutional accumulation of activity — these sustained elevated periods often coincide with trending phases. A declining ratio from Extreme back toward Normal often signals activity exhaustion.
Indicator Limitations
Volume data quality varies significantly by instrument and data provider. On synthetic instruments, indices, or assets where volume reflects contract count rather than notional size, the ratio will not accurately represent true monetary volume displacement
TP/SL outcome tracking in the oscillator pane uses price data for TP/SL hit detection but displays in the volume pane — the label positions are approximate visual markers, not precise price levels on the main chart
The consolidation detector uses a fixed volume threshold. In trending markets where baseline volume rises over time, the historical consolidation threshold may not match current market conditions without recalibrating the threshold input
Breakout signals require both a price breakout and an elevated volume regime simultaneously. In markets with persistently high volume baselines (e.g., during major economic event periods), the Extreme threshold may trigger more frequently than on typical days — the thresholds may need upward adjustment on those instruments
The short/long MA window ratio is a relative measure. It compares recent volume to a historical baseline — it does not measure absolute volume in shares, contracts, or dollars
Originality Statement
VDE combines a smoothed relative volume ratio oscillator with a four-tier classification framework, consolidation detection, and volume-gated breakout signals in a unified indicator. This is original for the following reasons:
Expressing volume as a ratio of short-term to long-term moving average — rather than showing raw volume bars — normalizes the oscillator across instruments and timeframes, making the same threshold values meaningful on a liquid equity, a commodity, and a cryptocurrency without manual recalibration
The four-tier classification system with independently configurable thresholds and a gradient color scheme provides a richer regime reading than simple volume-above-average/below-average binary indicators
Volume-gated breakout detection explicitly requires the price breakout and the volume regime elevation to occur simultaneously on the same confirmed bar — preventing breakout signals from firing on thin-volume price moves that carry low institutional conviction
The consolidation detection layer adds a compression-identification capability within the volume pane, providing context for identifying low-activity ranging periods before the volume regime shifts to support a directional move
Disclaimer
This indicator is provided for educational and informational purposes only. It is not financial advice or a recommendation to buy or sell any financial instrument. Trading involves substantial risk of loss. Volume regime classification and breakout signals are statistical constructs — elevated volume at a price breakout does not guarantee continuation in the breakout direction. Win rate statistics are derived from historical bar data and do not predict future performance. Always apply proper risk management. The author is not responsible for any trading losses resulting from the use of this indicator.
-Made with passion by jackofalltrades
Gösterge

Segmented Pressure Bands [JOAT]Segmented Pressure Bands
Introduction
Segmented Pressure Bands (SPB) is an open-source, institutional-grade regression channel system that computes a linear best-fit line and deviation bands from scratch using manual Ordinary Least Squares (OLS) mathematics — no built-in regression functions used. The channel operates in distinct segments: it builds over a dynamic lookback window, freezes all parameters at a minimum length threshold, extrapolates forward using the frozen slope and intercept, and resets automatically when price closes beyond the outer deviation band. Gradient linefill layers between the basis and outer bands communicate channel pressure visually. A volume regime tint adjusts visual weight based on relative volume activity, and ATR-based TP/SL visualization is drawn on each breakout reset.
The core problem SPB solves is that standard regression channels repaint continuously as new bars add to the calculation window, making historical channel boundaries unreliable for reference. SPB's freeze-and-extrapolate architecture locks the regression parameters at a fixed point in time, then projects the channel forward. Price that deviates far enough from that projection triggers a segment reset — the channel is redrawn from the breakout point. This creates a clear, non-repainting record of each regression segment and the breakout that ended it.
Core Concepts
1. Manual OLS Linear Regression
The regression is computed using the standard Ordinary Least Squares normal equations applied to the source series over the active lookback window:
float denom = float(length) * sumX2 - sumX * sumX
slope := (float(length) * sumXY - sumX * sumY) / denom
intercept := (sumY - slope * sumX) / float(length)
RMSE (root mean square error) is calculated as the deviation of the source from the fitted line, providing the basis for band width. All accumulator variables (sumX, sumY, sumXY, sumX2) are computed in a per-bar loop, giving full control over the calculation window without relying on built-in functions that may change behavior across versions.
2. Channel Freeze and Extrapolation
When the lookback window reaches the minimum length threshold, the slope, intercept, and RMSE are locked into freeze variables. From that point forward, the x-coordinate passed to the regression formula is the number of bars elapsed since the freeze bar, allowing the channel to project forward without recalculating:
float xCur = -float(bar_index - freezeBar)
basis := frozenIcpt + frozenSlope * xCur
This extrapolation means the bands continue to move with the slope direction, but their relative spacing (the RMSE deviation) remains constant from the freeze point.
3. Segment Reset on Breakout
When a candle closes beyond the outer upper or lower band, the current segment is terminated. The channel redraws from the current bar using the fresh source data from that point forward. Old linefill objects are explicitly deleted before new ones are created to stay within Pine Script's object limits.
4. Gradient Linefills and Volume Regime Tint
N intermediate lines are drawn between the basis and each outer band, filled progressively with increasing transparency from the inner region to the outer edge. This creates a gradient pressure visualization — tighter fills near the basis signal equilibrium, wider fills near the outer band signal stretch. When the volume regime ratio (short-term MA / long-term MA) is elevated above the high threshold, line widths increase and fill opacity deepens to communicate high-activity conditions visually.
Features
Manual OLS Regression: Slope, intercept, and RMSE computed entirely from first principles — no built-in regression functions
Freeze and Extrapolate Architecture: Regression parameters locked at minimum length; channel projected forward along the locked slope
Automatic Segment Reset: Outer band close-beyond triggers segment restart — prior segment preserved as a historical record
RMSE Deviation Bands: Upper and lower bands placed at configurable RMSE multiples from the basis line
Gradient Linefill Layers: N intermediate lines fill the channel space with a visual pressure gradient — configurable step count
Volume Regime Tint: Relative volume ratio (short/long MA) adjusts visual weight — elevated volume deepens channel fills and thickens lines
ATR TP/SL Visualization: On each breakout reset, ATR-based take profit and stop loss boxes drawn from the breakout close
Channel Direction Color: Downward slope (bullish context — price above a declining regression) renders in teal; upward slope (bearish context) renders in rose
Non-Repainting Basis: Freeze architecture ensures historical segment boundaries do not move after they are drawn
Configurable Source: Basis line source is selectable (close, hl2, hlc3, ohlc4, etc.)
Dashboard (Top Right): Current slope, RMSE, volume regime label, band multiplier, and active segment bar count
Near-Band Warning Dots: Subtle circle markers appear on the chart when price is within 12% of either channel edge — early warning that price is approaching a band extreme before a breakout occurs
Distance-to-Nearest-Band in Dashboard: Current distance from price to the nearest band displayed as a percentage of channel width — provides a precise quantitative read of how stretched or compressed the current position is within the segment
Live Regression Slope in Dashboard: Live regression slope value shown in the dashboard — communicates the current directional angle of the frozen channel projection in real time
Breakout Win/Loss Tracking: Outcome of every breakout trade tracked against ATR-based TP/SL levels — total breakout trade count and cumulative win rate displayed in the dashboard
Expanded Dashboard (7 Rows): Dashboard expanded to 7 rows — now includes distance-to-band percentage, live slope, and breakout win rate alongside existing regime and segment data
Input Parameters
Regression Settings:
Source: Price input for regression calculation (default: close)
Lookback Length: Maximum bar window for OLS computation (default: 50)
Min Length to Freeze: Bar count at which slope/intercept are locked (default: 20)
Band Multiplier: RMSE multiple for outer band placement (default: 2.0)
Gradient Settings:
Gradient Steps: Number of intermediate fill lines between basis and outer band (default: 5)
Volume Regime:
Short Vol MA: Short-term volume moving average length (default: 10)
Long Vol MA: Long-term volume moving average length (default: 40)
High Vol Threshold: Vol ratio above which volume tint activates (default: 1.5)
ATR / Risk:
ATR Length: Period for ATR calculation (default: 14)
ATR SL Multiplier: Stop loss distance on breakout (default: 1.5)
Reward:Risk Ratio: Take profit multiple of stop distance (default: 3.0)
How to Use This Indicator
Step 1: Read the Channel Direction
A teal channel indicates a downward-sloping regression — price is above a declining trend line, suggesting bullish pressure within the distribution. A rose channel indicates an upward-sloping regression — price is below a rising channel ceiling, suggesting bearish pressure. The gradient fills communicate how far price has deviated from the basis within that segment.
Step 2: Trade Within the Channel
Price compressing toward the basis from an outer band (thin fill region narrowing) suggests mean reversion is underway. Price expanding toward the outer band (fills widening) suggests momentum continuation. The outer band itself acts as a stretch boundary — closes beyond it trigger a new segment.
Step 3: React to Breakout Resets
When a segment resets, the breakout bar is the reference point for directional bias. The ATR TP/SL boxes visualize the immediate risk/reward from that close. The new channel building from the breakout will establish the next directional context.
Step 4: Monitor Volume Context
Elevated volume regime (shown in dashboard) at a channel boundary gives more conviction to breakout or reversal signals. Low-volume channel touches carry less institutional weight.
Indicator Limitations
The OLS calculation runs a loop over the lookback window on every bar. On very long lookback lengths with high chart data density, this may increase script execution time — keep lookback below 200 for best performance
The freeze architecture means the channel projection can diverge significantly from price if the instrument trends strongly after the freeze point. Segment resets bring the channel back to current price, but wide outer bands may delay that reset on low-volatility instruments
Gradient linefills are subject to Pine Script's 50-linefill object limit. SPB manages this with explicit deletion on each segment reset. If the gradient steps setting is set very high (above 10), this limit may be approached in active markets
ATR TP/SL boxes on breakout are drawn from the breakout close. They do not adjust for gaps, overnight moves, or instrument-specific spread — manual adjustment of the ATR multiplier may be needed for highly volatile instruments
Volume regime calculation uses simple moving averages of volume. On instruments where volume data is synthetic or unavailable, the regime indicator will not reflect true market activity
Originality Statement
SPB implements a regression channel with a freeze-extrapolate-reset lifecycle that produces stable, non-repainting historical segment boundaries. This design is original for the following reasons:
Computing OLS slope, intercept, and RMSE from scratch using raw accumulator mathematics — rather than using ta.linreg() or similar built-ins — gives full control over the calculation window, source, and update behavior, and avoids implicit look-ahead that some built-in functions can introduce
The freeze-and-extrapolate architecture is distinct from standard rolling regression, where every new bar shifts the entire historical channel. Once frozen, SPB's channel parameters are immutable — historical band boundaries drawn in past segments are permanent reference levels
The gradient linefill layer system communicates statistical deviation pressure visually across the full channel width, rather than drawing only a basis and outer band with no information about the space between them
The integration of a volume regime tint directly into the regression channel visualization — adjusting visual weight based on relative volume — provides immediate context for whether current channel position is occurring during active or quiet market conditions
Disclaimer
This indicator is provided for educational and informational purposes only. It is not financial advice or a recommendation to buy or sell any financial instrument. Trading involves substantial risk of loss. Regression channels and statistical deviation bands are mathematical constructs applied to historical data — they do not predict future price behavior. Breakout signals at band extremes do not guarantee continuation in any direction. Always apply proper risk management. The author is not responsible for any trading losses resulting from the use of this indicator.
-Made with passion by jackofalltrades
Gösterge

ABCD Projection Zones [AGPro Series]ABCD Projection Zones
🔹 OVERVIEW
ABCD Projection Zones is a premium price-action projection tool built for traders who want a clean ABCD pattern map without turning the chart into a full harmonic scanner, Auto Fib suite, retracement dashboard, or broad pattern-recognition system.
The script focuses on one specific market-structure idea: a confirmed A-B-C swing sequence can project a forward D completion area when the A-B leg is measured from point C. Instead of plotting a single thin target line, the script converts that measured move into a practical projected completion zone. This makes the result easier to read on real charts where reactions often happen around an area rather than at one exact tick.
The tool detects the structure, measures the leg relationship, projects the completion zone, tracks the distance to that zone, and then follows the reaction lifecycle after price reaches it. The goal is a premium, readable ABCD projection workflow that helps traders understand where the current structure is, how mature it is, and how price is behaving around the projected completion area.
🔹 WHAT MAKES IT DIFFERENT
Many ABCD, projection, and pattern tools try to do too much at once. They combine multiple Fibonacci ratios, harmonic pattern names, extended target ladders, retracement grids, reversal labels, and broad pattern scanning into one chart overlay. That can look busy, but it often makes the active structure harder to understand.
ABCD Projection Zones takes a narrower and cleaner route.
It does not attempt to label every harmonic family.
It does not expose a full Fibonacci framework.
It does not place several competing projection targets on the chart.
It does not turn the layout into a generic support and resistance map.
The difference is the focused lane: confirmed ABCD swing projection, one projected completion zone, one reaction lifecycle, and a concise panel that explains the active setup.
The visual language is also different. The D area is shown as a forward rectangle with centered zone text inside the box. Active and archived zones stay named, labels use consistent sizing, and archived context remains muted so the active projection remains dominant.
🧭 WHY THIS DOES NOT OVERLAP WITH OTHER AGPRO TOOLS
This script is intentionally separated from other AGPro tools by scope, visual behavior, and analytical purpose.
It is not an Auto Fib Structure tool. It does not publish multiple retracement and extension levels, does not expose a full Fib grid, and does not present itself as a broad Fibonacci framework.
It is not a harmonic scanner. It does not label Gartley, Bat, Butterfly, Crab, Shark, or other harmonic families. It does not rank multiple harmonic candidates or compare pattern families.
It is not a generic support and resistance zone script. The rectangles are not general S/R zones. They are specifically ABCD completion and reaction zones derived from swing-leg symmetry.
It is not a trend dashboard, volatility map, liquidity sweep scanner, or broad price-action suite. Its job is only to map a confirmed A-B-C structure into a projected D completion zone and monitor the reaction state around that zone.
This makes the public release lane clear: a focused ABCD projection and reaction-zone tool for measured-move structure, not a duplicate of existing AGPro zone, Fib, S/R, harmonic, or dashboard concepts.
⚙️ METHODOLOGY
The script starts by detecting confirmed swing highs and lows using pivot-based structure logic. This gives the model cleaner A, B, and C points and helps reduce random candle noise.
After the A-B-C sequence is confirmed, the script measures the A-B leg and the B-C pullback. The B-C pullback is evaluated as a ratio of A-B, but this ratio is used as a structure-quality filter, not as a visible Fibonacci grid.
The projected D area is calculated by applying the A-B leg from point C. This creates an AB=CD style measured-move projection. The projected D price is then expanded into a rectangle using ATR-based padding so the completion area behaves like a practical reaction zone rather than a thin target.
The script then tracks the active projection lifecycle:
- Waiting: price has not yet approached the projected zone.
- Approaching: price is close enough to the zone to matter.
- Completed: price has reached the projected D area.
- Reacting: price is moving away from the zone after contact.
- Overrun: price has moved beyond the zone buffer.
- Expired: the projection window passed without completion.
The scoring model combines impulse quality, pullback quality, and structural alignment into a 0-100 score. This score is not a standalone signal; it is a compact way to summarize the quality of the active ABCD projection structure.
📊 PANEL
The AGPro panel is designed for quick chart reading without forcing the trader to inspect every object manually.
Panel fields:
- Leg Ratio: shows the B-C pullback size relative to A-B.
- Completion Distance: shows the current distance to the projected D zone in price and ATR terms.
- Reaction State: shows the active lifecycle state of the projection.
- Symmetry Quality: classifies the active setup as Weak, Developing, Clean, or Strong with directional context.
- Projection Progress: shows how far price has traveled from point C toward the projected D area.
- Score: summarizes the active setup quality from 0 to 100.
Panel standards:
- The first row is one merged blue AGPro header row.
- The header contains only the panel title.
- Panel location is adjustable.
- Panel theme is adjustable.
- Panel font size is adjustable.
🎛️ KEY INPUTS
Detection:
- Swing Left Strength
- Swing Right Strength
- ATR Length
- Minimum AB Leg Size ATR
- Minimum BC Pullback Ratio
- Maximum BC Pullback Ratio
Projection Zone:
- Projection Length Bars
- Zone Padding ATR
- Approach Distance ATR
- Overrun Buffer ATR
- Zone Fill Transparency
- Archived Zones
- Archived Zone Transparency
- Show Text Inside Zones
Visuals:
- Show ABCD Path
- Show ABCD Labels
- Show Completion Marker
- Label Font Size
- Label Offset ATR
- Completion Marker Offset Bars
Panel:
- Show Panel
- Panel Location
- Panel Theme
- Panel Font Size
🔍 HOW TO READ IT
Start with the A-B-C labels. Point A and point B define the impulse leg. Point C defines the pullback from which the measured-move projection begins.
The dotted projected path shows the C-D measured move. The forward rectangle marks the projected completion zone. If price is still far from that rectangle, the panel will usually show Waiting and a lower Projection Progress value.
As price moves toward the rectangle, Projection Progress increases and the Completion Distance decreases. When price reaches the zone, the script marks D Hit and changes the lifecycle state. After that, the most important reading is whether the zone becomes a Reaction Zone or an Overrun Zone.
Archived zones should be read as context, not as the main decision layer. They show previous projected reaction areas in a muted style so the chart does not feel empty, but the active zone remains the priority.
🧩 BEST USE CASES
This script is best suited for traders who study market structure, measured moves, swing projection, ABCD patterns, and reaction-zone behavior.
Strong use cases include:
- Mapping a clean ABCD completion area after a confirmed A-B-C structure.
- Tracking how close price is to a projected D area.
- Separating developing projections from completed projections.
- Watching for reaction behavior after price reaches a projected completion zone.
- Reviewing recent projected zones without overcrowding the chart.
- Keeping a clean price-action workflow without a full harmonic or Fib suite.
The script can be useful across different markets and timeframes, but it is most readable when swing structure is clear enough for pivot-based detection to identify meaningful A-B-C sequences.
🧠 VISUAL DESIGN PHILOSOPHY
The visual design is built around premium restraint.
The chart should not be empty, but it should also not be overloaded. The active ABCD projection needs to stand out clearly, while archived zones should provide background context without taking attention away from the current structure.
Visual standards used in this script:
- Active completion and reaction zones are drawn as forward rectangles.
- Zone text is written inside the rectangle.
- Zone text is horizontally and vertically centered.
- Zone text uses transparent label-center styling instead of extra external tags.
- Active and archived zone text uses the same label font-size control.
- Swing labels are offset with ATR so they do not sit inside candle bodies.
- The completion marker is compact and shifted away from nearby swing labels.
- The projected C-D path is visible but not visually dominant.
- Archived zones are muted to keep the active projection clean.
The result is a chart that communicates structure, projection, and reaction state without looking like a crowded signal board.
🔔 ALERTS
Included alert conditions:
- New ABCD Projection Zone: triggers when a new qualified ABCD projection is detected.
- ABCD Completion Reached: triggers when price reaches the active projected completion zone.
- ABCD Reaction Confirmed: triggers when price reacts away from the active completion zone.
- ABCD Zone Overrun: triggers when price moves beyond the configured zone buffer.
🔹 LIMITATIONS AND TRANSPARENCY
The script waits for confirmed pivot structure, so A, B, and C labels appear after swing confirmation rather than at the exact live turning point.
The projected D area is based on AB=CD symmetry and ATR-based zone padding. It is designed to map structure and reaction context, not to predict every reversal.
The script intentionally avoids a full harmonic library and full Fibonacci framework. This is a design choice, not a missing feature. The goal is to keep the public tool focused on ABCD projection zones.
During choppy or low-structure conditions, fewer clean setups may appear. Increasing or decreasing swing strength and leg-size filters can make the tool more selective or more responsive depending on the market and timeframe.
✅ IDEAL USER
This script is designed for traders who prefer clean structure tools over crowded all-in-one indicators.
The ideal user:
- Studies price action and swing structure.
- Wants a focused ABCD projection tool.
- Prefers zones over single-line targets.
- Wants reaction-state context after completion.
- Values clean chart presentation.
- Wants adjustable labels, panel location, and visual density.
- Does not want a full harmonic scanner or public Auto Fib suite.
ABCD Projection Zones is built for traders who want one clean projected completion lane: A-B-C structure, measured D zone, reaction state, and a premium AGPro visual presentation. Gösterge

Impulse Structure Zones [JOAT]Impulse Structure Zones
Introduction
Impulse Structure Zones (ISZ) is an open-source, institutional-grade zone engine that detects statistically significant price impulses using a Z-Score methodology, identifies the origin candle of each impulse as an order block, and grades each zone using a multi-factor wick rejection scoring system. Bullish and bearish zones are tracked in parallel arrays with full lifecycle management — creation, extension, mitigation detection, and rejection confirmation — all rendered as clean, non-repainting boxes on the chart with a mid-line bisecting each zone.
The core problem ISZ solves is the manual process of locating high-probability order block zones on a chart. Institutional price delivery frequently originates from specific candles where large orders were placed — the last opposing candle before a strong directional move. ISZ automates the detection of those moves, marks the origin candles, and then monitors each zone to fire a graded rejection signal when price returns to test the level. Grades A, B, and C communicate signal quality based on wick dominance, proportional wick depth, volume confirmation, and candle size relative to ATR.
Core Concepts
1. Z-Score Impulse Detection
Price change is measured bar-by-bar as a percentage move and normalized into a Z-Score against a rolling mean and standard deviation window:
float pxChg = (close - close ) / close * 100.0
float zscore = (pxChg - avgChg) / math.max(stdChg, 0.0001)
A bar qualifies as an impulse when the absolute Z-Score exceeds the user-defined threshold (default: 1.5). This isolates moves that are statistically unusual relative to recent activity — the same principle used in quantitative strategies to filter meaningful displacement from noise. All signals are gated on barstate.isconfirmed to prevent repainting.
2. Order Block Identification
When a bullish impulse is confirmed, ISZ scans back through recent bars to locate the last bearish candle (close < open) before the move. That candle's high and low become the order block zone boundaries. For bearish impulses, the last bullish candle is used. This matches the ICT definition of an order block — the final imbalance candle before institutional displacement.
3. Zone Lifecycle Management
Each zone is stored as a user-defined type (UDT) containing the box object, mid-line, price boundaries, birth bar, direction, mitigation flag, and rejection flag. Zones extend rightward on each bar until price closes beyond the zone (mitigation), at which point the box is frozen and marked as mitigated. A maximum zone count is enforced and oldest zones are trimmed to maintain chart performance.
4. A/B/C Rejection Grading
When price returns to test a live zone and a rejection candle forms, ISZ grades the signal quality using four independent scoring factors:
Wick dominance ratio: The rejection wick length divided by candle body size
Proportional wick depth: The wick as a percentage of the total candle range
Volume confirmation: Current bar volume compared to the 20-bar average
Candle size vs ATR: Whether the rejection candle is of meaningful size relative to recent volatility
A total score of 6+ = Grade A, 4-5 = Grade B, below 4 = Grade C. Grade is displayed as a label on the rejection bar.
Features
Z-Score Impulse Engine: Statistically filters price moves against a rolling mean/standard deviation window — configurable length and threshold
Automatic Order Block Detection: Last opposing candle before each confirmed impulse identified and stored as a zone
Bidirectional Zone Tracking: Bullish (demand) and bearish (supply) zones managed in separate arrays with independent colors
A/B/C Rejection Grading: Four-factor scoring system labels each zone test with a quality grade
Zone Mitigation Detection: Zones that are fully closed through are frozen and visually distinguished from active zones
Mid-Line Reference: Each zone box includes a dashed mid-line at the 50% level — institutional equilibrium reference
ATR Proximity Filter: Rejection signals only fire when price is within a configurable ATR multiple of the zone
Volume Confirmation: Optional volume filter requires above-average volume at rejection for grading
Non-Repainting: All signals gated on barstate.isconfirmed — no look-ahead bias
Zone History Limit: Oldest zones automatically removed when the maximum count is reached to maintain performance
Dashboard (Top Right): Active bull/bear zone counts, last signal grade, last impulse Z-Score, and ATR — updated on each bar
Live Z-Score Candle Gradient Coloring: Impulse candles colored teal or rose based on Z-Score strength — immediately identifies statistically significant displacement bars on the chart
ATR Band Plots Around EMA 750: Visual upper and lower extremity zones drawn as ATR-based bands around the 750-period EMA — communicates when price is at macro stretch relative to the long-term anchor
RR Trade Boxes on Rejection Signals: Auto-generated SL/TP boxes on every rejection signal — 1.5× ATR stop loss with 3:1 reward-to-risk ratio, extending forward from the signal bar
Session Win Rate Tracking: Asia, London, and NY win rates tracked independently for rejection trades — outcome recorded against each signal's ATR-based TP/SL levels
Best Session Highlight: Dashboard automatically identifies and highlights the highest win-rate session across all three windows
Expanded Dashboard (9 Rows): Dashboard expanded to 9 rows — now includes live Z-Score reading, total impulse count, and full session win rate breakdown alongside existing zone and signal data
Input Parameters
Z-Score Settings:
Z-Score Length: Rolling window for mean and standard deviation calculation (default: 20)
Z-Score Threshold: Minimum absolute Z-Score required to qualify as an impulse (default: 1.5)
Zone Settings:
Max Active Zones: Maximum number of zones tracked simultaneously per direction (default: 8)
Bull Zone Color / Bear Zone Color: Independent colors per direction
Rejection Settings:
ATR Proximity (multiplier): How close price must be to a zone to trigger rejection check (default: 0.5)
ATR Length: Period for ATR calculation (default: 14)
Require Volume Confirmation: Toggle — above-average volume required for Grade A
How to Use This Indicator
Step 1: Identify Active Zones
Active bullish zones (demand) appear below price in teal. Active bearish zones (supply) appear above price in rose. Mitigated zones are visually dimmed. Focus on zones that have not yet been tested — these are the most relevant levels for future price interaction.
Step 2: Wait for Price to Return to the Zone
ISZ does not generate entry signals on impulse creation. It monitors active zones for return tests. When price pulls back into a zone, watch for the rejection grading label to appear.
Step 3: Grade the Signal
An A-grade rejection at a fresh, unmitigated zone is the highest-quality setup. B-grade is acceptable with additional confluence. C-grade rejections at already-tested zones carry the least weight. Use the grade in combination with your own bias and higher-timeframe analysis.
Step 4: Monitor the Dashboard
The dashboard shows active zone counts, last Z-Score, last grade, and ATR. A high Z-Score at impulse creation indicates an unusually strong move — those zones tend to attract more significant future tests.
Indicator Limitations
Z-Score impulse detection requires sufficient historical bars (at least 2× the Z-Score length) to produce accurate statistics — on very short chart histories the first few zones may form under unstable conditions
Order block detection scans back a fixed number of bars (configurable). In fast-moving markets where multiple candles are the same color, the scan may place the zone further back than an analyst would manually
Rejection grading uses volume data. On instruments with synthetic or unreliable volume (e.g., some CFDs, synthetic indices), the volume scoring component will not reflect true market activity
Zones do not account for gap fills, overnight moves, or after-hours sessions — a zone that appears unmitigated on the chart may have been effectively traded through outside of regular hours depending on the instrument
The A/B/C grading is a quantitative scoring system, not a certainty measure. Grade A signals do not guarantee price continuation in the expected direction
Originality Statement
ISZ combines Z-Score statistical impulse detection with origin-candle order block identification and a multi-factor rejection grading system in a single, self-contained indicator. This combination is original for the following reasons:
The use of a Z-Score normalized against a rolling mean and standard deviation — rather than a fixed pip or percentage threshold — makes impulse detection adaptive to current market volatility. The same threshold parameter behaves consistently across instruments and timeframes without requiring manual recalibration
The A/B/C grading system applies four independent quantitative factors (wick dominance, wick proportion, volume, candle size) simultaneously to classify signal quality at the point of zone interaction — rather than simply marking every return to a zone as equal
Zone lifecycle management (create → extend → mitigate → reject → trim) is handled automatically through UDT arrays with in-place field mutation, eliminating the need for manual zone maintenance or re-drawing
The combination of impulse detection, zone creation, and rejection grading in a single engine — with a unified dashboard — removes the need to layer multiple indicators to accomplish the same workflow
Disclaimer
This indicator is provided for educational and informational purposes only. It is not financial advice or a recommendation to buy or sell any financial instrument. Trading involves substantial risk of loss. Order block zones are historical reference levels and do not guarantee that price will react at those levels. A/B/C grades reflect quantitative scoring and do not predict future price movement. Always apply proper risk management. The author is not responsible for any trading losses resulting from the use of this indicator.
-Made with passion by jackofalltrades
Gösterge

Wave Navigator Cycle [Adaptive] Wave Navigator Cycle
Overview
The Wave Navigator System is a comprehensive technical indicator designed to trade the "Distorted Cycle." Unlike traditional indicators that lag behind price, this system uses an Adaptive Sine Wave to map out market phases in real-time, helping traders identify when the market is in a state of Preparation, Expansion (Ride the Wave), or Distribution.
This tool integrates high-probability Smart Money Concepts (SMC) including Liquidity Sweeps, Displacement, and Fair Value Gaps (FVG) to provide a complete roadmap for trend following and reversal trading.
Key Features
1. Adaptive Sine Wave Cycle
At the core of this indicator is a dynamic sine wave anchored to an ALMA (Arnaud Legoux Moving Average).
- Preparation Phase: Price is at the cycle bottom (Low Zone), looking for Sell-Side Liquidity.
- Ride the Wave: The sine wave turns green and rises, signalling a bullish trend expansion.
- Distribution Phase: Price reaches the cycle peak (High Zone), looking for Buy-Side Liquidity.
- Displacement Down: The sine wave turns red, signalling a shift in market structure and a bearish move.
2. Liquidity Sweep Detection
The indicator automatically marks "Equal Highs" and "Equal Lows" that have been swept.
- X Marks: Buy-Side Liquidity Sweeps (Potential Short setups).
- Triangle Marks: Sell-Side Liquidity Sweeps (Potential Long setups).
3. Smart Displacement & FVGs
The system doesn't just look for big candles; it calculates Relative Displacement. When price moves with high volume and volatility, the indicator identifies Fair Value Gaps (FVG).
- Emerald Boxes: Bullish FVGs (Targets for "Retrace to FVG" longs).
- Maroon Boxes: Bearish FVGs (Targets for "Retrace to FVG" shorts).
4. Real-Time Dashboard
A built-in HUD (Heads-Up Display) in the top-right corner monitors the Cycle Power and explicitly labels the current market phase, so you never have to guess where you are in the "Distorted Cycle."
---
How to Trade with Wave Navigator
1. Identify the Zone: Look for the Sine Wave to enter the "Preparation" (Low) or "Distribution" (High) zones.
2. Wait for the Sweep: Look for a Liquidity Sweep icon to appear at the cycle extremes.
3. Confirm with Displacement: Wait for a Displacement Arrow and a coloured Sine Wave flip (Green for Up / Red for Down).
4. The Entry: Enter on the Retrace to FVG (the coloured boxes) once the wave has begun its new direction.
Settings
- Base MA Length: Adjust this to change the "frequency" of the wave (Higher = Swing Trading, Lower = Scalping).
- Displacement Sensitivity: Fine-tune how "aggressive" the price move must be to trigger an FVG.
- Sine Opacity: Customise the visual intensity of the trend wave.
Disclaimer: Trading involves significant risk. This indicator is a tool for analysis and should be used in conjunction with a robust trading plan and proper risk management. Gösterge

Deviation Lens [JOAT]Deviation Lens
Introduction
Deviation Lens is an open-source multi-dimensional statistical displacement tool that applies Z-Score analysis simultaneously to three market dimensions: price level, close-to-close price change, and volume. Rather than using arbitrary overbought/oversold thresholds derived from historical maxima and minima, Deviation Lens computes exactly how many standard deviations each dimension is from its recent rolling mean. This provides a precise, adaptive, distribution-aware measure of how statistically extreme current market conditions are.
The core insight is that markets are mean-reverting systems over short time horizons. Statistical extremes — conditions where price, momentum, or volume are far from their recent averages — represent transient states. The further from the mean, the greater the statistical probability that conditions will normalize. Deviation Lens quantifies this probability directly, from 0% (at the mean) to 99.7% (at three standard deviations), and displays it as a live reversal probability for every bar.
Core Concepts
1. Three-Dimensional Z-Score Calculation
Three independent Z-Scores are computed on every bar:
The Price Z-Score measures how far the current close is from the rolling mean close in standard deviation units. This captures whether the current price level is statistically cheap or expensive relative to recent history.
The Change Z-Score measures how far the current bar's close-to-close price change is from the rolling mean change — quantifying momentum extremity rather than price level extremity.
The Volume Z-Score measures how far the current volume is from the rolling mean volume. High-volume Z-Score values identify bars where unusual institutional participation is statistically evident:
priceZ = priceStd > 0 ? (close - priceMean) / priceStd : 0.0
changeZ = changeStd > 0 ? (chg - changeMean) / changeStd : 0.0
volumeZ = volStd > 0 ? (volume - volMean) / volStd : 0.0
2. Reversal Probability Mapping
The absolute Z-Score is mapped to a reversal probability percentage based on the properties of the normal distribution. A Z-Score of 1.0 corresponds to 68.3% of values lying within one standard deviation — meaning only 31.7% of readings exceed this level, implying a 68.3% probability of mean reversion. A Z-Score of 2.0 corresponds to 95.4%, and 3.0 to 99.7%:
calcRevProb(float z) =>
float absZ = math.abs(z)
absZ >= 3.0 ? 99.7 : absZ >= 2.5 ? 98.8 : absZ >= 2.0 ? 95.4 : absZ >= 1.5 ? 86.6 : absZ >= 1.0 ? 68.3 : absZ >= 0.5 ? 38.3 : 0.0
This probability is displayed in the dashboard alongside the live Z-Score value, giving the trader both the raw statistical reading and its corresponding reversal likelihood.
3. Composite Z-Score and Zone Classification
The three individual Z-Scores are combined into a composite score using configurable weights for each dimension. The composite is then classified into a zone: EXTREME (above the configurable extreme threshold), ELEVATED, NEUTRAL, or the opposing directional equivalents. Zone classification determines the dashboard color coding and alert triggers:
composite = (priceZ * wPrice + changeZ * wChange + volumeZ * wVolume) / totalWeight
4. Divergence and Hidden Divergence Detection
Deviation Lens monitors for two divergence conditions. Standard divergence occurs when the Z-Score direction disagrees with the price direction — price makes a higher high but the Z-Score makes a lower high (bearish divergence), or price makes a lower low but the Z-Score makes a higher low (bullish divergence). Hidden divergence occurs when the Z-Score makes an extreme move while price action is relatively contained — a potential continuation pattern. Divergence events are labeled directly on the chart with bold, clearly sized labels:
bullDiv = close > close and priceZ < priceZ // Price up, Z down = bull div
bearDiv = close < close and priceZ > priceZ // Price down, Z up = bear div
Labels: BULL DIV, BEAR DIV (size.small), H.BULL, H.BEAR (size.tiny for hidden divergence).
5. Multi-Dimensional Dashboard
The institutional dashboard presents all three Z-Scores, the composite Z-Score, current zone classification, reversal probability, and divergence status simultaneously. The layout is designed so the most actionable information — Zone and Rev. Probability — is displayed at the largest text size, with supporting metrics at smaller sizes.
Features
Three independent Z-Scores: Price level, price change (momentum), and volume — each computed on its own rolling mean and standard deviation
Configurable Z-Score weights: The composite score uses adjustable per-dimension weights allowing emphasis on price, momentum, or volume depending on trading context
Live reversal probability: Probability percentage mapped directly from the Z-Score using normal distribution properties (68.3% at 1σ through 99.7% at 3σ)
Zone classification: Composite Z-Score classified as Extreme, Elevated, or Neutral in both directions with color-coded dashboard display
Divergence labels (BULL DIV / BEAR DIV): Z-Score vs price direction disagreement labeled on-chart at size.small
Hidden divergence labels (H.BULL / H.BEAR): Z-Score extreme with contained price action labeled at size.tiny
Configurable extreme and elevated thresholds: Both Z-Score thresholds independently adjustable
Institutional dashboard (top right): 14-row table with Price Z, Change Z, Volume Z, Composite Z, Zone, Reversal Probability, and divergence status
Adaptive thresholds: All calculations normalize to the rolling lookback period, adapting to current instrument and timeframe volatility
Alerts: Separate alertconditions for extreme bull and extreme bear composite Z-Score readings
Input Parameters
Z-Score Settings:
Z-Score Length: Rolling window for all three Z-Score calculations (default: 20)
Extreme Threshold: Z-Score magnitude classified as Extreme zone (default: 2.0)
Elevated Threshold: Z-Score magnitude classified as Elevated zone (default: 1.0)
Dimension Weights:
Price Weight: Relative weight of the price Z-Score in composite (default: 1.0)
Change Weight: Relative weight of the momentum Z-Score in composite (default: 1.0)
Volume Weight: Relative weight of the volume Z-Score in composite (default: 0.5)
Divergence:
Divergence Lookback: Bars back for divergence comparison (default: 5)
Show Divergence Labels toggle
Display:
Show Dashboard toggle
Bull and Bear color inputs
How to Use This Indicator
Step 1: Read the Composite Zone
The Zone row in the dashboard shows the current composite Z-Score classification. EXTREME readings at the top of the scale indicate the highest statistical probability of mean reversion. NEUTRAL readings indicate current conditions are close to the mean and have low statistical directional edge from this tool alone.
Step 2: Check Reversal Probability
The Rev. Probability row translates the Z-Score magnitude directly into a percentage. A reading above 95% means the current composite Z-Score is in the outer 5% of its historical distribution — a statistical extreme that has preceded mean reversion 95% of the time in the measured period.
Step 3: Assess Each Dimension Independently
The three individual Z-Score rows reveal which dimension is driving the composite. A high composite driven entirely by volume Z-Score is a different setup than one driven by price Z-Score. Understanding which dimension is extreme helps filter entries: a price Z-Score extreme without supporting momentum or volume Z-Score extremes may be a lower-conviction reading.
Step 4: React to Divergence Labels
BULL DIV and BEAR DIV labels appear when Z-Score momentum diverges from price direction. These signal that the statistical driver of a move is weakening even as price continues. H.BULL and H.BEAR hidden divergence labels flag potential continuation setups where Z-Score is extreme but price is not.
Step 5: Combine with Structural Context
Deviation Lens produces the highest value when its extreme readings coincide with a structural confluence point — an order block, session low, or structure level. A 99.7% reversal probability at a tested support zone is a higher-conviction setup than the same reading in open air.
Indicator Limitations
All Z-Scores are computed relative to the rolling lookback window. The lookback defines what "normal" means. A very short lookback will produce extreme readings frequently; a very long lookback will rarely reach the extreme threshold. Calibration to the instrument and timeframe is required
The reversal probability percentages are derived from the normal distribution assumption. Price change and volume distributions are not perfectly normal — they exhibit fat tails and skew. The probabilities are approximations, not precise statistical guarantees
The composite Z-Score uses equal weights by default. Changing dimension weights significantly alters which market conditions produce extreme readings. Weight adjustments should be based on the specific instrument's characteristics
Divergence detection uses a simple lookback comparison, not a peak-detection algorithm. In choppy markets, divergence labels may appear frequently without providing actionable signals
Originality Statement
Deviation Lens is original in its simultaneous, weighted multi-dimensional Z-Score framework that maps composite statistical extremity directly to a reversal probability percentage. This indicator is published because:
Applying Z-Score analysis to three independent market dimensions simultaneously — price level, momentum (close-to-close change), and volume — rather than a single oscillator provides a richer statistical picture of current market extremity than any single-dimension Z-Score tool
The direct mapping of Z-Score magnitude to reversal probability percentages using normal distribution properties gives traders an immediately interpretable statistic rather than a raw number requiring subjective interpretation
The composite weighted Z-Score system, where each dimension's contribution to the overall reading is configurable, allows the indicator to be tuned toward price-mean-reversion strategies, momentum exhaustion strategies, or volume anomaly detection depending on the trader's methodology
The combined detection of standard divergence and hidden divergence between the Z-Score and price direction provides trend continuation and reversal signals from the same framework
Disclaimer
This indicator is provided for educational and informational purposes only. It is not financial advice or a recommendation to buy or sell any financial instrument. Trading involves substantial risk of loss. Z-Score readings and reversal probability percentages are statistical tools based on historical distributions and do not guarantee any future price behavior. The normal distribution assumption applied to price and volume data is an approximation. Always use proper risk management. The author is not responsible for any trading losses resulting from the use of this indicator.
-Made with passion by jackofalltrades
Gösterge

Displacement Forge [JOAT]Displacement Forge
Introduction
Displacement Forge is an open-source order block detection engine built on Z-Score impulse analysis. It identifies statistically significant price displacements — moves that exceed a configurable standard deviation threshold relative to recent price change history — and marks the candle immediately preceding each displacement as an Order Block Zone. Order blocks represent the price ranges from which institutional order flow originates. Price regularly returns to these zones to fill remaining orders, and Displacement Forge identifies and tracks each one, monitors for zone reactions, and records cumulative rejection statistics.
The problem order block analysis solves is entry precision. A trend bias tells you direction. An order block tells you at what price the institutions that created that trend loaded their positions. Returning to those prices to enter alongside institutional flow — rather than chasing moves already in progress — is the conceptual foundation Displacement Forge is built on. The Z-Score gate ensures only statistically significant displacements qualify, filtering out small impulses caused by normal market noise.
Core Concepts
1. Z-Score Displacement Detection
Rather than using fixed ATR multiples to define a "significant" move, Displacement Forge computes the Z-Score of each bar's price change relative to the rolling distribution of recent price changes. The Z-Score measures how many standard deviations the current move is from the recent mean:
priceChg = close - close
avgChg = ta.sma(priceChg, zscoreLen)
stdChg = ta.stdev(priceChg, zscoreLen)
zscore = stdChg > 0 ? (priceChg - avgChg) / stdChg : 0.0
A positive Z-Score above the threshold with a bullish candle close and a higher close than recent highs — filtered by an EMA and VWAP trend context — constitutes a bullish displacement impulse. A negative Z-Score below the negative threshold with a bearish close and lower-than-recent lows in the opposing trend context constitutes a bearish displacement impulse.
2. Order Block Zone Identification
When a displacement impulse is detected, the indicator looks backward through the impulse lookback window for the last candle in the opposite direction — the candle just before the institutional move began. That candle's high and low define the order block zone. This captures the price range where institutional orders were being placed before the displacement candle consumed available liquidity:
if bullImpulse
for i = 1 to impulseLook
if close < open // Last bearish candle before the impulse
obLow := low
obHigh := high
break
Each zone is drawn as a box on the chart using the pre-impulse candle's range. Bull order blocks are drawn with a bullish tint (price expected to react bullishly when revisited). Bear order blocks with a bearish tint.
3. EMA and VWAP Trend Filter
Two independent trend filters gate displacement qualification. The EMA filter (200-period by default, configurable) requires bull displacements to occur above the EMA and bear displacements below it. The VWAP filter adds an intraday fair-value gate — bull displacements require price to be above the current VWAP, bear displacements require price to be below. Both filters can be independently enabled or disabled:
bullImpulse = zscore > threshold and close > open
and close > ta.highest(close, impulseLook)
and (not useEma or close > ema200)
and (not useVwap or close > ta.vwap)
4. Zone Reaction Detection and Rejection Counting
Active order block zones are continuously monitored for price reactions. A bullish reaction occurs when the candle low touches or enters the bull zone range with a bullish close. A bearish reaction occurs when the high touches or enters the bear zone range with a bearish close. Each confirmed reaction increments the independent bull and bear rejection counters displayed in the dashboard:
if ob.isBull and low <= ob.top and low >= ob.bottom and close > open
bullReactionDetected := true
totalBullRejections += 1
5. Zone Lifespan and Active Zone Management
Each zone carries an age counter that increments bar by bar. Zones exceeding the maximum age (configurable) are automatically removed as inactive. The active zone count and total tested zone count are tracked and displayed in the dashboard, giving a running picture of how many zones are currently relevant versus how many have been tested and absorbed.
Features
Z-Score impulse gate: Displacement qualification based on standard deviations from the rolling price-change distribution, not arbitrary fixed thresholds
Order block zone boxes: Pre-impulse candle ranges drawn as colored boxes on the chart for both bull and bear impulses
EMA trend filter: Configurable EMA length gates displacement direction relative to long-term trend
VWAP trend filter: Intraday VWAP provides a fair-value gate alongside the EMA for dual confirmation
Zone reaction monitoring: Active zones continuously checked for price reactions with independent bull and bear rejection counters
Zone age management: Configurable maximum zone age with automatic removal of expired zones
Active and tested zone counts: Dashboard tracks how many zones are live versus how many have been tested
Bull and bear rejection totals: Cumulative counts of all confirmed zone reactions by direction
Displacement markers: Labeled arrows at each confirmed displacement bar (BULL DISP, BEAR DISP) with size and style differentiation
Divergence detection: Z-Score divergence against price direction labeled (BULL DIV, BEAR DIV) and hidden divergence (H.BULL, H.BEAR)
Institutional dashboard (top right): 13-row table with Z-Score, displacement state, OB reactions, active zone count, tested zone count, EMA and VWAP filter status
Fully configurable: Z-Score length and threshold, impulse lookback, EMA length, VWAP toggle, zone max age, and zone visibility independently adjustable
Alerts: Separate alertconditions for bullish and bearish displacement impulses
Input Parameters
Displacement Detection:
Z-Score Length: Rolling window for mean and standard deviation calculation (default: 20)
Z-Score Threshold: Standard deviation threshold for displacement qualification (default: 1.5)
Impulse Lookback: Bars back to search for the pre-impulse order block candle (default: 5)
Trend Filters:
EMA Length: Trend EMA period (default: 200)
Use EMA Filter toggle (default: enabled)
Use VWAP Filter toggle (default: enabled)
Zone Management:
Max Zone Age (Bars): Maximum bar lifespan of active zones before automatic removal (default: 100)
Show OB Zones toggle
Display:
Show Dashboard toggle
Show Divergence Labels toggle
Bullish and Bearish color inputs
How to Use This Indicator
Step 1: Identify the Current Z-Score and Displacement State
The dashboard shows the live Z-Score value and displacement state (BULL IMPULSE, BEAR IMPULSE, or NEUTRAL). Use the Z-Score value as a real-time gauge of how statistically extreme the current price move is relative to recent history.
Step 2: Locate Active Order Block Zones
After any displacement, a colored box marks the pre-impulse candle range. These zones are the areas where institutional orders were accumulated before the move. The dashboard's Active Zones row shows how many live zones are currently on the chart.
Step 3: Wait for Price to Return to a Zone
When price retraces after a displacement and enters an active zone, watch for a reaction candle. A bullish close from within a bull zone or a bearish close from within a bear zone constitutes a zone reaction and increments the dashboard's rejection counter.
Step 4: Apply EMA and VWAP Context
The EMA filter status (ABOVE/BELOW) and VWAP filter status in the dashboard confirm whether the trend context supports the zone direction. An active bull zone with price above both the EMA and VWAP provides a higher-context long reaction than the same zone in a downtrend.
Step 5: Observe Divergence Labels
BULL DIV and BEAR DIV labels appear when the Z-Score diverges from price direction — Z-Score momentum and price momentum disagree. H.BULL and H.BEAR mark hidden divergence. These are secondary signals that may precede displacement reversals.
Indicator Limitations
The Z-Score is computed relative to the rolling price-change distribution of the configured lookback period. During regime changes or low-liquidity periods, the distribution can shift and cause the threshold to misfire
Order block identification looks backward from the displacement bar. The pre-impulse candle selection is algorithmic — it finds the last opposite-direction candle within the lookback. In some impulse structures this may not match the manually identified order block
Zone reaction detection requires the candle to touch the zone range in the same bar that a directional close occurs. Multi-bar zone entry sequences are not separately tracked
The VWAP calculation resets at daily boundaries. On instruments that trade across midnight or on continuous futures contracts, the VWAP reset behavior may differ from expectations
This indicator identifies order block zones and reactions. It does not generate trade entry signals, and zone reactions do not guarantee price continuation from the zone
Originality Statement
Displacement Forge is original in its application of Z-Score analysis to price change distribution as the gate for order block qualification, combined with a dual trend filter and automatic zone reaction monitoring with cumulative statistics. This indicator is published because:
Using the rolling Z-Score of bar-by-bar price changes — rather than raw ATR multiples — to define what constitutes a statistically significant displacement provides an adaptive, distribution-aware threshold that adjusts to current volatility rather than using fixed values
The pre-impulse candle lookback logic that identifies the order block as the last opposite-direction candle before the displacement provides a specific, repeatable rule for zone placement that eliminates the ambiguity of manual order block selection
The dual trend filter combining a configurable EMA with VWAP — both independently togglable — provides layered directional context that single-MA systems do not offer
Tracking cumulative bull and bear rejection counts alongside active and tested zone counts provides ongoing statistical feedback on how the order block zones are performing across the chart history
Disclaimer
This indicator is provided for educational and informational purposes only. It is not financial advice or a recommendation to buy or sell any financial instrument. Trading involves substantial risk of loss. Order block zones are identified using statistical and structural criteria but do not guarantee any particular price reaction when revisited. Z-Score thresholds are parameters that require adjustment to match specific instruments and timeframes. Past zone reactions do not guarantee future reactions. Always use proper risk management. The author is not responsible for any trading losses resulting from the use of this indicator.
-Made with passion by jackofalltrades
Gösterge

Market Phase Detector [JOAT]Market Phase Detector
Introduction
Market Phase Detector is an open-source market structure classification engine that continuously identifies whether price is operating in a Bullish Trend, Bearish Trend, or Range state. The classification uses three independent inputs that must align simultaneously before a regime is confirmed, making the output robust against single-factor noise and false positives that plague simpler trend detectors.
The problem Market Phase Detector solves is context. Trend-following entries during range conditions produce whipsaws. Mean-reversion entries during strong trending moves produce losses against the dominant flow. Knowing the regime before interpreting any other signal improves the relevance of every decision made from it. Market Phase Detector makes that determination automatically, updates it bar by bar, and visualizes both the current regime and every structural event that contributed to it — including labeled BOS and CHoCH events with horizontal level lines, live swing extension lines at the right edge, and an institutional-grade dashboard.
Core Concepts
1. Swing Detection and Pivot Tracking
Price structure is derived from pivot highs and lows confirmed using ta.pivothigh() and ta.pivotlow() with a configurable symmetric lookback. The lookback controls sensitivity — a value of 5 requires 5 bars on each side of the pivot to confirm it, producing only the most structurally significant swings. Each confirmed pivot updates the tracked level and resets its broken flag to allow new break detection on the next cycle:
pivHi = ta.pivothigh(high, swingLen, swingLen)
pivLo = ta.pivotlow(low, swingLen, swingLen)
if not na(pivHi)
topLevel := pivHi
topBroken := false
2. Break of Structure vs Change of Character
Two structural event types are distinguished and tracked independently. A Break of Structure (BOS) occurs when price closes through the previous swing extreme in the same direction as the current structural bias — confirming continuation. A Change of Character (CHoCH) occurs when price closes through the previous swing extreme against the current structural bias — signaling a potential regime flip:
bosBull = bullBreak and structureBias == 1
chochBull = bullBreak and structureBias != 1
Every event is labeled directly on the chart with a horizontal line at the break level and a text label (BOS +, BOS -, CHoCH +, CHoCH -). Running counts of each type are tracked and displayed in the dashboard.
3. Three-Factor Regime Gate
The regime classification evaluates all three inputs simultaneously before assigning a state. Structure bias is set by BOS and CHoCH events. The volatility gate compares current ATR to a moving average of ATR multiplied by a contraction threshold — when ATR falls below this level the market is classified as compressed and the regime defaults to Range regardless of structure or momentum. Momentum uses a smoothed rate-of-change that must confirm the structural direction:
if isLowVol
regime := 0 // Range — volatility gate overrides everything
else if strBias == 1 and roc > 0
regime := 1 // Bullish
else if strBias == -1 and roc < 0
regime := -1 // Bearish
else
regime := 0 // Inconclusive — range
A confidence score (1-3) counts how many of the three factors currently agree and is displayed in the dashboard, allowing the trader to distinguish a fully confirmed 3/3 regime from a weaker 2/3 reading.
4. Swing Level Extension Lines
The current unbroken swing high and swing low are extended as dotted horizontal lines to the right edge of the chart with price labels. These serve as the nearest structural reference levels — the next points where a BOS or CHoCH could occur. They are deleted and redrawn each bar using barstate.islast so they remain current without consuming the indicator's line budget:
if barstate.islast and showSwingExt
line.delete(swingHiLine)
swingHiLine := line.new(topBar, topLevel, bar_index + 4, topLevel,
color=color.new(#E65100, 45), style=line.style_dotted, width=2)
5. Regime Background Shading
The chart background is tinted according to the current regime — faint teal for Bullish, faint orange for Bearish, neutral gray for Range. This gives immediate context at a glance without adding visual noise to the price action.
Features
Three-state regime output: Bullish, Bearish, and Range states derived from structure, volatility, and momentum alignment
BOS and CHoCH event labels: Every structural break labeled on-chart with event type, direction, and horizontal level line
Independent BOS and CHoCH counters: Running totals of each structural event type in the dashboard
Swing level extension lines: Dotted right-edge lines at the current unbroken swing high and low with price labels
ATR-based volatility gate: Low-volatility contraction forces a Range classification regardless of structure or momentum
Smoothed momentum confirmation: Rate-of-change must align with structure before a trending regime is confirmed
Confidence scoring (1/3 to 3/3): Quantifies how many of the three classification factors are currently aligned
Regime background shading: Chart background tint reflects the current regime in real time
Institutional dashboard (top right): 15-row table with regime state, confidence, last break direction and age, BOS and CHoCH counts, swing levels, and ATR
Fully configurable colors: Bullish, bearish, and ranging tints plus structure line colors are independently adjustable
All signals confirmed bar only: No repainting — all structural events fire on barstate.isconfirmed
Input Parameters
Structure Detection:
Swing Lookback: Left/right bars required for pivot confirmation (default: 5)
ATR Period: ATR calculation length (default: 14)
Regime Classification:
Volatility MA Length: MA length for ATR comparison (default: 20)
Range Contraction Multiplier: ATR fraction below which the market is classified as ranging (default: 0.7)
Momentum Lookback: Rate-of-change lookback and EMA smoothing period (default: 10)
Display:
Regime Background Shading toggle
Show Dashboard toggle
Show Structure Lines toggle
Show Swing Level Extensions toggle
How to Use This Indicator
Step 1: Read the Current Regime
Check the REGIME row in the dashboard. BULLISH, BEARISH, or RANGE appears in its corresponding color. This is the primary output. Use it to establish directional bias before consulting any other signal source.
Step 2: Check Confidence Score
The Confidence row shows how many of the three inputs align (e.g., 2/3). A 3/3 reading means structure, volatility, and momentum all agree. A 2/3 reading means one factor is diverging. Weight directional decisions higher during full 3/3 alignment.
Step 3: Monitor CHoCH Events
Each CHoCH label marks a structural break against the current bias — a warning that the regime may be shifting. When a CHoCH appears, watch whether subsequent bars confirm a new opposing BOS or whether the previous regime resumes.
Step 4: Use Swing Extension Lines as Forward Reference
The dotted right-edge lines mark the current unbroken swing levels — the nearest structural break zones. Knowing how close price is to these levels frames where the next BOS or CHoCH could occur.
Step 5: Apply Regime as a Filter
Market Phase Detector is designed as a context layer, not a standalone signal generator. Apply the regime output as a filter to your existing tools: only take long signals when the regime is Bullish, only take short signals when Bearish, and step aside or apply mean-reversion logic when Range is active.
Indicator Limitations
Pivot detection confirms swingLen bars after the pivot forms, creating a natural offset between the candle where the swing occurred and when it is labeled. This is intentional non-repainting behavior
The volatility gate may temporarily classify a new trend as Range immediately after a volatility expansion if ATR has not yet risen above the threshold. This resolves within a few bars as ATR normalizes
In slow, grinding markets, momentum may repeatedly lag structure, resulting in extended Range readings during mild trends
Market Phase Detector classifies current market state. It does not predict future price direction or generate entry/exit signals
Originality Statement
Market Phase Detector is original in its three-factor gate requiring independent alignment of structure, volatility, and momentum before any regime is confirmed. This indicator is published because:
The combination of CHoCH and BOS structural logic, an ATR contraction gate, and a smoothed momentum filter into a single lightweight classifier that produces a confidence score is uncommon in published open-source Pine Script v6
Distinguishing BOS from CHoCH within the same indicator — with independent event counts and labeled historical events — provides structural context that standalone trend indicators do not offer
The confidence scoring system (1-3) quantifies the strength of the current regime reading across three independent analytical dimensions, not just a single oscillator value
Swing level extension lines provide live structural reference at the right edge of the chart without requiring the user to manually draw levels or add a separate pivot indicator
Disclaimer
This indicator is provided for educational and informational purposes only. It is not financial advice or a recommendation to buy or sell any financial instrument. Trading involves substantial risk of loss. Regime classifications are based on historical price data and do not guarantee any future market behavior. All three factors can produce inaccurate readings in atypical market conditions. Always use proper risk management. The author is not responsible for any trading losses resulting from the use of this indicator.
-Made with passion by jackofalltrades
Gösterge

Confluence Engine Strategy [JOAT]Confluence Engine Strategy
Overview
Confluence Engine Strategy is a fully automated Pine Script v6 strategy that combines four independent signal layers into a single numeric confluence score (0–100) before executing any trade. Entries require genuine agreement between linear regression momentum, dual EMA trend regime, ATR volatility state, and higher-timeframe bias. All exits are ATR-proportional with configurable take-profit and stop-loss multiples, plus a bar-based timeout and a trend-flip emergency exit. Commission (0.05% per side) and slippage (2 ticks) are configured for realistic backtesting.
Why Require Confluence?
Single-condition strategies (e.g., "go long when RSI crosses 50") produce entries in every conceivable market environment — ranging, trending, low-volatility, high-volatility — most of which are statistically unfavourable for that signal type. Requiring multiple independent conditions to agree simultaneously filters the entry universe down to the high-probability subset where each individual indicator is operating in its most favourable context. The Confluence Engine makes this filtering explicit and auditable through a numeric score.
Signal Layer 1 — Linear Regression Crossover
The primary entry trigger mirrors the Regression Flux Candles logic: a 21-bar linear regression of close (LR close) crossing above/below an 8-bar SMA of itself. The LR approach de-noises price before computing the crossover, significantly reducing the whipsaw rate compared to raw close-based SMA crossovers.
Signal Layer 2 — Dual EMA Trend Regime
Two exponential moving averages (fast: 21-period, slow: 55-period) define the trend regime. Long entries are only considered when the fast EMA is above the slow EMA; short entries only when fast is below slow. This prevents the LR crossover from triggering counter-trend entries in established trends — one of the most common sources of false signals in momentum strategies.
Signal Layer 3 — ATR Volatility State
The current 14-bar ATR is compared to a 50-bar ATR. Entries are only accepted when the current ATR is above a configurable fraction of the slow ATR (default 0.7). This volatility gate blocks trades during compression phases — low-volatility periods where breakouts frequently fail. The strategy only participates when directional energy is present.
Signal Layer 4 — Higher-Timeframe Bias
A higher-timeframe linear regression direction is fetched via request.security() with lookahead_off. The HTF LR close vs. HTF LR open comparison gives a single bullish/bearish vote from the higher timeframe. Long entries receive a confluence bonus when the HTF agrees; short entries receive a bonus when the HTF is bearish. This aligns trade direction with the prevailing macro bias.
Confluence Score and Threshold
Each of the four layers contributes points to the confluence score:
- LR crossover in direction: +30
- Dual EMA alignment: +25
- ATR volatility expansion: +20
- HTF bias alignment: +25
Maximum score: 100. The minimum required score to execute an entry (default 60) filters out entries where fewer than three layers agree. This threshold is adjustable — lower it for more signals, raise it for higher selectivity.
Entry Logic
Long: LR crossover up AND the accumulated confluence score >= minimum AND the signal is on a confirmed bar AND warmup has elapsed AND no position is currently open AND no cooldown bars remain.
Short: LR crossover down AND confluence >= minimum AND same guards.
A configurable cooldown period (default 5 bars) prevents re-entering the same direction immediately after an exit, avoiding overtrading in choppy conditions.
Exit Logic — Four Exit Conditions
1. ATR Take-Profit: Long exits when close >= entry + ATR × TP multiplier (default 2.0). Short exits below entry - ATR × TP.
2. ATR Stop-Loss: Long exits when close <= entry - ATR × SL multiplier (default 1.2). Short exits above entry + ATR × SL.
3. Bar Timeout: If neither TP nor SL is hit within a configurable number of bars (default 20), the trade exits at market — preventing capital from being locked in stalled trades.
4. Trend Flip Exit: If the dual EMA regime flips against the trade direction (fast EMA crosses slow EMA), the trade exits immediately — recognising that the structural basis for the entry has been invalidated.
Strategy Properties
- Initial capital: $10,000
- Order size: 10% of equity per trade (sustainable risk allocation)
- Commission: 0.05% per side (representative of major exchange fees)
- Slippage: 2 ticks (accounts for spread and execution delay)
- Currency: USD
- Pyramiding: disabled (one position at a time)
These settings are designed to produce realistic backtesting results. Risk per trade is capped well below the 5–10% equity guideline. Commission and slippage are included to prevent overstating performance.
Inputs Reference
Signal Layers
- LR Length (21) — linear regression period
- Signal SMA Length (8) — crossover trigger SMA
- Fast EMA (21) / Slow EMA (55) — trend regime definition
- ATR Length (14) / ATR Slow Length (50) / ATR Threshold (0.70)
- HTF Timeframe — higher-timeframe bias source (default "D")
Confluence & Filters
- Min Confluence Score (60) — minimum sum of layer scores required for entry
- Cooldown Bars (5) — bars to wait after exit before re-entering
- Max Bars in Trade (20) — timeout exit
Risk Management
- TP ATR Multiple (2.0) — take-profit distance in ATR units
- SL ATR Multiple (1.2) — stop-loss distance in ATR units
How to Read the Results
Apply the strategy to a liquid instrument on a 1H or 4H chart with sufficient history to generate 100+ trades. Evaluate:
- Net profit relative to max drawdown (seek ratio > 2:1)
- Win rate in context of average win vs. average loss
- Profit factor (total gross profit / total gross loss, seek > 1.3)
- Number of trades (sufficient sample size for statistical inference)
Adjust the confluence minimum score to trade off signal frequency against quality: 50 produces more trades, 75 produces fewer but higher-quality entries.
Non-Repainting Design
All entries fire on strategy.entry() within barstate.isconfirmed blocks. HTF bias uses lookahead_off. No future bar data is accessed. Historical signals do not shift position.
Limitations
- The strategy is designed as a general-purpose framework. It is not optimised for any specific instrument or session. Optimal parameters vary significantly across markets and timeframes.
- ATR-based exits are approximate. In gap markets (equities overnight, weekend gaps on crypto), the stop-loss may be exceeded significantly before the exit executes.
- Backtesting results are computed on historical data only and do not account for execution quality, broker-specific fees, or market impact. Past backtesting performance does not guarantee future live results.
- The bar timeout exit may prematurely close positions that would have eventually reached TP. This is a deliberate conservative design choice to limit capital lock-up, not a flaw.
Disclaimer
This strategy is provided for educational and informational purposes only. Backtesting results presented in the strategy tester represent historical simulation and do not guarantee any future trading outcome. Past performance is not indicative of future results. Never risk capital you cannot afford to lose. Always use proper risk management and conduct independent analysis before making any trading decisions.
Made with passion by officialjackofalltrades
Strateji

Compression Vector [JOAT]Compression Vector
Overview
Compression Vector is a dual-engine volatility compression detector built in Pine Script v6. It identifies moments when both Bollinger Band width and Average True Range simultaneously contract relative to their historical baselines — a confluence that institutional traders recognise as the calm before an explosive directional move. When the squeeze releases, the indicator fires scored breakout signals with adaptive ATR-based take-profit levels and stop-loss placement directly on the chart.
Why This Approach?
Most squeeze indicators rely on a single compression measure, such as BB width relative to Keltner Channel, which can produce false signals in low-volume sideways drift. Compression Vector cross-validates two independent compression engines:
- Engine 1 — ATR Historical Ratio: Compares the 14-bar ATR against a slow ATR of configurable length (default 50). If the ratio falls below the compression threshold, the first engine fires.
- Engine 2 — BB + ATR SMA Squeeze: Compares current BB width against its own SMA (so the band must narrow relative to its own recent average), AND compares the current ATR against its short-term SMA. Only when at least one of these secondary tests also confirms does a dual-engine squeeze register.
Both engines must agree before a zone is created. This eliminates the noise inherent in single-measure detectors.
Compression Zones — 3-Layer Institutional Box System
Each confirmed squeeze prints a three-layer box structure that visually encodes squeeze intensity through colour:
- Halo layer (outer): Wide, nearly transparent — marks the full expansion of the compressed range plus padding
- Body layer (mid): The actual high-to-low range of all bars inside the squeeze
- Core layer (inner): A tighter 40% interior slice highlighting the median energy pocket
The box colour progresses through a time-weighted palette: grey (< 5 bars), purple (5–9), teal (10–19), gold (20+). Longer squeezes accumulate more potential energy and are weighted accordingly in the signal score.
Breakout Signal Scoring (0–100)
When close breaks convincingly above or below a zone, the indicator computes a composite score before stamping the signal:
- Proximity score (up to 35) — volume vs. its 20-bar SMA
- Squeeze score (up to 35) — duration of the squeeze in bars × 2.5
- RSI score (up to 15) — directional RSI headroom (long: RSI below 62, short: RSI above 38)
- Impulse score (up to 15) — breakout candle body relative to ATR
Grade letter (A+, A, B, C, D) is stamped on the signal label. Only breakouts where the candle body exceeds a configurable ATR multiple ("Min Impulse Body") qualify.
Adaptive TP / SL Lines
Risk is calculated as the distance from entry to the opposite zone boundary plus an ATR buffer. Three take-profit levels at configurable R:R multiples (default 1.5R, 2.5R, 4.0R) are drawn as dotted lines extending forward 45 bars. The stop-loss line is drawn in the opposing colour at the calculated risk distance below/above entry.
Dashboard (Bottom Centre)
A compact 8-column table displays in real time:
- Squeeze state (COMPRESSING / RELAXED) with bar count
- ASCII compression gauge (6 segments)
- ATR ratio and BB width percentage
- RSI, volume multiplier, last zone score with grade
- Active zone count and warm-up status
Inputs Reference
Squeeze Engine
- ATR Historical Length (50) — lookback for the slow ATR baseline
- ATR Compression Threshold (0.72) — ratio below which ATR engine triggers
- Bollinger Band Length (20) — period for BB and BB-width SMA
- BB Std Dev Multiplier (2.0) — standard deviation width of the Bollinger Bands
- BB Width Squeeze Ratio (0.82) — fraction of BB-width SMA below which BB engine triggers
- ATR SMA Squeeze Ratio (0.90) — fraction of ATR SMA below which ATR secondary engine triggers
- Min Bars Required in Squeeze (3) — minimum consecutive bars before a zone is registered
Signal Filters
- Require Volume Above SMA — gates breakouts to above-average volume bars
- Volume SMA Length (20) — reference volume baseline
- Block Overbought/Oversold — RSI filter at 72 long / 28 short
- RSI Length (14)
- Min Impulse Body (1.3 ATR) — minimum breakout candle body in ATR units
- Max Zones Tracked (6)
Risk & Targets
- SL Buffer (0.3 ATR) — added to raw risk for stop placement
- TP1 / TP2 / TP3 R:R — take-profit multiples (1.5 / 2.5 / 4.0)
Visual Settings
- Show Compression Zones / Show TP-SL Lines / Show Dashboard
- Theme: Dark, Light, or Auto (detects chart background)
How to Use
1. Add the indicator on any liquid market and timeframe. A warmup of roughly 100 bars is required before signals appear.
2. Watch for the dashboard state to read COMPRESSING and the gauge to fill. The longer the squeeze, the higher the potential score on breakout.
3. Wait for a labelled signal (BREAK+ for long, BREAK- for short). Prefer grade A or A+.
4. Use the drawn TP lines for partial exits and the SL line for stop placement.
5. Higher timeframes (15m, 1H, 4H) tend to produce cleaner zones with fewer false breaks.
Non-Repainting Design
All signals are gated by barstate.isconfirmed, meaning they only fire on the final tick of a closed bar. Zones are computed from confirmed historical bars only. The indicator will never repaint a past signal.
Limitations
- In extremely choppy, low-volume markets, short squeezes (2–3 bars) may resolve without meaningful breakout momentum. Raise Min Bars to filter these.
- The composite score is calibrated for liquid instruments. Illiquid or exotic pairs may require adjustment of the volume multiplier filter.
- ATR-based TP/SL levels are approximate and should not replace proper position sizing.
- No future-bar lookahead is used in any request.security() call.
Disclaimer
This indicator is provided for educational and informational purposes only. Past performance of any signal pattern is not indicative of future results. Always use proper risk management and conduct your own analysis before making any trading decisions.
Made with passion by officialjackofalltrades
Gösterge

Order Blocks + Fib MTF [Modified]Voici une description TradingView propre et publiée-ready pour ton indicateur 👇
Order Blocks + Fib MTF
By LZ — Order Blocks, Major High/Low, Fibonacci avancé et labels MTF à droite
Order Blocks + Fib MTF est un indicateur conçu pour repérer les zones d’Order Block, afficher les Major High / Major Low, et projeter automatiquement une grille de Fibonacci précise basée sur la structure active du marché.
L’objectif est simple : combiner structure, zones institutionnelles et niveaux de retracement / extension dans un seul outil visuel, propre et rapide à lire.
Fonctionnalités principales
1. Détection automatique des Order Blocks
L’indicateur identifie automatiquement les :
Demand Zones (zones de demande)
Supply Zones (zones d’offre)
Chaque zone peut être :
affichée brute
ou raffinée avec un algorithme de correction
Deux modes de refinement sont disponibles :
Defensive → zone plus resserrée
Aggressive → zone plus large
2. Affichage des Major High / Major Low
L’indicateur détecte et affiche les :
Major High Levels
Major Low Levels
Ces niveaux servent de base au calcul Fibonacci et permettent de visualiser rapidement la structure dominante du marché.
3. Fibonacci automatique entre Major High et Major Low
Une grille Fibonacci complète est calculée à partir des extrêmes majeurs détectés.
Logique utilisée
Demand (zone verte)
0 = Major Low
1 = Major High
Supply (zone rouge)
0 = Major High
1 = Major Low
Cela permet d’avoir une lecture cohérente selon le sens de la zone active.
Niveaux disponibles
L’indicateur intègre une large sélection de niveaux personnalisables :
0.0 / 0.05 / 0.13 / 0.144 / 0.233 / 0.275 / 0.31 / 0.34 / 0.382 / 0.5 / 0.55 / 0.618 / 0.786 / 0.865 / 0.895 / 1.0 / 1.1 / 1.618
Chaque niveau peut être :
activé ou désactivé
personnalisé en couleur
4. Labels Fibonacci Multi-Timeframe à droite
L’indicateur peut afficher les niveaux Fibonacci de plusieurs unités de temps directement à droite du graphique, sous forme de labels.
Exemple :
0.618 1h
0.5 4h
0.895 1D
Cela permet d’obtenir rapidement une lecture de la confluence multi-timeframe sans surcharger le graphique avec trop de lignes.
MTF disponibles
MTF 1
MTF 2
MTF 3
Chaque timeframe peut être :
activée ou désactivée
choisie librement
affichée avec une taille de label personnalisable
5. Support / Resistance
L’indicateur peut également afficher :
le dernier support
la dernière résistance
Cela ajoute une lecture structurelle complémentaire à l’analyse des zones.
6. Système d’alertes intégré
L’indicateur inclut un système d’alertes permettant de recevoir des signaux lorsque le prix revient dans les zones détectées.
Options disponibles :
activation / désactivation des alertes
fréquence du message
fuseau horaire
message personnalisé bull / bear
Utilisation recommandée
Cet indicateur est particulièrement utile pour :
repérer les zones de réaction probables
surveiller les retests d’Order Blocks
travailler les entrées en confluence avec Fibonacci
comparer plusieurs timeframes en un coup d’œil
améliorer le timing sur des setups basés sur la structure
Il peut être utilisé seul, mais il devient encore plus puissant lorsqu’il est combiné avec :
action du prix
volume
RSI MTF
confirmations de retournement
contexte HTF
Points forts
lecture visuelle claire
Fibonacci avancé et personnalisable
logique différente selon Demand / Supply
confluence MTF sans surcharge
support et résistance intégrés
alertes prêtes à l’emploi
Remarques
Cet indicateur est un outil d’analyse visuelle et structurelle.
Il ne garantit pas à lui seul la réussite d’un trade et doit être utilisé avec une gestion du risque adaptée.
Crédits
Modification et adaptation par LZ
Basé sur une logique d’Order Blocks + Structure + Fibonacci MTF
Si tu veux, je peux maintenant te faire aussi une version plus “pro/prestige” pour publication publique TradingView, ou une version plus agressive marketing.
Affichage de fibo lZ.txt en cours... Gösterge

Harmonic Assistant(XABCD)**Harmonic Assistant (XABCD)**
**Overview**
Trading harmonic patterns can often be a highly subjective, tedious, and visually cluttered process. The **Harmonic Assistant Pro** is designed to eliminate the guesswork. It is an advanced, fully automated XABCD pattern detection engine that not only finds high-probability setups (Gartley, Bat, Butterfly, Crab) but also acts as a live trading assistant, explaining market geometry to you in real-time.
Unlike standard harmonic indicators that cover your screen in messy lines, this script introduces **Smart Label Placement** and a dynamic **Live Commentary Panel**, keeping your charts exceptionally clean and your mind focused on the trade execution.
**Key Features & Innovations**
* 🦇 **Automated Classic Patterns:** Instantly detects Bullish and Bearish Gartley, Bat, Butterfly, and Crab formations using a highly optimized, lag-free ZigZag engine.
* 🧠 **Live Commentary Panel:** The indicator speaks to you. Instead of just displaying raw math, the HUD translates ratios into actionable insights. It will tell you: *"Bat Candidate: Awaiting D at 0.886"* or *"Invalid: B point broke X origin"*.
* 📐 **Complete Auto-Fibonacci:** Once an XA leg is established, the script automatically draws a complete set of Fibonacci retracement and extension lines (from 0.0 all the way to 4.236). This allows you to visually anticipate where the D point (target) will land before it happens.
* 🛡️ **Smart Invalidation & Trend Filter:** The script knows when a pattern is mathematically dead. If the B point breaks the X origin, or if the price goes parabolic (extreme extension), it instantly invalidates the pattern to protect you from false signals.
* ✅ **Actionable Trade Plans:** Upon pattern confirmation, the script dynamically draws a Potential Reversal Zone (PRZ) box, precise Take Profit levels (TP1, TP2), and a strict Stop Loss (SL) line based on classical harmonic rules.
**How to Read the Indicator**
1. **Yellow Phase (Preparation):** The lines and the info panel are yellow. The script has found the X, A, B, and C points and is waiting for the D point to hit the Fibonacci target. Read the panel to see which pattern is forming.
2. **Green/Red Phase (Execution):** The target is hit! The panel turns Green (Bullish) or Red (Bearish). The PRZ box and TP/SL lines appear. This is your signal to look for reversal price action.
**Customizable Settings**
* **Wave Size (Pivot):** Adjusts the sensitivity of the ZigZag engine. Use lower values (e.g., 5-10) for scalp setups and higher values (e.g., 30-50) for macro swing trading.
* **Tolerance (%):** Financial markets are messy. The tolerance setting (default 10%) allows the script to catch valid patterns even if they miss the exact Fibonacci ratio by a few fractions.
* **Language:** Fully supports both English and Turkish interfaces.
* **Visual Toggles:** Turn the Auto-Fibo lines or the "Waiting" (Yellow) lines on/off to suit your visual preference.
*Disclaimer: Harmonic patterns represent high-probability reversal zones, not absolute guarantees. Always use the provided Stop Loss level and practice proper risk management.*
Gösterge

Stochastic Potential Zones
Stochastic Potential Zones
Most indicators try to tell you where price is.
This one tries to tell you where price is most likely to settle.
That is the whole point.
The math comes from stochastic stability and risk dominance.
In simple terms, a system can have two stable outcomes, but one of them is usually easier to reach and easier to defend. Over time, that easier state tends to dominate.
This script applies that exact idea to price.
The indicator builds two structural basins from recent pivots:
the bull basin forms around the latest meaningful swing low
the bear basin forms around the latest meaningful swing high
Those are not random zones. They are the two structural areas the market is most likely to coordinate around.
Then the script asks the important question:
Which side is easier for the market to coordinate around right now?
To answer that, each side gets a resistance score.
Bull resistance rises when:
price is still far from the bullish basin
short-term trend is leaning down
the current candle impulse is working against buyers
higher timeframes are not supportive
Bear resistance rises for the opposite reasons.
Volume can reduce that resistance.
That matters because if price is already pushing into a basin with participation behind it, the market has an easier time committing to that side.
So the script is not just checking location. It is checking how difficult it is for the market to “choose” each side.
Once those resistance scores are calculated, they are converted into stochastic potential:
lower resistance = higher potential
higher resistance = lower potential
That gives you two live readings:
Bull Pot
Bear Pot
These are the core outputs of the model.
From there, the indicator defines the current state:
if Bull Pot clearly exceeds Bear Pot, the market is in a Bull Convention
if Bear Pot clearly exceeds Bull Pot, the market is in a Bear Convention
if neither side has enough advantage, the market is Contested
This is where the indicator becomes practical.
It stops being a mathematical idea and becomes a market map.
The silver line is the separatrix.
That is the decision boundary between the two structural states.
It is the line that says: above here, the bullish basin has the easier path; below here, the bearish basin has the easier path; around here, the market is still arguing.
That is one of the most important visuals in the script.
The small flip markers show when the dominant basin changes.
These are not “buy” and “sell” buttons.
They are structural state changes.
That is a big difference.
A flip tells you the easier convention has changed. What you do with that information still depends on price action, context, and execution.
So how do you actually use it?
Use the basins as structural context.
Use the separatrix as a live decision boundary.
Use the table to see whether one side is genuinely dominant or whether the market is still contested.
And use the flip markers as confirmation that the structural preference has changed, not as a signal to trade blindly.
If i was to try and sum it up In one sentence:
Stochastic Potential Zones shows which structural side of the market is currently easier to sustain, and where the live boundary between those competing states sits.
Advice to myself for the future to become better:
I would love to hear your thoughts and opinions on this indicator. I tried going into detail through images on how the indicator may look like in certain states.
I know i used the bar replay and obviously cherry-picked certain conditions. However, it is just to give you an example of how the indicator would look like in real market time. Gösterge

Gösterge
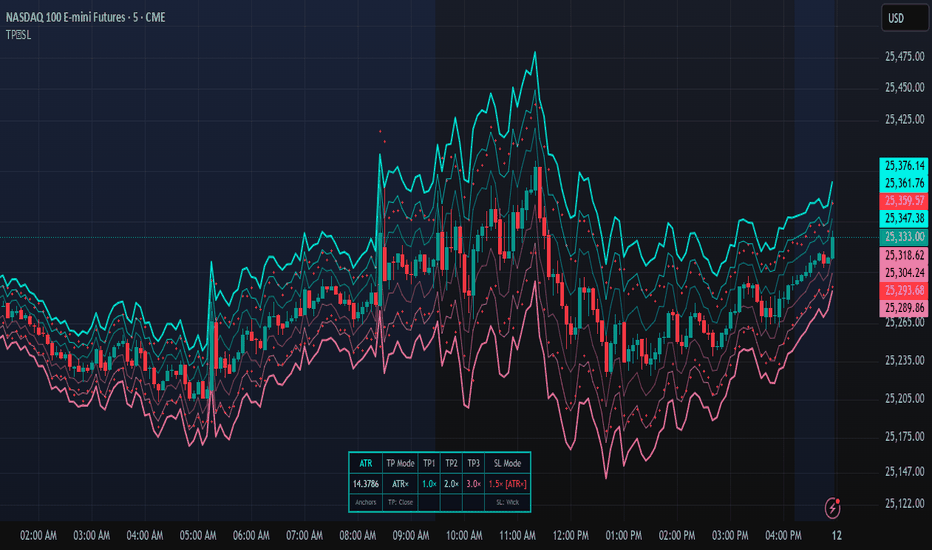
Adaptive Pressure Trail [JOAT]Adaptive Pressure Trail
Introduction
Adaptive Pressure Trail is an open-source overlay indicator that combines an HMA-based adaptive ratchet trail with a custom volume-weighted Money Flow Index to classify bars into bull pressure, bear pressure, and neutral states. The system uses a three-layer visual architecture — an outer volatility cloud, an inner ratchet band fill, and a core gradient pressure fill between the HMA baseline and candle mid-body — to create a clear, spatially organized picture of momentum and direction on any chart. Volatility squeeze detection identifies compression phases before potential breakouts, and high-confidence signals fire when a squeeze releases simultaneously with pressure alignment.
The core problem this indicator solves is that most trail-based systems are either too reactive (flipping constantly on noise) or too slow (missing meaningful moves). The HMA ratchet addresses this: the upper band only falls and the lower band only rises after a direction flip, preventing whipsaw while remaining responsive when momentum is genuine. Layering a volume-weighted MFI filter on top means a directional trail alone is not sufficient — volume-backed money flow must confirm the move before the indicator reports active pressure.
Core Concepts
1. HMA Adaptive Ratchet Trail
The trail baseline is computed using a Hull Moving Average, which provides low lag while remaining smooth. ATR-scaled upper and lower bands are applied around the HMA. The ratchet rule prevents band noise: the upper band can only move downward (or reset when price closes above it), and the lower band can only move upward (or reset when price closes below it). Direction flips when price closes through the active band. This creates a one-directional drift that is far more stable than a raw crossover trail:
The trail direction variable persists with var and updates each bar. Direction == 1 means the lower band is the active trail (bullish), direction == -1 means the upper band is the active trail (bearish).
2. Custom Volume-Weighted MFI
Rather than using a standard price-only momentum oscillator, the pressure engine uses a custom volume-weighted Money Flow Index. Positive flow is volume multiplied by HLC3 on bars where HLC3 increased; negative flow is volume multiplied by HLC3 on bars where HLC3 decreased. These are summed over the MFI length and converted to a 0-100 scale using the RSI formula. The result is smoothed with an HMA for responsiveness. This produces a momentum measure that is inherently volume-weighted — large-volume moves carry more influence than low-volume drift. The MFI is further smoothed to distinguish sustained pressure from transient spikes.
3. Pressure Regime Classification
Bull pressure is active when the trail direction is bullish AND the smoothed MFI is above the bull threshold. Bear pressure is active when the trail direction is bearish AND MFI is below the bear threshold. Neutral is everything else. This dual-condition structure means you need both directional commitment from the ratchet trail AND volume-backed momentum to enter a pressure state. Either condition alone is insufficient.
A rolling 50-bar history tracks what percentage of recent bars were in an active pressure state, producing a Pressure Strength percentage that indicates whether the current regime has been sustained or is a brief spike.
4. Squeeze Detection
Band width — the distance between the upper and lower ratchet bands — is compared to its own SMA. When band width drops below 72% of its recent average, the market is compressing. A squeeze start fires a golden diamond marker at the trail level. A squeeze release fires a larger circle marker. The high-confidence signal fires when a squeeze release coincides with an active pressure state, identifying the highest-probability setups where compressed volatility breaks out in a confirmed directional context.
5. Three-Layer Visual Architecture
The chart renders three nested visual layers:
Outer Cloud: The ATR envelope (cloudMult * ATR from HMA center) filled with a very transparent directional color — gives spatial context to where price is within the volatility range
Inner Band Fill: The ratchet upper and lower bands filled with medium transparency — shows the active directional channel
Core Pressure Fill: A gradient fill between the HMA baseline and the candle mid-body — transparent at the HMA, saturated at the body, colored by pressure state
The trail line itself uses three stacked plots at widths 10, 5, and 2 to create a neon glow shadow effect. Bar coloring uses color.from_gradient driven by MFI intensity, producing increasingly saturated candles as momentum builds.
Features
HMA Ratchet Trail with Triple-Layer Glow: Direction-persistent adaptive trail rendered as a neon glow (widths 10/5/2) using the bullish lime or bearish fuchsia color
Outer ATR Volatility Cloud: Wide ATR envelope filled directionally, providing spatial context at a glance
Inner Ratchet Band Fill: Gradient-filled active channel between upper and lower ratchet bands
Core Pressure Gradient: Background-to-body gradient between HMA and mid-body, colored by current pressure state
HMA Skeleton Reference: Subtle neutral line showing the raw HMA baseline beneath all fills
Volatility Squeeze Markers: Golden diamonds during compression, circle flash on breakout
High-Confidence Signal: Starred HC LONG / HC SHORT labels when squeeze releases into confirmed pressure alignment — the highest-quality setup the system produces
Volume Impulse Labels: When a strong directional candle exceeds the volume threshold, a label shows the volume ratio (e.g., 2.1x vol) at the bar
MFI Cross Markers: Small triangles on the trail when MFI crosses the 50 level, marking momentum regime shifts
TP Signals: Labeled plotshapes when MFI reaches overbought/oversold extremes in the trail direction
Pressure Strength Percentage: Rolling 50-bar % of time spent in active pressure — distinguishes sustained trends from brief spikes
Gradient Bar Coloring: color.from_gradient driven by MFI intensity — bars saturate as momentum builds and fade as it weakens
11-Row Dashboard: Pressure state, trail direction, MFI reading, pressure score, pressure strength %, volatility state, band width, trend bars, trail price, ATR
Input Parameters
Adaptive Trail:
Trail HMA Length: Period for the HMA baseline (default 21)
Trail ATR Multiplier: Width of inner ratchet bands (default 1.8)
Trail ATR Length: ATR lookback for band calculation (default 14)
Outer Cloud ATR Width: Outer envelope width multiplier (default 3.2)
Squeeze Reference Bars: SMA period for band-width baseline (default 20)
Pressure Filter:
MFI Length: Volume-weighted money flow lookback (default 14)
MFI Smoothing: HMA smoothing on raw MFI (default 7)
MFI Bull/Bear Thresholds: Activation levels for pressure states (default 62/38)
Signals:
TP Overbought/Oversold Levels: MFI levels that trigger TP signals (default 78/22)
Impulse Volume Multiplier: Volume multiple above SMA required for impulse label (default 1.3)
Visuals:
Toggles for entry signals, TP signals, glow, cloud, pressure fill, squeeze markers, and dashboard
Bull Color (default lime #a3e635), Bear Color (default fuchsia #e879f9), Neutral Color (default slate #94a3b8)
How to Use This Indicator
Primary Setup — Trend Following with Pressure Confirmation:
Look for the trail to flip direction (circle marker on trail). Wait for MFI to cross the bull or bear threshold, confirming the pressure state activates. Enter in the trail direction once the pressure fill color saturates. Trail your stop at the active trail line. Exit on a TP signal or when the pressure state deactivates.
High-Confidence Setup:
Wait for squeeze markers (golden diamonds) to appear, indicating compression. When the squeeze releases (larger circle flash) and the pressure state is simultaneously active, the HC LONG or HC SHORT label fires. These are the setups where compressed volatility breaks out with momentum behind it.
Filtering with Pressure Strength:
The dashboard Pressure Strength percentage tells you how sustained the current move has been. Values above 60% indicate a mature trend. Values below 30% indicate the pressure state is new or unstable. Adjust position sizing accordingly.
Reading Impulse Candles:
Volume impulse labels (e.g., "2.1x vol") mark bars where a strong directional move was accompanied by significantly elevated volume. These often mark the start or acceleration of a pressure phase and can serve as reference points for support/resistance.
APT dashboard showing bull pressure active, MFI at 71.2, P-Score 7.1/10, P-Strength at 64%, band width expanding after a squeeze release, and the trail at current price with ATR reference
Indicator Limitations
The ratchet trail requires a confirmed close through the active band to flip direction. On higher-timeframe charts with large candle bodies this can mean the flip is confirmed well after the actual turning point
The volume-weighted MFI requires volume data. On instruments with unreliable volume reporting (some forex pairs, synthetic indices) the pressure filter may be less meaningful than on equities or futures
Squeeze detection uses a 72% band-width threshold. In persistently low-volatility instruments this threshold may trigger too frequently; adjusting the Squeeze Reference Bars parameter can help
High-confidence signals require both a squeeze release and active pressure simultaneously. On trending markets with no compression phase, HC signals will be rare
MFI thresholds at 62/38 are defaults designed for balanced use; highly trending instruments may require raising the bull threshold and lowering the bear threshold to reduce false pressure activations
Originality Statement
This indicator is original in its combination of a ratchet-constrained HMA trail with a custom volume-weighted MFI, the three-layer nested visual system, and the squeeze-breakout confluence signal. While HMA trails and MFI oscillators exist independently, this publication is justified because:
The ratchet logic applied to HMA (rather than ATR midline or EMA) reduces lag while preventing the constant flipping common in standard trail indicators
The custom volume-weighted MFI differs from the standard MFI by using HLC3 as the price component with RSI-formula normalization, producing a smoother measure with better noise rejection
The three-layer nested fill architecture (outer cloud, inner band, core pressure gradient) provides a spatially organized visual system where the distance between layers communicates volatility context
Squeeze detection integrated with pressure confirmation for HC signals is a novel combination that identifies setups at the intersection of volatility compression and momentum alignment
The Pressure Strength rolling percentage provides a trend maturity measure not present in standard trail indicators
Disclaimer
This indicator is provided for educational and informational purposes only and does not constitute financial advice or a recommendation to buy or sell any financial instrument. Past performance of any pattern or signal does not guarantee future results. All trading involves substantial risk. Always use proper risk management and conduct your own independent analysis.
— Made with passion by officialjackofalltrades
Gösterge

Cadence Veil [JOAT]Cadence Veil /b]
Introduction
Cadence Veil is an advanced open-source regime classification indicator that fuses an H-Infinity adaptive filter, R-squared efficiency gating, dual-window chop scoring, and Kaufman adaptive efficiency into a unified five-state regime engine. The indicator classifies every bar into one of five market states — Expansion Bull, Expansion Bear, Compression, Whipsaw, or Dormant — using a hysteresis state machine that prevents rapid flip-flopping between regimes. It then overlays volatility envelope bands, a ZEMA bias ribbon, structural pivot tracking, regime shift boxes, and gradient visualization to create a complete market phase recognition system.
The core problem this indicator solves is regime misidentification. Most traders apply the same strategy regardless of market conditions — trend-following in chop, mean-reversion in trends, or trading during dormant periods when nothing meaningful is happening. Each of these mismatches leads to losses. Cadence Veil explicitly classifies the current regime so traders can select the appropriate strategy for the conditions. A compression regime calls for breakout preparation. An expansion regime calls for trend-following. A whipsaw regime calls for caution or sitting out entirely. A dormant regime means the market lacks the energy for any strategy to work reliably.
Core Concepts
1. H-Infinity Adaptive Filter
The centerline of the indicator uses an H-Infinity filter rather than a conventional moving average. H-Infinity filtering is a control theory technique designed to produce optimal estimates under worst-case noise conditions. Unlike a Kalman filter (which assumes Gaussian noise), the H-Infinity filter makes no assumptions about noise distribution, making it more robust in financial markets where price noise is decidedly non-Gaussian:
for i = 0 to hinfOrder - 1
float s = array.get(hinfState, i)
float e = array.get(hinfError, i) + hinfNoise
float g = e / (e + hinfDist)
array.set(hinfState, i, s + g * (close - s))
array.set(hinfError, i, (1.0 - g) * e)
The filter maintains internal state and error estimates that adapt each bar. The gain parameter (error divided by error plus disturbance) determines how much the filter trusts new data versus its existing estimate. Higher disturbance values make the filter more conservative (smoother); lower values make it more responsive. The filter order parameter controls how many state dimensions are tracked, with higher orders providing more sophisticated noise modeling.
2. R-Squared Efficiency Gate
R-squared measures how well price movement fits a linear regression line. A high R-squared (close to 1.0) means price is moving in a straight, efficient line — a strong trend. A low R-squared (close to 0) means price is moving randomly with no directional efficiency:
float r2Raw = math.pow(ta.correlation(close, bar_index, effLen), 2)
float r2Smooth = ta.sma(r2Raw, effSmooth)
The indicator uses an auto-calibrating threshold: the rolling mean of R-squared plus k standard deviations. This means the threshold adapts to the instrument's typical trending behavior. A hysteresis band prevents the gate from flickering — once open, R-squared must drop further to close the gate than it needed to rise to open it.
3. Dual-Window Chop Scoring
Chop is measured using the efficiency ratio concept: the net price movement divided by the total path length over a window. A perfectly straight move scores 0 (no chop); a move that goes nowhere despite lots of bar-to-bar movement scores 1 (maximum chop). The indicator uses two windows — a fast window (default 14 bars) for recent chop and a slow window (default 50 bars) for structural chop — and blends them:
f_chop(int len) =>
float netMove = math.abs(close - close )
float pathLen = math.sum(math.abs(close - close ), len)
pathLen == 0.0 ? 1.0 : 1.0 - (netMove / pathLen)
float chopBlend = (chopFastVal + chopSlowVal) / 2.0
The dual-window approach catches both short-term whipsaws and longer-term structural chop that a single window might miss.
4. Kaufman Efficiency Ratio
The Kaufman ER provides a third independent measure of trend quality. It compares the absolute net price change over N bars to the sum of all bar-to-bar changes over the same period. Values near 1.0 indicate efficient, directional movement; values near 0 indicate noisy, non-directional movement. This complements R-squared (which measures linearity) and chop score (which measures path efficiency) by measuring absolute directional efficiency.
5. Composite Trend Score and State Machine
The three measures are blended into a single composite trend score:
float trendScore = (kaufER * 0.35) + ((1.0 - chopBlend) * 0.35) + (r2Smooth * 0.30)
This score, combined with the H-Infinity filter slope and volatility ratio, feeds into a five-state machine with persistence requirements. A candidate state must hold for a configurable number of consecutive bars (default 3) before the regime officially transitions. This prevents single-bar noise from triggering false regime changes.
The five states are:
Expansion Bull: R-squared gate open, trend score above threshold, H-Infinity slope positive
Expansion Bear: R-squared gate open, trend score above threshold, H-Infinity slope negative
Compression: High chop score, low volatility ratio — market is coiling
Whipsaw: High volatility but also high chop — dangerous conditions with large moves in both directions
Dormant: None of the above conditions met — market lacks energy or direction
6. Volatility Envelope Bands
Adaptive bands are constructed around the H-Infinity line using ZEMA-smoothed ATR. The bands scale their width based on the current regime: narrower during compression (0.7x), wider during expansion (1.2x), and standard during normal conditions. This regime-adaptive scaling means the bands contract when the market is coiling (tightening the range for breakout detection) and expand when the market is trending (giving the trend room to breathe).
Features
Five-State Regime Classification: Clear categorical identification of the current market phase with color-coded rendering throughout the indicator
H-Infinity Core Line with Glow: The adaptive filter line renders with a gradient glow whose color and intensity reflect the current regime and trend score
Regime Shift Boxes: When the regime changes, a colored box is drawn that expands to encompass the price range of the new regime, providing a visual record of regime transitions
Regime Shift Labels: Labels at regime transitions show the new regime abbreviation and the trend score at the time of transition
ZEMA Bias Ribbon: A filled ribbon between the H-Infinity line and its ZEMA shows directional bias with bull/bear coloring
Structural Pivot Detection: Swing highs and lows are identified and labeled with regime context — pivots formed during expansion regimes are colored differently than those formed during compression
Structure Lines: Dashed horizontal lines at the most recent swing high and low provide support/resistance reference
Envelope Breach Detection: The dashboard reports whether price is inside the bands, above/below the inner band, or above/below the outer band
Composite Signal Strength: A 0-100 score measuring how aligned all subsystems are (R-squared gate, Kaufman ER, chop score, and ZEMA bias)
Regime History Tracking: The dashboard shows the last three regime states in sequence, revealing the pattern of market phase transitions
Gradient Background Zones: Background coloring shifts on a gradient from compression tones to the current regime color based on the trend score
Regime-Aware Bar Coloring: Candle colors reflect the current regime with momentum-based gradient intensity
14-Row Dashboard: Displays regime state, duration, trend score, signal strength, R-squared gate status, chop blend, Kaufman ER, volatility ratio, H-Infinity gain, ZEMA bias, swing levels, envelope position, and regime history
Input Parameters
H-Infinity Filter:
Filter Order: Number of state-space dimensions (default: 3, range: 1-8)
Process Noise: Expected noise level (default: 0.5)
Disturbance: External disruption parameter (default: 1.0)
Efficiency Gate:
R-Squared Length: Correlation calculation period (default: 30)
Smoothing: R-squared smoothing period (default: 10)
Threshold k: Standard deviations above mean for auto-threshold (default: 1.0)
Chop Detector:
Fast Window: Short-term chop measurement (default: 14)
Slow Window: Long-term chop measurement (default: 50)
State Engine:
Entry Persistence: Consecutive bars required for regime transition (default: 3)
Hysteresis Band: Width of the hysteresis zone to prevent flickering (default: 0.15)
Volatility Envelope:
Inner/Outer ATR Multipliers: Band distance from the core line (default: 1.2/2.4)
ATR Length: Period for ATR calculation (default: 14)
Visuals:
Toggles for envelope bands, ZEMA bias ribbon, structural pivots, structure lines, regime shift boxes, regime shift signals, background zones, bar coloring, and dashboard
How to Use This Indicator
Step 1: Identify the Current Regime
The dashboard's regime field and the background coloring immediately tell you the market phase. This is the most important piece of information — it determines which strategy to apply.
Step 2: Match Strategy to Regime
Expansion Bull/Bear: Use trend-following strategies. Enter pullbacks to the H-Infinity line or inner band in the direction of the expansion
Compression: Prepare for a breakout. Tighten stops, reduce position sizes, and watch for the regime to shift to expansion. The ZEMA bias may hint at the breakout direction
Whipsaw: Reduce exposure or sit out. This regime produces large moves in both directions that stop out trend-followers and mean-reversion traders alike
Dormant: No edge exists. Wait for the market to wake up
Step 3: Use Signal Strength for Conviction
The composite signal strength (0-100) tells you how aligned all subsystems are. A 75+ score during an expansion regime is high-conviction. A 25 score during expansion suggests the regime may be weakening.
Step 4: Monitor Regime Transitions
Regime shift boxes and labels mark exactly where transitions occurred. The most profitable trades often come at the transition from compression to expansion — the breakout from a coiled market.
Step 5: Read the Regime History
The history chain (e.g., "COMP > EXP+ > DORM") reveals the market's recent phase pattern. A sequence like "COMP > EXP+ > COMP > EXP+" suggests a market that trends in bursts between consolidation periods.
Cadence Veil showing a regime transition sequence: compression (purple box) resolving into expansion bull (green box), with the H-Infinity line glow intensifying, envelope bands widening, and the trend score rising in the dashboard
Indicator Limitations
The H-Infinity filter, while theoretically robust, has three parameters (order, noise, disturbance) that significantly affect behavior. Optimal settings vary across instruments and timeframes and may require experimentation
The persistence requirement for regime transitions (default 3 bars) creates a delay. Fast regime changes may be identified several bars after they begin. This is a deliberate trade-off for stability
The five-state classification is a simplification of continuous market behavior. Markets can exist in states that don't cleanly fit any category, and the boundaries between states are inherently fuzzy
R-squared, chop score, and Kaufman ER all use lookback windows. They describe what the market has been doing, not what it will do. A regime can change immediately after being classified
The whipsaw state is identified but no strategy is recommended for it because whipsaw conditions are inherently difficult to trade profitably. The indicator's value here is in warning you to reduce exposure
Volatility envelope bands adapt to the regime but still use ATR, which is backward-looking. Sudden volatility shifts (news events, gaps) may not be reflected in the bands for several bars
Originality Statement
This indicator is original in its application of control theory (H-Infinity filtering) to market regime classification and its synthesis of multiple independent efficiency measures into a unified state machine. While regime detection and adaptive filtering are established concepts, this indicator is justified because:
The H-Infinity filter is rarely used in technical analysis. Its worst-case noise optimization makes it theoretically more appropriate for financial markets than the more common Kalman filter, which assumes Gaussian noise
The triple-measure efficiency assessment (R-squared linearity + dual-window chop + Kaufman efficiency) provides more robust regime detection than any single measure. Each captures a different aspect of market behavior
The five-state classification with hysteresis persistence requirements produces stable, actionable regime labels rather than the flickering binary (trending/ranging) classifications common in simpler indicators
Regime-adaptive volatility envelope scaling automatically adjusts band behavior to the detected market phase, providing context-appropriate support/resistance levels
The composite signal strength score synthesizes all subsystems into a single conviction measure
Regime shift boxes provide a visual record of market phase transitions that aids in pattern recognition across longer timeframes
Disclaimer
This indicator is provided for educational and informational purposes only. It is not financial advice or a recommendation to buy or sell any financial instrument. Trading involves substantial risk of loss. Regime classifications are based on historical data analysis and do not predict future market phases. A market classified as "Expansion Bull" can reverse at any time. Compression does not guarantee a subsequent breakout, and the direction of any breakout is not predicted by the compression classification. Always use proper risk management and conduct your own analysis. The author is not responsible for any losses incurred from using this indicator.
-Made with passion by officialjackofalltrades
Gösterge
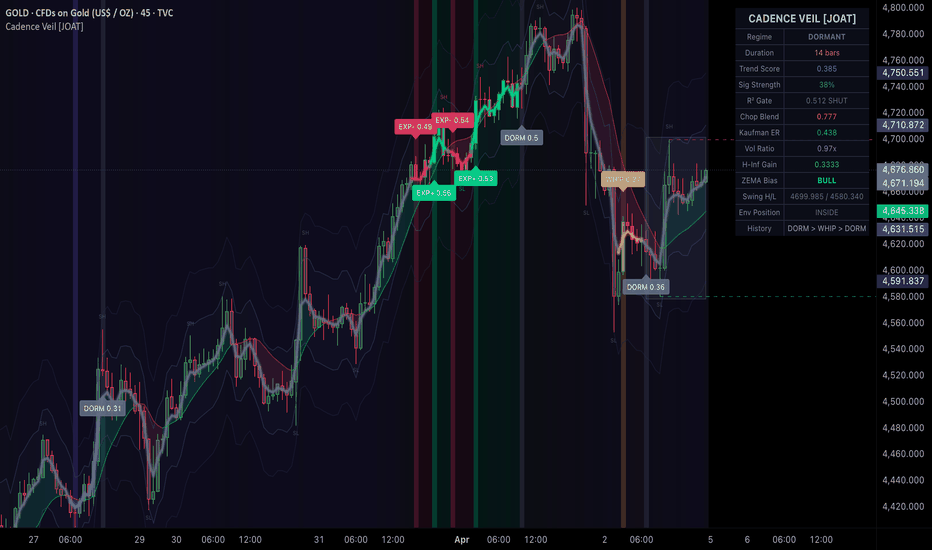
ABCD Harmonic Projection [WillyAlgoTrader]📐 ABCD Harmonic Projection is an overlay indicator that automatically detects ABCD harmonic patterns from ZigZag pivots, validates them against Fibonacci ratio constraints (BC/AB retracement + CD/AB extension), scores each pattern with a 4-factor quality engine (0–100), projects the D-point completion zone, and draws Target and Stop zones with Fibonacci extension and retracement levels — with full TP/SL outcome tracking and separate bull/bear win rate statistics.
The ABCD pattern is one of the foundational harmonic structures: four alternating swing points (A→B→C→D) where the BC leg retraces a Fibonacci portion of the AB leg, and the CD leg extends from C toward a projected D-point that is a Fibonacci ratio of the AB leg. When price reaches the D-point, the pattern completes — and a reversal or continuation move is expected. This indicator automates the entire detection-to-target workflow: find the swings, measure the ratios, validate the geometry, project the target, and track the outcome.
🧩 WHY THESE COMPONENTS WORK TOGETHER
Manually identifying ABCD patterns requires eyeballing four pivot points, measuring two Fibonacci ratios, estimating the D-point projection, and drawing the target zone — across multiple instruments and timeframes. Most traders miss patterns or miscalculate ratios.
This indicator chains each step into an automated pipeline:
ZigZag pivot detection → 4-point ABCD extraction → BC/AB ratio validation → CD/AB extension calculation → D-point projection → 4-factor quality scoring → Target Zone + Stop Zone placement → Fibonacci extension/retracement overlay → TP/SL outcome tracking → Win rate statistics
The ZigZag engine ensures only confirmed alternating swings are used (no noise pivots). The ratio validation filters patterns to only those within Fibonacci-valid ranges. The quality scoring ranks patterns by how close they are to ideal geometry. The D-point projection gives a specific price target — not a vague area. And the Target/Stop zones provide precise trade management levels anchored to the pattern's own geometry.
🔍 WHAT MAKES IT ORIGINAL
1️⃣ ZigZag pivot engine with direction management.
The indicator uses a directional ZigZag that enforces strict alternation: after a swing high, only a swing low is accepted (and vice versa). If price makes a higher high during an existing up-leg, the previous swing high is updated in place (not duplicated). This prevents the common problem of multiple consecutive highs being treated as separate pivots.
Pivots are detected using ta.pivothigh/ta.pivotlow with configurable lookback (default 8 bars). The ZigZag stores prices, bar indices, and directions in parallel arrays — providing the last 200 pivots for pattern scanning.
2️⃣ Fibonacci-validated ABCD pattern detection.
When a new pivot is confirmed and at least 4 pivots exist, the indicator extracts the most recent A, B, C points and validates:
— BC/AB retracement ratio : must be between minBcAbRatio (default 0.382) and maxBcAbRatio (default 0.886). Classic ABCD ratios are 0.382, 0.500, 0.618, 0.786, and 0.886. Patterns outside this range are rejected.
— ATR minimum swing filter : the AB leg must be at least 1× ATR in size — filtering out noise patterns during low-volatility bars.
— Minimum leg depth : AB must span at least 3 bars — ensuring the pattern has temporal structure, not just a single spike.
Pattern direction: if B > A → bullish ABCD (D projected above C). If B < A → bearish ABCD (D projected below C).
The D-point is projected from C using the average of the configurable CD/AB ratio range: projectedD = C + direction × |AB| × avgCdAbRatio.
3️⃣ 4-factor pattern quality scoring (0–100).
Each detected pattern receives a quality score from four dimensions:
— 📐 Fibonacci precision (45 pts) : how close BC/AB is to the nearest standard Fibonacci level (0.382, 0.500, 0.618, 0.786, 0.886, 1.000, 1.272, 1.618). Exact Fib ratio = full points. 0.05 away = partial. 0.18+ away = zero. This is the most heavily weighted factor because Fibonacci alignment is the core of harmonic pattern validity.
— ⏱️ Time symmetry (25 pts) : the ratio of estimated CD bars to AB bars. Perfect symmetry (CD bars = AB bars) = 25 points. Asymmetric patterns (one leg much longer) score lower.
— ⚖️ Price symmetry (20 pts) : BC retracement depth relative to 0.618 — deeper retests (closer to 0.618) score higher. Very shallow pullbacks (e.g., 0.236) receive fewer points.
— 📏 Leg maturity (10 pts) : AB leg length in bars — patterns with 8+ bars get full points, 5+ get 7, 3+ get 3. Single-bar spikes score zero.
Patterns below the Min Pattern Score threshold (default 40) are not displayed.
4️⃣ Fibonacci extension levels projected from C.
Four AB extension levels are drawn from point C in the direction of the pattern:
— 0.786 × |AB| — shallow completion
— 1.000 × |AB| — classic equal-leg ABCD
— 1.272 × |AB| — extended completion
— 1.618 × |AB| — maximum extension
The 1.0 level is drawn thicker (2px, less transparency) as it represents the ideal equal-leg completion. Each level includes a price label. Additionally, the measured BC/AB retracement ratio is displayed at the midpoint of the BC leg for reference.
5️⃣ Fibonacci retracement levels within C→D (partial TP targets).
For active patterns, three retracement levels are drawn between C and the projected D:
— 0.382 of CD range — first partial profit target
— 0.500 of CD range — mid-target
— 0.618 of CD range — aggressive partial take
These provide natural exit levels before the full D-point is reached — useful for scaling out of positions progressively.
6️⃣ Target Zone + Stop Zone with geometric sizing.
On each pattern:
— TARGET ZONE : a band around the projected D-point, sized at 10% of the CD range. For bullish patterns: the zone sits just below D. For bearish: just above D. This is where the pattern completion trade expects to reach profit.
— STOP ZONE : a band around point C, also sized at 10% of CD range. For bullish patterns: below C. For bearish: above C. If price returns past C, the pattern structure is broken.
Both zones extend rightward until price touches the target zone (tracked by touch bar), or the pattern resolves (TP/SL hit). Zones use distinct colors: green for target, red for stop.
7️⃣ TP/SL outcome tracking with separate bull/bear statistics.
Each active pattern monitors:
— TP hit : price reaches the projected D-point (high ≥ D for bull, low ≤ D for bear)
— SL hit : price returns past C against the pattern direction (low ≤ C for bull, high ≥ C for bear)
— Simultaneous TP+SL on the same bar → resolved as loss (conservative)
On TP hit: R:R is calculated as |entry to TP| / |entry to SL| and accumulated. The dashboard shows separate bull and bear win rates with average R:R on wins.
8️⃣ Active-only display mode.
When "Show Active Only" is enabled (default), completed patterns (TP or SL already hit) are hidden — only the current live pattern remains on the chart. When disabled, up to maxPatterns historical patterns are shown for context. This prevents chart clutter while maintaining full statistical tracking.
9️⃣ One-active-pattern constraint.
The indicator only allows one active pattern at a time. When an active pattern exists (status = 0), no new patterns are detected. This prevents overlapping projections and conflicting zones. A new pattern can only be detected after the current one resolves (TP or SL).
⚙️ HOW IT WORKS — CALCULATION FLOW
Step 1 — ZigZag: Directional pivot detection with alternation enforcement. Higher highs update existing swing (no duplicate). Lower lows same. Pivots stored in parallel arrays.
Step 2 — Pattern extraction: On each new confirmed pivot: extract A (3rd-to-last), B (2nd-to-last), C (latest). Compute AB length, BC length, BC/AB ratio.
Step 3 — Validation: BC/AB within Fibonacci range? AB ≥ ATR? AB ≥ 3 bars? No active pattern already?
Step 4 — Scoring: 4 factors: Fibonacci precision (45), time symmetry (25), price symmetry (20), leg maturity (10). Score ≥ minScore → pattern accepted.
Step 5 — Projection: D = C + direction × |AB| × avgCdAbRatio. Bars capped at maxBarsProjection.
Step 6 — Drawing: On barstate.islast: delete-and-redraw all visible patterns. AB and BC legs as solid lines. CD projection as dotted. A/B/C/D labels. Score label. Target/Stop zones as boxes. Fib extension and retracement levels as dashed lines with price labels.
Step 7 — Evaluation: Each bar: check all active patterns for TP/SL hits. Update status, accumulate win/loss stats, record R:R.
📖 HOW TO USE
🎯 Quick start:
1. Add the indicator — ABCD patterns appear automatically as colored leg lines with A/B/C/D labels
2. Yellow dotted line from C = projected path to D
3. Green "TARGET ZONE" box = where price should reach (take profit)
4. Red "STOP ZONE" box = where the pattern is invalidated (stop loss)
5. Blue dashed lines = Fibonacci extension levels (0.786, 1.0, 1.272, 1.618)
6. Blue dotted lines = partial TP targets (0.382, 0.5, 0.618 of CD)
7. "Long"/"Short" label = confirmed entry signal
👁️ Reading the chart:
— 🟢 Green legs + labels = bullish ABCD (D above C, expecting up-move)
— 🔴 Red legs + labels = bearish ABCD (D below C, expecting down-move)
— 🟡 Dotted projection line = expected path C → D
— 🟢 "TARGET ZONE" box = profit target area around projected D
— 🔴 "STOP ZONE" box = invalidation area around C
— 🔵 Dashed lines = Fib extension levels from C (0.786/1.0/1.272/1.618 of AB)
— 🔵 Dotted lines = CD retracement levels (partial TPs: 0.382/0.5/0.618)
— Score label (e.g., "72%") = pattern quality
📊 Dashboard fields:
— Patterns: active / total count
— Last Signal: direction + status (Active/TP ✓/SL ✗) + score
— Bull W/L: wins/losses and win rate for bullish patterns
— Bear W/L: wins/losses and win rate for bearish patterns
— Avg R:R: average reward-to-risk on winning bull/bear trades
— ATR: current value for reference
— Timeframe, version
🔧 Tuning guide:
— Too many patterns: increase ZigZag Length (12–21), increase Min Score (60+), enable ATR filter
— Too few patterns: decrease ZigZag Length (5–8), decrease Min Score (30), widen BC/AB ratio range
— Patterns too small: increase ATR filter or ZigZag Length
— Want only perfect geometry: narrow BC/AB to 0.500–0.786, set CD/AB to 0.9–1.1, Min Score 70+
— Extended patterns: set Max CD/AB to 1.618 or higher
⚙️ KEY SETTINGS REFERENCE
⚙️ Main:
— ZigZag Length (default 8): pivot detection lookback
— Pivot Sources : configurable high/low sources
📐 Pattern:
— Min/Max BC/AB Ratio (default 0.382/0.886): Fibonacci retracement range
— Min/Max CD/AB Ratio (default 0.786/1.618): extension range for D projection
— Min Pattern Score (default 40): quality threshold
— ATR Filter (default On): minimum swing size
— Max Patterns (default 3): display limit
— Active Only (default On): hide completed patterns
🎨 Visual:
— Buy/Sell signals, D projection, Fib levels, TP/SL zones, A/B/C/D labels, score (all toggleable)
— Auto / Dark / Light theme
🔧 Advanced:
— Max Bars for D Projection (default 200): limits distant projections
🔔 Alerts
— 🟢 LONG ABCD / 🔴 SHORT ABCD — entry, TP, SL, score, pattern type
All support plain text and JSON webhook format. Bar-close confirmed.
⚠️ IMPORTANT NOTES
— 🚫 No repainting. All signals require barstate.isconfirmed and newPivot (confirmed ZigZag pivot). Patterns are detected after the pivot bar closes. Drawings are rendered on barstate.islast using delete-and-redraw — previous bar's pattern state is final.
— 📐 The ZigZag enforces strict alternation : high → low → high → low. If price makes a higher high during an existing up-swing, the previous high is updated in place — no duplicate pivots are created. This is essential for correct A/B/C/D extraction.
— ⚖️ Only one active pattern is allowed at a time. New patterns are blocked until the current one resolves (TP or SL). This prevents conflicting signals and overlapping zones.
— 📊 The quality score is heavily weighted toward Fibonacci precision (45 out of 100 points). A pattern with BC/AB exactly at 0.618 scores much higher than one at 0.450. This reflects the harmonic principle that Fibonacci alignment is the primary measure of pattern validity.
— 🔒 Simultaneous TP+SL on the same bar is resolved as a loss (conservative) . This prevents ambiguous outcomes from inflating win rates.
— 📏 The D-point projection uses the average of the min/max CD/AB ratio range — not the exact 1.0 (equal legs). With default settings (0.786–1.618), the projected D is at 1.202× AB from C — between classic and extended. Adjust the CD/AB range to target specific completion types.
— 🛠️ This is a harmonic pattern detection and projection tool , not an automated trading bot. It identifies ABCD geometry, projects D-point targets, and provides structured trade zones — trade decisions remain yours.
— 🌐 Works on all markets and timeframes. Gösterge

V16E - Entry SystemUNDER TESTING
V16E - Entry System Description
================================
V16E is a 15 minute entry timing indicator designed to work alongside V16. Where V16 tells you a stock is worth trading on the daily chart, V16E tells you the precise moment to pull the trigger on the lower timeframe.
HOW IT WORKS
------------
V16E combines three indicators into a single score out of 100. Every bar the score updates in real time in the bottom right corner of the pane, so you can watch it build before a signal fires and anticipate entries before the arrow appears.
STOCHASTIC - 40 points - the primary trigger
---------------------------------------------
The Stochastic oscillator is the engine of V16E. It measures where price closed relative to its recent range and reacts faster than RSI on lower timeframes. A signal only fires when Stochastic crosses at or near an extreme - below 20 for longs, above 80 for shorts. The closer to the extreme the crossover happens, the more points it scores. The indicator also measures acceleration - how fast %K is moving after the cross. A sharp fast recovery scores more than a slow drift.
RSI - 30 points - momentum weight
-----------------------------------
RSI never blocks a signal in V16E. Instead it weights how strong the signal is. RSI deep in oversold territory (below 30) on a long signal scores the maximum. RSI in neutral territory still contributes but less. The indicator also checks the RSI signal line (a 9 EMA of RSI) for crossovers and measures the slope of RSI - a steep rise scores more than a flat one. A pullback setup where RSI dipped below 50 and is now recovering back above it scores the highest on the signal line component.
RVOL AND DELTA - 20 points - pressure confirmation
----------------------------------------------------
RVOL measures whether volume is above or below average. High relative volume means more participants are behind the move - making the signal more reliable. Delta measures where the candle closed within its own range, showing whether buyers or sellers won that specific bar. Delta is checked over a user adjustable lookback window to confirm sustained buying or selling pressure rather than a single noisy candle.
SIGNAL STRENGTH - ARROW SIZES
------------------------------
When the score is high enough and a crossover fires, an arrow appears in the pane:
- Large bright arrow = score 70 or above = strong signal
- Medium arrow = score 45 to 69 = moderate signal
- Small arrow = score below 45 = weak signal, use caution
KEY FEATURES
------------
Timeframe Lock
You can set V16E to calculate its score on the 1M, 3M, 5M, 15M, 30M or 60M timeframe regardless of what chart you have open. The visual RSI and Stochastic lines always follow the chart you are on, but the score always reflects the timeframe you chose in settings.
Session Filter
Toggleable option that blocks signals in the first N minutes of the trading session. Default is off because many strong entries happen in the first 45 minutes.
Consecutive Bar Confirmation
The signal must still be valid one bar after the crossover fires. This filters out fake crossovers that immediately reverse.
Daily ADX Bonus
Optional toggle that pulls the daily ADX directly into V16E. When the daily trend is strong and aligned with the entry direction, up to 10 bonus points are added to the score. Default is off.
Divergence Detection
Optional RSI divergence labels in the pane, off by default.
SCORING BREAKDOWN
-----------------
Indicator Component Max Points
--------- --------- ----------
Stochastic Zone (cross at extreme) 30
Stochastic Acceleration (K speed) 10
RSI Zone 16
RSI Signal line + 50 cross 8
RSI Slope (steepness) 6
RVOL Volume confirmation 10
Delta Candle pressure 10
Daily ADX Optional bonus +10
----------------------------------------------------------
Total 100 (110 with bonus)
Score Colours:
80 - 100 = Bright green (strong)
60 - 79 = Green (good)
40 - 59 = Yellow (moderate)
20 - 39 = Orange (weak)
0 - 19 = Red (no signal)
HOW TO USE IT WITH V16
-----------------------
Step 1 - Check V16 on the daily chart. Is the score 60 or above with a clear direction?
Step 2 - Open V16E on the same stock. Set the timeframe to 15M in settings.
Step 3 - Watch the score build in real time. When Stochastic approaches the extreme zone, RSI momentum is moving in the right direction and delta is confirming, the score climbs.
Step 4 - When the arrow fires with a score above 70, that is your entry.
SETTINGS REFERENCE
------------------
Timeframe Settings
Calculation Timeframe Current / 1M / 3M / 5M / 15M / 30M / 60M
RSI Settings
RSI Length Default 9 (optimised for 15M)
RSI Signal EMA Default 9
RSI Slope Lookback Default 3 bars
Stochastic Settings
%K Length Default 14
%K Smoothing Default 3
%D Smoothing Default 3
Overbought Level Default 80
Oversold Level Default 20
Near Extreme Zone Default 5 points
Acceleration Lookback Default 2 bars
Delta Settings
Delta Lookback Default 3 bars (adjustable 1-9)
Delta Threshold % Default 20%
Min Confirmed Bars Default 2
Session Filter
Enable Session Filter Default OFF
Block First N Minutes Default 45 minutes
Daily ADX Filter
Enable Daily ADX Bonus Default OFF
Daily ADX Length Default 14
Daily ADX Smooth Default 14
Daily ADX Threshold Default 25
VERSION HISTORY
---------------
V16E - Initial build combining RSI, Stochastic and Delta
- Added RVOL as volume confirmation
- Added timeframe lock (visuals follow chart, score follows setting)
- Added session filter (toggleable, default off)
- Added stochastic acceleration scoring
- Added RSI slope scoring
- Added consecutive bar confirmation
- Added daily ADX bonus (toggleable, default off)
- Added score table bottom right of pane
- Added divergence detection (optional, default off)
Gösterge

Gösterge
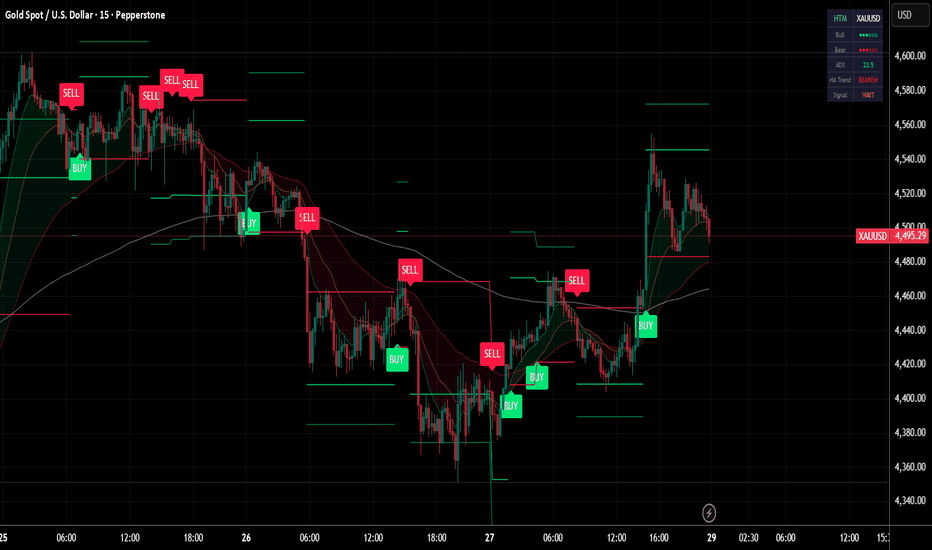
Divergence Constellation [JOAT]Divergence Constellation
Introduction
The Divergence Constellation is an advanced open-source multi-oscillator divergence detection system that combines RSI, MACD, TSI, and Stochastic analysis with sophisticated pivot detection and confluence scoring. This indicator identifies both regular and hidden divergences across multiple oscillators simultaneously, creating a constellation of divergence signals that reveal potential reversals and trend continuations with high probability.
Unlike single-oscillator divergence tools, the Divergence Constellation provides multi-dimensional divergence analysis through composite oscillator calculation, four-oscillator confluence scoring, regular and hidden divergence detection, and chart projection. The indicator is designed for traders who understand that divergences confirmed across multiple oscillators provide significantly higher probability setups than single-oscillator divergences.
Why This Indicator Exists
This indicator addresses the need for systematic multi-oscillator divergence analysis. By combining four distinct oscillators with confluence scoring, it reveals:
Regular Bullish Divergence: Price makes lower low, oscillators make higher low (reversal up signal)
Regular Bearish Divergence: Price makes higher high, oscillators make lower high (reversal down signal)
Hidden Bullish Divergence: Price makes higher low, oscillators make lower low (trend continuation up)
Hidden Bearish Divergence: Price makes lower high, oscillators make higher high (trend continuation down)
Confluence Scoring: Counts how many oscillators confirm the divergence (1-4 score)
Composite Oscillator: Unified oscillator combining all four components
Chart Projection: Divergence lines drawn on both oscillator pane and main chart
Core Components Explained
1. Four-Oscillator System
The indicator calculates four distinct oscillators, each providing unique momentum perspective:
RSI (Relative Strength Index):
Measures momentum by comparing average gains to average losses
Zero-centered (subtracts 50) for composite integration
Sensitive to overbought/oversold conditions
Default period: 14
MACD (Moving Average Convergence Divergence):
Measures relationship between two exponential moving averages
Histogram shows momentum acceleration/deceleration
Responsive to trend changes
Default periods: 12, 26, 9
TSI (True Strength Index):
Double-smoothed momentum indicator
Filters noise while preserving trend direction
Excellent for divergence detection
Default periods: 25, 13
Stochastic:
Compares close to recent high-low range
Zero-centered (subtracts 50) for composite integration
Identifies overbought/oversold extremes
Default periods: 14, 3
2. Composite Oscillator Calculation
All four oscillators are combined into a unified composite:
Composite = (RSI + MACD + TSI + Stochastic) / 4
This composite oscillator provides a balanced view of momentum across all four methodologies. Divergences are detected on the composite, then confirmed by checking individual oscillators.
3. Pivot Detection System
The indicator uses sophisticated pivot detection to identify divergence points:
Pivot Left/Right: Number of bars on each side for pivot confirmation (default: 5)
Price Pivots: Identifies swing highs and lows in price
Oscillator Pivots: Identifies swing highs and lows in each oscillator
Lookback Range: Min (5) to Max (60) bars for comparing pivots
Pivots must be confirmed (bars on both sides) before divergence analysis begins.
4. Regular Divergence Detection
Regular divergences signal potential reversals:
Regular Bullish Divergence:
Price makes lower low (current pivot low < previous pivot low)
Composite oscillator makes higher low (current pivot low > previous pivot low)
Indicates weakening downward momentum - potential reversal up
Best at oversold levels (composite < -20)
Regular Bearish Divergence:
Price makes higher high (current pivot high > previous pivot high)
Composite oscillator makes lower high (current pivot high < previous pivot high)
Indicates weakening upward momentum - potential reversal down
Best at overbought levels (composite > 20)
5. Hidden Divergence Detection
Hidden divergences signal trend continuation:
Hidden Bullish Divergence:
Price makes higher low (current pivot low > previous pivot low)
Composite oscillator makes lower low (current pivot low < previous pivot low)
Indicates strong underlying bullish momentum - trend continuation up
Confirms uptrend strength
Hidden Bearish Divergence:
Price makes lower high (current pivot high < previous pivot high)
Composite oscillator makes higher high (current pivot high > previous pivot high)
Indicates strong underlying bearish momentum - trend continuation down
Confirms downtrend strength
6. Confluence Scoring System
When a divergence is detected on the composite, the indicator checks all four individual oscillators:
Score 1/4: Only one oscillator confirms - weak divergence
Score 2/4: Two oscillators confirm - moderate divergence (minimum for signals)
Score 3/4: Three oscillators confirm - strong divergence
Score 4/4: All four oscillators confirm - extreme divergence (highest probability)
The minimum confluence score (default 2) filters out weak divergences that lack multi-oscillator confirmation.
7. Signal Generation Logic
Signals are generated only at extreme oscillator levels with anti-overlap logic:
Bullish Signals:
Regular bullish divergence detected
Composite oscillator < -20 (oversold)
Confluence score >= minimum (default 2)
At least 20 bars since last bullish signal (anti-overlap)
Bearish Signals:
Regular bearish divergence detected
Composite oscillator > 20 (overbought)
Confluence score >= minimum (default 2)
At least 20 bars since last bearish signal (anti-overlap)
Extreme Signals:
Confluence score = 4/4 (all oscillators confirm)
Composite at extreme levels (< -30 or > 30)
Displayed as diamond shapes for emphasis
8. Visual Divergence Lines
Divergence lines are drawn connecting pivot points:
Regular Divergences: Solid lines (green = bullish, red = bearish)
Hidden Divergences: Dashed lines (cyan = bullish, orange = bearish)
Oscillator Pane: Lines drawn on composite oscillator
Chart Projection: Lines also drawn on main price chart (optional)
Lines provide visual confirmation of the divergence pattern and help identify the exact pivot points involved.
Visual Elements
Four Oscillator Lines: Thick colored lines showing RSI (cyan), MACD (magenta), TSI (yellow), and Stochastic (green)
Composite Line: White line showing unified oscillator
Zero Line: Gray horizontal line at zero
Overbought/Oversold Zones: Shaded areas at +30/-30 levels
Divergence Lines: Solid/dashed lines connecting pivot points
Signal Triangles: Small triangles at signal generation points
Extreme Diamonds: Larger diamonds for 4/4 confluence signals
Information Dashboard: Displays composite position, confluence score, RSI/MACD/TSI/Stochastic status, composite value, divergence types, signal strength, extreme events, and overall verdict
How to Use This Indicator
Step 1: Monitor Composite Position
Check if composite oscillator is at extreme levels (> 30 overbought, < -30 oversold). Divergences at extremes have highest probability.
Step 2: Check Confluence Score
Look for confluence scores of 3/4 or 4/4. Higher scores indicate stronger divergence confirmation across multiple oscillators.
Step 3: Identify Divergence Type
Regular divergences signal reversals, hidden divergences signal trend continuation. Trade accordingly.
Step 4: Wait for Signal Confirmation
Don't trade divergence lines alone. Wait for signal triangles that confirm divergence meets all criteria (extreme level, confluence, anti-overlap).
Step 5: Look for Extreme Events
Diamond shapes indicate 4/4 confluence at extreme levels - highest probability setups.
Step 6: Confirm with Price Action
Use divergence signals as alerts, then confirm with price action, support/resistance, or other indicators before entering.
Step 7: Check Individual Oscillators
Dashboard shows status of each oscillator. All four overbought/oversold provides additional confirmation.
Best Practices
Trade only divergences with confluence score >= 2 (default minimum)
Focus on regular divergences at extreme levels (< -30 or > 30) for reversals
Use hidden divergences to confirm trend continuation, not as standalone entries
Wait for signal triangles - don't front-run divergence lines
4/4 confluence signals (diamonds) offer highest probability setups
Combine with support/resistance levels for additional confirmation
Avoid divergences in middle range (-20 to +20) - wait for extremes
Use higher timeframe divergences for stronger significance
Input Parameters
Pivot Detection:
Pivot Left: Bars to left of pivot (default: 5)
Pivot Right: Bars to right of pivot (default: 5)
Max Lookback: Maximum bars to compare pivots (default: 60)
Min Lookback: Minimum bars to compare pivots (default: 5)
Oscillator Configuration:
RSI Length: Period for RSI (default: 14)
MACD Fast: Fast EMA period (default: 12)
MACD Slow: Slow EMA period (default: 26)
MACD Signal: Signal line period (default: 9)
TSI Long: Long smoothing period (default: 25)
TSI Short: Short smoothing period (default: 13)
Stochastic K: K period (default: 14)
Stochastic D: D smoothing (default: 3)
Divergence Rules:
Show Regular Divergence: Toggle regular divergence detection (default: enabled)
Show Hidden Divergence: Toggle hidden divergence detection (default: enabled)
Min Confluence Score: Minimum oscillators that must confirm (default: 2)
Project on Chart: Draw divergence lines on main chart (default: enabled)
Visual Configuration:
Bullish/Bearish Divergence Colors: Colors for regular divergences
Hidden Bullish/Bearish Colors: Colors for hidden divergences
Originality Statement
This indicator is original in its multi-oscillator confluence approach. While individual oscillators and divergence concepts are established, this indicator is justified because:
It combines four distinct oscillators into a unified composite system
The confluence scoring system measures divergence strength across multiple oscillators
Automatic detection of both regular and hidden divergences with pivot analysis
Signal generation includes extreme level filtering and anti-overlap logic
Chart projection allows divergence visualization on both oscillator and price chart
The comprehensive dashboard presents all oscillator states and divergence metrics simultaneously
Integration of multiple oscillator perspectives creates higher probability divergence signals
Disclaimer
This indicator is provided for educational and informational purposes only. It is not financial advice. Trading involves substantial risk of loss. Divergence analysis does not guarantee profitable trades or reversals. Past divergences do not guarantee future results. Always use proper risk management and never risk more than you can afford to lose.
-Made with passion by officialjackofalltrades Gösterge