Strateji

Gösterge

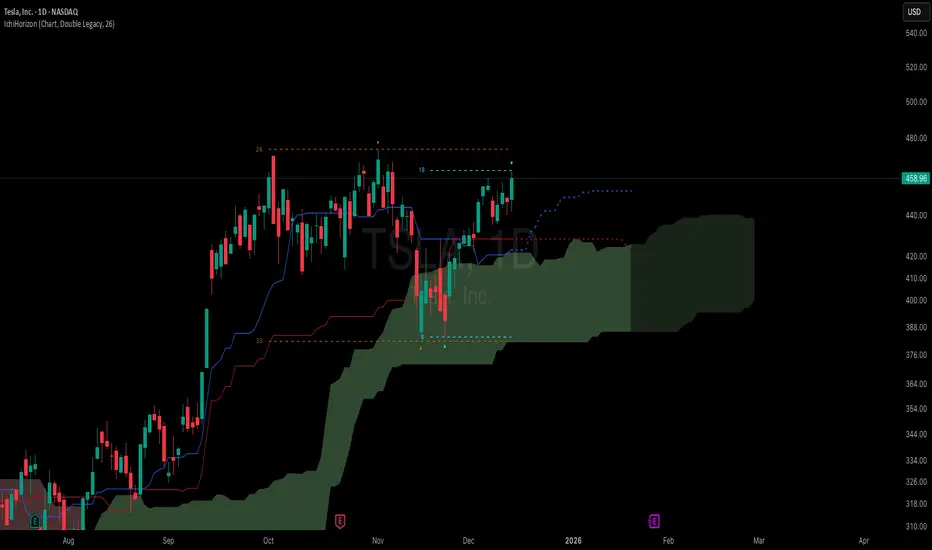
AG Pro Ichimoku Cloud Equilibrium Map [AGPro Series]AG Pro Ichimoku Cloud Equilibrium Map
Overview / What it does
AG Pro Ichimoku Cloud Equilibrium Map is an Ichimoku-based overlay designed to map balance, displacement, and return-to-balance behavior around a dynamic equilibrium core. Instead of using Ichimoku primarily as a traditional bullish/bearish checklist, this script reorganizes the framework around one structural question: where is price trading relative to its current equilibrium, and is that position balanced, expanding, overstretched, or reclaiming balance?
The script blends Kijun-Sen with the cloud midpoint to build an equilibrium core, then expands that core into an adaptive equilibrium band using ATR and cloud thickness. From there, it classifies how price is behaving around that band and displays the result through chart states, optional labels, and a compact information panel.
This script is intended as a chart analysis tool. It is built to help users read structure more efficiently, especially when standard Ichimoku layouts feel visually dense or interpretation-heavy.
Unique Edge
The main difference is that this script does not treat Ichimoku as a simple trend confirmation overlay. It converts the Ichimoku framework into an equilibrium map.
Rather than focusing only on whether price is above or below the cloud, this script asks:
- Is price still near structural balance?
- Is price moving away from equilibrium in a controlled way?
- Has the move become stretched?
- Is price returning back into equilibrium after displacement?
That makes it different from a standard Ichimoku presentation, where the raw components are visible but the user must do most of the structural interpretation manually.
It is also different from other AG Pro scripts built around breakout quality, oscillator pressure, compression behavior, or reversion frameworks. This tool is specifically centered on equilibrium, extension, and reclaim behavior using an Ichimoku-derived structure model.
Methodology
The script uses the following structure:
1. Kijun-Sen
Kijun-Sen is used as one of the main balance anchors.
2. Cloud midpoint
The midpoint between Span A and Span B is used as a second structural reference.
3. Equilibrium core
The script combines Kijun-Sen and the cloud midpoint into a dynamic equilibrium core.
4. Equilibrium band
An adaptive band is built around the equilibrium core using ATR and cloud thickness. This allows the model to respond differently in quieter and more volatile conditions.
5. Stretch zones
Beyond the equilibrium band, the script defines stretch areas that help distinguish normal directional expansion from more extended displacement.
6. Reclaim logic
When price moves back into the equilibrium region after being outside it, the script can classify that transition as a reclaim state.
This methodology is designed to make Ichimoku structure more explicit without removing the original context of the cloud framework.
States / Signals & Alerts
The script classifies chart behavior into the following states:
Balanced
Price is trading inside the equilibrium band.
Bullish Expansion
Price is trading above the equilibrium band with supportive directional structure.
Bearish Expansion
Price is trading below the equilibrium band with supportive directional structure.
Overstretched Bullish
Price is extended above the stretch threshold.
Overstretched Bearish
Price is extended below the stretch threshold.
Bullish Reclaim
Price has returned into the equilibrium region after trading below it.
Bearish Reclaim
Price has returned into the equilibrium region after trading above it.
Available alert conditions:
- Bullish Expansion
- Bearish Expansion
- Overstretched Bullish
- Overstretched Bearish
- Bullish Reclaim
- Bearish Reclaim
These states and alerts are descriptive tools for chart analysis. They are not a complete trade plan and should be interpreted in context.
Key Inputs
Ichimoku settings
Users can adjust Tenkan length, Kijun length, Senkou Span B length, and displacement.
Equilibrium engine settings
Users can control ATR length, equilibrium band sensitivity, cloud-thickness contribution, stretch sensitivity, and chop lookback.
Visual settings
Users can control cloud visibility, Kijun visibility, equilibrium band visibility, stretch zones, state labels, label density, and panel appearance.
These inputs allow the script to be tuned for different symbols, volatility conditions, and chart preferences.
Limitations & Transparency
This script is an indicator, not a strategy.
It does not place trades, manage positions, calculate performance, or guarantee outcomes.
The Equilibrium Score is an internal structure summary built from distance, alignment, cloud thickness, Tenkan/Kijun spread, reclaim contribution, and chop penalty. It is not a probability model, not a forecast, and not a standalone decision engine.
Overstretched conditions do not automatically imply reversal.
Reclaim conditions do not automatically imply continuation.
Expansion conditions do not automatically imply strength will persist.
As with any chart tool, interpretation depends on market regime, timeframe, volatility, and the user’s broader workflow. In noisy environments, state changes can occur more frequently. The script includes filters to reduce clutter, but no indicator removes uncertainty completely.
Risk Disclosure
This script is provided for research and chart analysis only.
It is not financial advice. Users should evaluate any signal, state change, or alert within their own process, risk framework, and market context before making decisions.
Gösterge

Trader in War(By Vahid.Jz)IR EnTrader in War (By Vahid.Jz) IR - Professional Trading Assistant
🎉 The first Persian indicator on TradingView, released for free to celebrate my daughter's (Atena / Avina) birthday. 🎉
First in corona, next in war...
Trading Assistant (by Vahid.Jz) is an all-in-one professional tool designed to simplify market analysis and improve trading accuracy. It serves as an intelligent trading companion.
Key Features:
Advanced Market Structure Analysis
Multi-Timeframe “Third Eye” Trend Overview
Professional Order Blocks (Supply & Demand) Detection
Fair Value Gaps (FVG) Identification
Powerful Divergence Detector
Neo Elliott Wave Labeling
Highly Customizable Alerts System
Sections & Inputs Guide:
1. Trading Assistant (Range / Consolidation Zones)
Main activation switch. When turned on, it enables all visual signals, labels, and alerts. Optimized especially for range-bound and consolidation markets.
2. Market Structure
Mid-term: Controls swing-level structure display (All, Shift, Sharp Shift, Momentum, None).
Short-term / Range Zones: Manages internal structure behavior.
Third Eye: Shows market structure trend direction (Bullish or Bearish) across 7 timeframes (5m to 1W).
3. Order Blocks (Supply / Demand)
Show Max Zones: Sets the maximum number of visible Order Blocks.
Show Strongest Zones Only: Displays only the highest volume percentage zones.
Timeframe: Selects the calculation timeframe for Order Blocks.
Text Size: Adjusts the size of volume text on the zones.
4. Unfilled Gaps (FVG)
Hidden Gaps: Enables display of hidden Fair Value Gaps.
Timeframe: Selects the timeframe used for FVG detection.
Max Gaps: Maximum number of gaps to keep on the chart.
Max Gap Range: Maximum bar distance for valid gaps.
5. Advanced Ichimoku
Activates the enhanced Ichimoku Cloud with multi-timeframe capability, including Tenkan-sen, Kijun-sen, Chikou Span, and Senkou Spans.
6. Neo Elliott Waves
Show Wave Labeling: Automatically detects and labels Elliott Wave patterns (a, b, c).
Show Invalid Waves: Option to display broken or invalidated wave structures.
7. Divergence Detector
Advanced divergence detection using multiple oscillators.
Includes several signal types: Custom Divergence, Volume Divergence, Hidden Gap Divergence, Divergence in Trend, and Inverse Trend Divergence.
8. Smart Signals
Section for enabling and filtering different signal combinations with confirmation options (Ichimoku Cloud or Tenkan/Kijun).
9. Alerts
Fully customizable alert system covering structure changes, Order Block touches, strongest zones, Fair Value Gaps, and Elliott Wave detections.
Developed with love by Vahid.Jz — Trader and Pine Script enthusiast with over 10 years of real-market experience.
“Trading is not a destination; it’s the journey — a path of learning, growth, and experience.”
Final Message:
If this indicator helps you trade better and protects you from losses, please share it with your friends and fellow traders.
The more people use professional tools, the fewer losses they will suffer in the market.
Your support and sharing motivate me to release more hidden and powerful versions in the future.
Thank you for being part of this journey. Gösterge

Ichimoku Signals TableIchimoku Signals Table
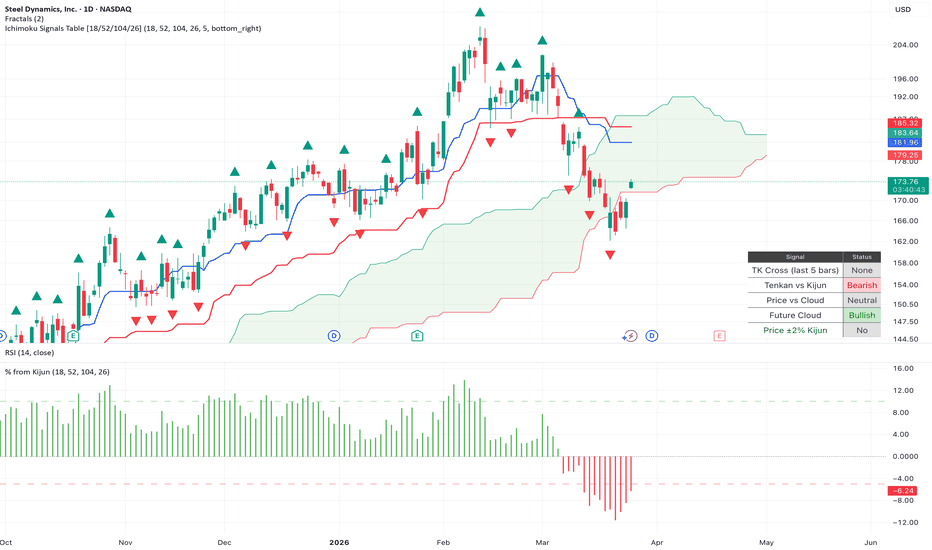
A clean, lightweight table indicator built specifically for traders who use the Ichimoku Cloud with custom periods: **Tenkan-sen (18), Kijun-sen (52), Senkou Span B (104), Displacement (26)**. Get a quick visual of the Ichimoku values
**What the table shows:**
- **TK Cross (last X bars)** – Detects recent Tenkan-Kijun crosses (lookback period is adjustable)
- **Tenkan vs Kijun** – Current relationship between the Conversion Line and Base Line
- **Price vs Cloud** – Bullish (price above cloud), Neutral (price inside cloud), Bearish (price below cloud)
- **Future Cloud** – Direction of the leading edge of the cloud (26 bars ahead)
- **Price ±2% Kijun** – Shows if price is trading within 2% of the Kijun-sen
**Key Features:**
- Uses your exact preferred 18/52/104/26 Ichimoku settings
- Table can be placed in any corner of the chart (top_right, top_left, bottom_right, bottom_left)
- Light theme optimized for white chart backgrounds
- "No" and Neutral states displayed in light grey for easy reading at a glance
- Fully adjustable TK Cross lookback period
**How to use:**
Add the indicator to your chart, adjust the "TK Cross Lookback Bars" if desired, and move the table to your preferred corner using the settings.
Perfect quick-reference dashboard for Ichimoku Cloud traders who want clear visual confirmation without cluttering the screen.
The price within 2% of the Kijun can be used to evaluate potential bounces off of this line Gösterge
Gösterge

Gösterge

Aura Mean Reversion Envelopes [Pineify]Aura Mean Reversion Envelopes
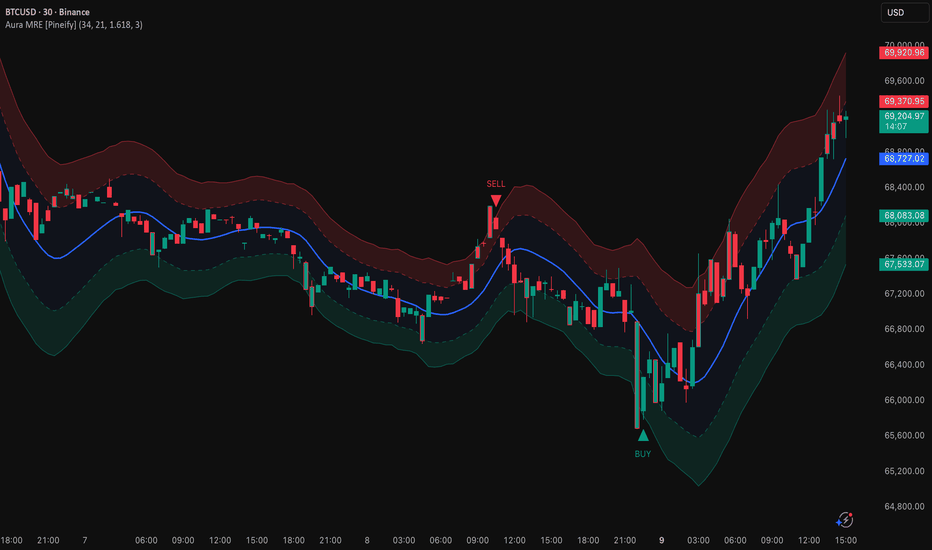
The Aura Mean Reversion Envelopes is a volatility-adaptive envelope indicator designed to identify high-probability mean reversion trade setups. It combines a Hull Moving Average (HMA) baseline with ATR-based dynamic envelopes to detect when price has reached statistically extreme levels and is likely to revert back toward its fair value. Unlike static channel indicators, this tool continuously adapts its bands to current market volatility, making it effective across different instruments and timeframes.
Key Features
Hull Moving Average (HMA) as the central mean — provides a smooth, low-lag baseline that closely tracks the "fair value" of price.
ATR-based dynamic envelopes — four bands (inner and outer, upper and lower) that automatically expand and contract with market volatility.
Wick rejection reversal signals — BUY and SELL markers triggered only when price pierces the exhaustion zone but closes back inside with a confirming candlestick pattern.
Visual cloud zones — color-filled regions between bands clearly delineate overbought, oversold, and neutral mean-reversion corridors.
Extreme candle coloring — optional bar coloring highlights candles closing beyond the inner bands for at-a-glance identification of stretched price action.
Built-in alert conditions — configurable alerts for both bullish and bearish reversal signals so you never miss a setup.
How It Works
The indicator is built on the principle of mean reversion — the statistical tendency for price to return to its average after moving to an extreme. The core calculation pipeline is:
A Hull Moving Average (HMA) of the closing price over a user-defined period (default: 34) is computed. HMA was chosen over SMA or EMA because it dramatically reduces lag while maintaining smoothness, giving a more accurate representation of the current mean.
Market volatility is measured using the Average True Range (ATR) over a separate lookback period (default: 21). ATR captures the true range of each bar — including gaps — providing a robust, adaptive volatility metric.
Four envelope bands are constructed symmetrically around the HMA baseline by adding and subtracting ATR multiplied by two configurable multipliers: an inner multiplier (default: 1.618, the golden ratio) and an outer multiplier (default: 3.0). The inner bands define the boundary of normal price oscillation, while the outer bands mark exhaustion zones where price has deviated significantly.
Reversal signals are generated using a wick rejection pattern: a bullish signal fires when the bar's low pierces below the lower outer band, but the candle closes bullishly (close > open) and above the outer band. This pattern indicates that sellers pushed price to an extreme but were overwhelmed by buyers. The bearish signal uses the mirror logic on the upper side.
Trading Ideas and Insights
Mean reversion strategies work best in ranging and oscillating markets. Here are some practical ways to use this indicator:
Fade the extremes: When a BUY or SELL signal appears at the outer exhaustion band, consider entering a position targeting the central HMA mean line as your take-profit level. The mean line acts as a natural magnet for price.
Use the inner bands as a filter: If price is between the inner bands and the mean, the market is in "normal" territory — avoid counter-trend entries. Wait for price to reach the outer bands before looking for reversal setups.
Combine with trend context: On higher timeframes, determine the dominant trend direction. Then on your trading timeframe, only take signals that align with the higher-timeframe trend (e.g., only BUY signals in an uptrend) for higher win rates.
Watch for candle coloring clusters: Multiple consecutive colored candles beyond the inner band suggest sustained momentum — a reversal signal after such a cluster can be particularly powerful.
How Multiple Indicators Work Together
This indicator integrates two distinct technical concepts into a unified framework:
Hull Moving Average (trend/mean tracking) — The HMA serves as the anchor point, representing the current equilibrium price. Its low-lag property ensures the mean line stays close to actual price action rather than trailing behind, which is critical for accurate envelope placement.
Average True Range (volatility measurement) — ATR dynamically sizes the envelope bands. During high-volatility periods, the bands widen to avoid false signals; during low-volatility periods, they tighten to capture smaller but still meaningful deviations.
The synergy between these two components is what makes the indicator adaptive: the HMA tracks where price should be, while the ATR determines how far is too far. Together, they create a self-adjusting framework that does not require manual recalibration across different market conditions.
The reversal signal logic adds a third layer — candlestick pattern confirmation — by requiring a wick rejection at the outer band. This prevents signals from firing during strong breakouts where price legitimately moves beyond the envelope.
Unique Aspects
HMA over EMA/SMA: Most envelope indicators use simple or exponential moving averages, which introduce significant lag. The Hull Moving Average virtually eliminates this lag, resulting in more accurately centered envelopes.
Dual-layer envelope design: The inner and outer band structure creates distinct zones (normal, extended, exhaustion) rather than a single binary overbought/oversold threshold, giving traders more nuanced context.
Golden ratio default: The inner band multiplier defaults to 1.618 (the Fibonacci golden ratio), a mathematically significant threshold that aligns with natural price clustering behavior observed across many markets.
Wick rejection confirmation: Signals require both a pierce beyond the outer band AND a confirming close back inside with a bullish/bearish candle body, filtering out many false signals that plague simpler band-touch systems.
How to Use
Apply the indicator to your chart. It overlays directly on the price chart with the HMA mean line, four envelope bands, and color-filled zones.
Watch for BUY triangles below bars at the lower outer band and SELL triangles above bars at the upper outer band. These are the primary reversal signals.
Use the colored candles as an early warning — when candles start coloring, price is in the extended zone and approaching potential reversal territory.
Set alerts via the built-in alert conditions ("Bullish Mean Reversion" and "Bearish Mean Reversion") to receive notifications when signals fire.
Target the central HMA mean line for take-profit on reversal trades, or use the inner band on the opposite side for more aggressive targets.
Customization
Mean Tracking Period (default: 34): Controls the HMA lookback. Lower values make the mean more responsive to recent price; higher values produce a smoother, slower-moving baseline. Adjust based on your trading timeframe.
Volatility (ATR) Period (default: 21): Controls the ATR lookback for band sizing. Shorter periods make bands more reactive to recent volatility spikes; longer periods smooth out the band width.
Inner Band Multiplier (default: 1.618): Defines the boundary between normal and extended price zones. Increase for wider normal zones (fewer colored candles); decrease for tighter zones.
Outer Band Multiplier (default: 3.0): Defines the exhaustion zone threshold. Higher values produce fewer but more extreme signals; lower values generate more frequent signals.
Color Candles at Extremes: Toggle on/off the candle coloring feature for candles closing beyond the inner bands.
All colors (bullish, bearish, mean line) are fully customizable via the Aesthetics & Colors settings group.
Conclusion
The Aura Mean Reversion Envelopes combines the precision of the Hull Moving Average with ATR-adaptive volatility bands and candlestick-confirmed reversal signals to create a comprehensive mean reversion trading tool. Its dual-layer envelope design provides clear visual zones for identifying when price is normal, extended, or at exhaustion — helping traders time entries at statistically favorable levels where price is most likely to revert toward its mean. Whether you trade forex, crypto, stocks, or futures, this indicator adapts to your market's volatility and provides actionable signals with built-in confirmation logic. Gösterge
Gösterge

Ichimoku Equilibrium Distance (Kijun/Tenkan)Ichimoku Equilibrium Distance (Kijun/Tenkan)
Ichimoku Equilibrium Distance (Kijun/Tenkan) is a conservative Ichimoku-internal context indicator that visualizes how far price is extended away from the core equilibrium lines:
Kijun-Price Distance (Close − Kijun)
Tenkan-Price Distance (Close − Tenkan)
Tenkan-Kijun Distance (Tenkan − Kijun)
The focus is on equilibrium, extension, and context — not on “magic signals”.
All calculations are derived from Ichimoku components only (no RSI/ATR filters).
Concept
In Ichimoku, Kijun-sen and Tenkan-sen are often treated as dynamic equilibrium references .
When price is close to them, the market is often in a more balanced state.
When price is far away, the market is extended — which can matter for:
avoiding “chasing” in trends
spotting stretched conditions before pullbacks / mean reversion
gauging trend pressure and acceleration phases
This script makes the “distance to equilibrium” visible in a clean oscillator-style panel.
Core Features
1) Distance Lines (Ichimoku-internal)
Optional plotting of:
Price − Kijun distance
Price − Tenkan distance
Tenkan − Kijun distance
2) Conservative Normalization Modes
Distances can be displayed as:
Raw (price units)
% of Price (cross-market comparable)
% of Ichimoku Range (Highest−Lowest of the Ichimoku window; no ATR)
3) Background Context (Current or Higher TF)
Optional background shading for quick bias reading:
Current timeframe background
Next higher timeframe background (mapped conservatively)
4) Confluence Background (Optional)
A single background layer with dynamic opacity:
Stronger opacity = stronger agreement between selected Ichimoku distance sources
You can choose which sources contribute to confluence (independent from line plots)
5) Alerts & Markers (Optional)
Classic Ichimoku relationships as selectable signals:
Price crosses Kijun
Price crosses Tenkan
Tenkan crosses Kijun (TK/KJ cross)
These are explicit Ichimoku meanings (not re-branded “new” signals).
6) MTF Histogram (Current Close vs HTF Kijun)
Optional histogram “tags” showing:
Close − 4H Kijun
Close − D Kijun
Close − W Kijun
Close − M Kijun
Useful to see extension relative to higher timeframe equilibrium.
How To Use (Ambitious Beginners)
A) Learn equilibrium behavior
Start with one line:
Enable Kijun-Price Distance
Watch how often price re-centers toward Kijun after large extensions
Goal: understand equilibrium pull, not force reversal trades.
B) Avoid chasing
In trends, entries often fail because traders buy/sell while price is already stretched.
Use distance as a simple checklist:
Distance small/medium -> easier to justify continuation entries
Distance large -> consider waiting for pullback or consolidation
C) Use Tenkan vs Kijun as “pressure” context
Enable Tenkan-Kijun Distance :
Positive TK−KJ often aligns with bullish pressure
Negative TK−KJ often aligns with bearish pressure
Combine with price action (structure, breaks, retests).
D) Keep it simple
Recommended learning workflow:
Use % of Price mode for easier comparison
Enable only one or two distance lines
Turn on background only after you understand the lines
How To Use (Advanced Traders)
1) Extension mapping across timeframes
Combine:
Current TF distance lines
Higher TF background
MTF histogram (4H/D/W/M)
Goal: detect when the current move is extended relative to higher timeframe equilibrium .
2) Trend continuation vs pullback risk
Observe “distance regime” instead of single-point signals:
Steady trend: distance oscillates but holds directional bias
Acceleration: distance expands rapidly (risk of late entry increases)
Transition: TK−KJ compresses / flips while price distance decays
3) Confluence as a bias overlay (minimal, conservative)
Use Confluence Background to quickly see agreement:
Kijun distance + TK−KJ alignment -> stronger directional context
Mixed readings -> reduce aggressiveness / wait for clarity
4) Alert workflow (discretionary, not automated)
Example approach:
Enable alert for “Price crosses Kijun”
Use it as a context prompt to check structure and risk
Do not treat the alert as an entry by itself
Notes
This is a context and equilibrium tool , not an automated trading system.
Large distance does not guarantee reversal — strong trends can remain extended.
Ichimoku components are derived values; interpret together with structure, volatility behavior, and risk management.
If you trade different markets, prefer normalized modes for comparability.
Best Suited For
Ichimoku traders who prefer conservative, method-aligned tools
Ambitious beginners learning equilibrium and extension behavior
Discretionary intraday and swing traders
Users who want clean charts with optional higher timeframe context
Gösterge

Gösterge

Gösterge

Strateji
Gösterge

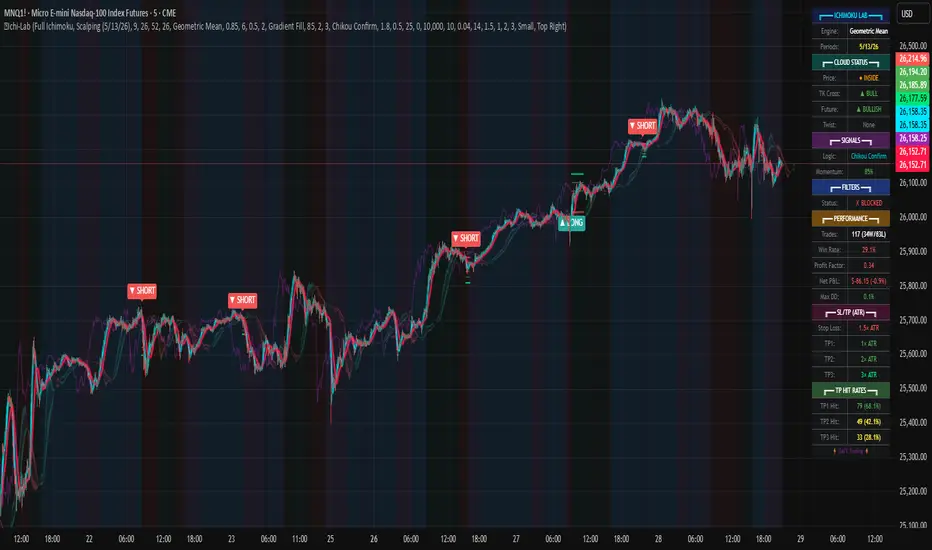
Ichimoku Cloud Laboratory [DAFE]Ichimoku Cloud Laboratory : The Ultimate All-In-One Trend & Equilibrium Engine
50+ Cloud Engines. Multi-Cloud Architecture. Advanced Signal Filtering. This is Not Just Ichimoku. This is the Evolution of Market Equilibrium.
█ PHILOSOPHY: BEYOND THE CLOUD, INTO THE LABORATORY
The Ichimoku Kinko Hyo is more than an indicator; it is a complete trading philosophy, a masterpiece of market analysis that provides an "at-a-glance" view of trend, momentum, and equilibrium. However, its core calculation—the simple midpoint of the high and low—was conceived in a pre-computer era. While brilliant, it is blind to the modern market's most critical force: the nuanced character of volume, volatility, and microstructure.
The Ichimoku Cloud Laboratory was not created to be another Ichimoku clone. It was engineered to be the definitive evolution of Goichi Hosoda's original vision. This is not just an indicator; it is a powerful, interactive research environment. It is a laboratory where you, the trader, can move beyond the static "one-size-fits-all" approach and forge an Ichimoku system that is perfectly synchronized with the unique physics of your market, timeframe, and analytical style.
We have deconstructed the very DNA of the Cloud, replacing its rigid 1930s-era calculation with a library of over 50 distinct, mathematically diverse calculation engines . From classical moving averages and advanced DSP filters to proprietary DAFE quantum models, this suite provides an unparalleled arsenal for visualizing the true, underlying architecture of market equilibrium.
█ WHAT MAKES THIS A "LABORATORY"? THE CORE INNOVATIONS
This tool stands in a class of its own. It is a collection of what could be 50 separate indicators, all seamlessly integrated into one powerful, unified engine.
The 50+ Algorithm Engine: This is the heart of the Laboratory. You are no longer bound by the simple Donchian midpoint. You can now swap the core calculation engine of the Tenkan-sen, Kijun-sen, and Senkou Span B with any of over 50 algorithms. Want a zero-lag, Hull MA-based cloud? A volume-weighted cloud that gravitates towards liquidity? A cloud that adapts its speed based on market entropy? You now have the power to construct it.
Multi-Cloud Architecture: This revolutionary feature allows you to stack up to three layers of the Ichimoku cloud on your chart, each calculated with a progressively longer timeframe multiplier. This transforms the flat, two-dimensional cloud into a rich, three-dimensional "heatmap" of support and resistance. You can instantly see the alignment (or conflict) between the short-term, medium-term, and long-term trends.
Advanced Signal Logic & Filtering: Go beyond the simple TK Cross. The Laboratory includes eight distinct, built-in signal strategies, from the classic "Kumo Breakout" to the high-conviction "Perfect Order." Crucially, you can then fortify these signals with a professional-grade filter module, requiring confirmation from Volume, ATR (volatility), or ADX (trend strength) before a signal is even considered valid.
Proprietary DAFE Engines: The crown jewels of the Laboratory. These are custom-built, proprietary algorithms you will not find anywhere else, designed to infuse the cloud with modern quantitative analysis:
DAFE Flux Reactor: A cloud that breathes with volatility, automatically tightening in squeezes and expanding in trends.
DAFE Tensor Cloud: Uses a 4-dimensional average (OHLC) to create a cloud that tracks the "true" center of price action.
DAFE Quantum Step: A noise-canceling cloud that only moves when price exceeds a volatility-based threshold.
DAFE Gravity Well: A volume-weighted cloud that is magnetically pulled towards high-liquidity zones.
Integrated Performance Engine & Dashboard: How do you know which of the 50+ engines is best? You test it. The built-in Performance Dashboard tracks every trade generated by your chosen configuration, while the main dashboard provides a comprehensive, at-a-glance summary of the entire Ichimoku system's current state.
█ A GUIDED TOUR OF THE ALGORITHMIC CORE
This is your library of mathematical DNA. The 50+ engines are your tools to build the perfect cloud.
THE ENGINE FAMILIES
The Classics (Hull MA, ZLEMA, KAMA, VIDYA): Replace the choppy Donchian midpoint with smooth, low-lag, or adaptive moving averages to create a more responsive and readable cloud.
The DSP & Quantitative Masters (SuperSmoother, Kalman, Gaussian, Laguerre): Employ advanced digital signal processing and statistical filtering to construct a cloud that is surgically precise in its separation of trend "signal" from market "noise."
The Volume-Based (VWMA, VWAP, Money Flow Weighted): Build a cloud that is not just based on price, but is weighted by participation. This creates a cloud that automatically respects high-liquidity zones as stronger levels of support and resistance.
The Adaptive Geniuses (ATR-Scaled, Volatility-Modulated, Efficiency Ratio, Entropy): These are "smart" engines that analyze the market's character—its volatility, trendiness, or disorder—and adapt the cloud's calculation in real-time. The result is a cloud that is stable in chop and dynamic in trends.
The DAFE Proprietary Engines: The pinnacle of cloud engineering. These exclusive algorithms allow you to build clouds based on principles of physics, institutional analysis, and quantum mechanics, creating a truly next-generation analytical tool.
█ STRATEGIC APPLICATION: FROM SIGNALS TO STRUCTURE
The Laboratory transforms Ichimoku from a simple signal generator into a complete market structure framework.
The Signal Logic: You are not limited to one strategy.
TK Cross: For classic momentum signals.
Kumo Breakout: For pure price action breakout strategies.
Perfect Order: The ultimate filter. By requiring Price > Cloud > Tenkan > Kijun, you filter for only the strongest, most established trends, eliminating the majority of false signals.
Cloud Twist: A forward-looking, predictive signal. The twist of the future cloud often pinpoints the exact timing of a potential trend reversal.
The Multi-Cloud Strategy: This is the professional's view. By enabling 3 Cloud Layers, you can see the market's fractal nature.
Layer 1 (Standard): Your short-term operational trend.
Layer 2 (e.g., 2x Periods): Your medium-term structural trend.
Layer 3 (e.g., 3x Periods): Your long-term macro trend.
The Strategy: Wait for price to pull back into the space between the 2nd and 3rd cloud layers—the "macro support/resistance zone"—and then take a signal from the 1st layer in the direction of the overall trend. This is a high-probability institutional setup.
█ THE MASTER DASHBOARD: YOUR "AT-A-GLANCE" COMMAND CENTER
The dashboard provides a comprehensive, real-time summary of the entire Ichimoku system's state.
Engine & Periods: Instantly confirm which of the 50+ engines and period settings are active.
Status Readout: Get an immediate, color-coded verdict on the three core Ichimoku components: Price vs. Cloud, the TK Cross, and the Future Cloud bias.
Momentum & Strength Gauge: A proprietary score that quantifies the overall bullish or bearish momentum of the system, and a "Strength" bar that visualizes the conviction of the current alignment.
Performance Data: If enabled, the dashboard will display your strategy's key performance metrics, including Win Rate, Profit Factor, and Net P&L.
█ DEVELOPMENT PHILOSOPHY
The Ichimoku Cloud Laboratory was born from a deep respect for Goichi Hosoda's original work and a relentless desire to push it into the 21st century. We believe that in modern markets, static tools are obsolete. The future of trading lies in adaptation, customization, and multi-dimensional analysis. This tool is for the serious trader, the systems thinker, the architect—the individual who is not content with a black box, but who seeks to understand, test, and refine their edge with surgical precision.
The Ichimoku Laboratory is designed to be the ultimate tool for that reaction, providing a crystal-clear, multi-layered view of what the market is telling you—not just through price, but through the very fabric of its equilibrium.
█ DISCLAIMER AND BEST PRACTICES
THIS IS AN ADVANCED ANALYTICAL TOOL: This indicator provides a sophisticated market structure and signal framework. It must be integrated into a complete trading plan that includes your own analysis and risk management.
RISK MANAGEMENT IS PARAMOUNT: All trading involves substantial risk. Never risk more capital than you are prepared to lose.
START WITH A ROBUST BASE: Begin with the "Traditional" preset and the "Standard Donchian" engine to master the classic feel. Then, experiment with a low-lag engine like the "Hull Moving Average" to see the immediate benefit of a smoother, more responsive cloud.
USE CONFLUENCE: The highest probability signals come from confluence. A "TK Cross" buy signal that occurs above a bullish "Multi-Cloud" structure, confirmed by a "Perfect Order" and high volume, is an A++ setup.
"The essence of success in the market is not forecasting, but reacting to what the market is telling you right now."
— J. Welles Wilder Jr.
Taking you to school. - Dskyz, Trade with Anticipation. Trade with Strength. Trade with RSI: Evolved Gösterge

NeuraCloud - Ichimoku (Purple Kumo) + Alerts (Minimal)NeuraCloud is a clean, modern interpretation of the Ichimoku Cloud, designed to identify trend direction, market structure, and key support/resistance zones at a glance.
The purple cloud (Kumo) acts as a dynamic trend filter:
• Price above the cloud indicates bullish conditions
• Price below the cloud indicates bearish conditions
• Price inside the cloud signals consolidation or uncertainty
NeuraCloud combines the cloud with Tenkan-sen and Kijun-sen to highlight momentum shifts, pullbacks, and trend continuation opportunities. Built-in alerts notify you of price/cloud breaks, momentum crosses, and cloud flips, helping you stay aligned with high-probability market structure.
Ideal for trend traders, swing traders, and multi-timeframe analysis, NeuraCloud keeps charts clean while delivering clear market context.
Gösterge

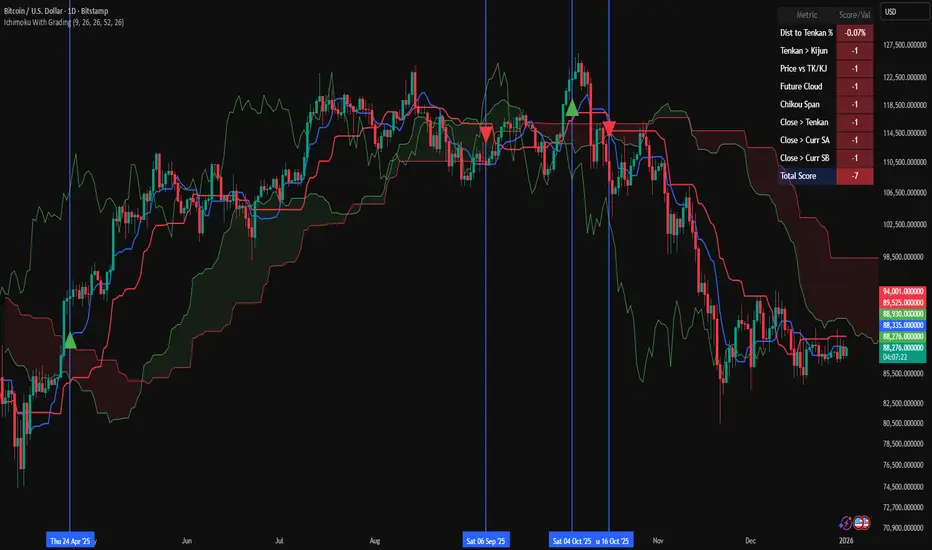
Ichimoku With GradingDescription:
This indicator is an enhanced version of the classic Ichimoku Kinko Hyo, designed to provide traders with an objective, quantitative assessment of trend strength. By breaking down the complex Ichimoku system into specific conditions, this script calculates a "Total Score" to help visualize the confluence of bullish or bearish signals.
How It Works
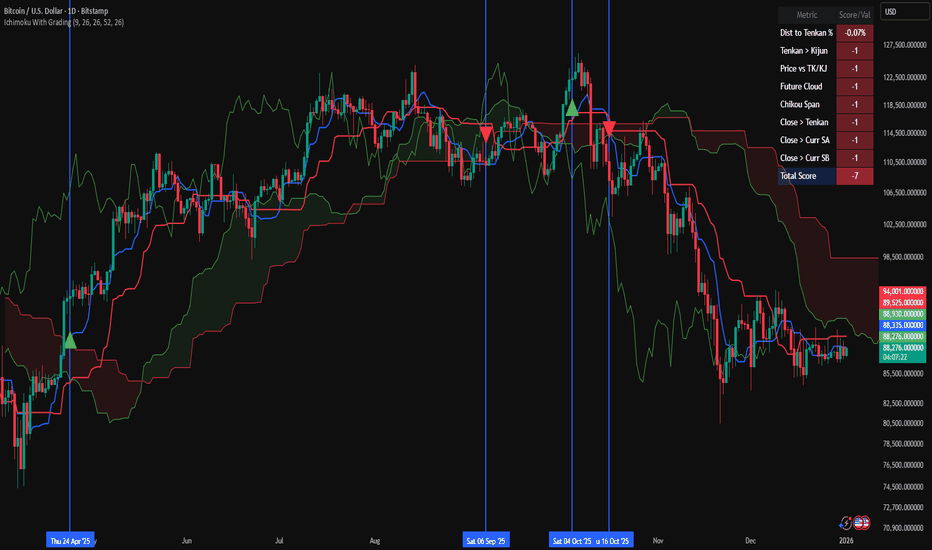
The core of this script is a 7-Point Grading System. Instead of relying on a single crossover, the script evaluates 7 distinct Ichimoku conditions simultaneously.
The Grading Criteria:
Tenkan > Kijun: Checks for the classic TK Cross (1 point if Bullish, -1 if Bearish).
Price vs TK/KJ: Checks if the Close is above both the Tenkan and Kijun (Bullish) or below both (Bearish).
Future Cloud: Analyzes the Kumo (Cloud) projected 26 bars ahead. If Senkou Span A > Senkou Span B, it is bullish.
Chikou Span: The Lagging Span validation. It compares the current Close to the Highs, Lows, and Cloud levels of 26 bars ago to ensure there are no obstacles.
Close > Tenkan: Checks immediate short-term momentum.
Close > Current Senkou Span A: Checks if price is above the current cloud's Span A.
Close > Current Senkou Span B: Checks if price is above the current cloud's Span B.
Total Score & Signals:
Maximum Score (+7): When all 7 conditions are met, a Green Triangle is plotted above the bar, indicating a strong trend confluence.
Minimum Score (-7): When all 7 conditions are negative, a Red Triangle is plotted below the bar.
Neutral/Mixed: Scores between -6 and +6 indicate a mixed trend or consolidation phase.
Dashboard Features
A table is displayed in the top-right corner to provide real-time data:
Score Breakdown: Shows the status of every individual metric (1 or -1).
Total Score: The sum of all metrics.
Distance to Tenkan %: This calculates the percentage distance between the Close and the Tenkan-sen.
Usage: Traders often use the Tenkan-sen as a trailing stop-loss level. This percentage helps gauge how extended the price is from the mean; a high percentage may indicate an overextended move, while a low percentage indicates a tight consolidation.
How to Use Ichimoku Lines
Beyond the grading system, this indicator plots the standard Ichimoku lines, which are powerful tools for price action analysis:
Support & Resistance: The Tenkan-sen (Conversion Line) and Kijun-sen (Base Line) act as dynamic support and resistance levels. In a strong trend, price will often respect the Tenkan-sen. In a moderate trend, it may pull back to the Kijun-sen before continuing.
The Kumo (Cloud): The edges of the current cloud (Senkou Span A and B) act as major support and resistance zones. A thick cloud represents strong S/R, while a thin cloud is easily broken.
Trend Identification: Generally, if the price is above the Cloud, the trend is bullish. If below, it is bearish. If the price is inside the Cloud, the market is considered to be in a noise/ranging zone.
Screenshots
1. Bitcoin Daily View:
Here you can see the dashboard in action. The grading system helps filter out noise by requiring all conditions to align before generating a signal.
2. Gold (XAUUSD) Example:
An example of a bearish confluence where the score hit -7, triggering a sell signal as the price broke through all Ichimoku support levels.
3. Euro (EURUSD) Mixed State:
This example shows a market in transition. While some metrics are positive (Green), others are negative (Red), resulting in a score of 4. This prevents premature entries during choppy market conditions.
Settings
Lengths: All Ichimoku periods (Tenkan, Kijun, Senkou B, Displacement) are fully customizable in the settings menu to fit your preferred timeframe or trading style (e.g., Doubled settings for crypto).
Disclaimer: This tool is for educational and informational purposes only. Past performance does not guarantee future results. Always manage your risk. Gösterge
Gösterge
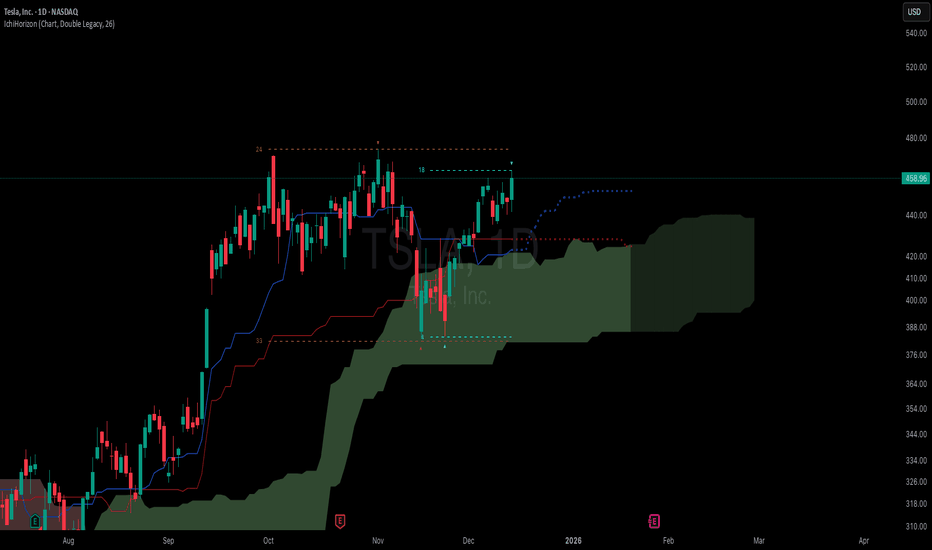
Ichimoku Trading Checklist - 5 Rules🧠 Description
This indicator implements a rule-based checklist built on Ichimoku Kinko Hyo, complemented with RSI and price structure, designed to help traders objectively evaluate whether a bullish setup is valid or not.
⚠️ This indicator does NOT generate buy or sell signals.
⚠️ It is NOT a trading system or financial advice.
The core philosophy is discipline and consistency:
If there is no setup, there is no trade.
________________________________________
✅ The 5 Rules Evaluated
1. Chikou Span above price (26 bars back)
Confirms that current price is above historical price, validating a bullish context.
2. Bullish TK Cross (Tenkan-sen > Kijun-sen)
Measures bullish momentum within the Ichimoku framework.
3. Bullish divergence or convergence between RSI and price
Evaluates relative strength using recent RSI pivots and price structure.
4. Kumo breakout followed by a valid pullback
Requires a bullish cloud breakout and a pullback that respects the structure.
5. Bullish Kumo (green cloud / twist)
Confirms that the Ichimoku cloud supports a bullish bias.
________________________________________
🚦 Decision Traffic Light (Final Row)
The last row of the table provides a traffic-light style summary:
• 🟢 5/5 rules met → Valid setup
• 🟡 1–4 rules met → Incomplete setup
• 🔴 0 rules met → No trade
Core message displayed: “No setup, No trade!” 🚫
________________________________________
🎨 Customization
Through the Inputs panel, users can customize:
• Header, body, and footer background colors
• Traffic-light colors and icons (🟢 🟡 🔴)
• Text alignment (left / center / right)
• Optional rule counter (x/5)
⚠️ Tables do not use TradingView’s Style tab; all customization is handled via Inputs.
________________________________________
⏱️ Timeframe
The indicator is timeframe-agnostic, but it was designed and tested primarily on the 1H timeframe, where Ichimoku and RSI structure tend to be more consistent.
________________________________________
⚠️ Disclaimer
This script is provided for educational and informational purposes only.
It does not constitute financial advice or a recommendation to buy or sell any asset.
Trading involves risk, and all decisions remain the sole responsibility of the user.
Remember that every strategy is based on probabilities and scenarios that you have already tested in hundreds of trades.
________________________________________
👤 Author
© Yesid Correa Cano
Pine Script v6
License: Mozilla Public License 2.0 (MPL-2.0) Gösterge

CloudScore by ExitAnt📘 CloudScore by ExitAnt
CloudScore by ExitAnt 는 일목균형표(Ichimoku Cloud)의 구름대 돌파 신호를 기반으로,
다양한 추세 보조지표를 결합하여 매수 추세 강도를 점수화(0~5점) 해주는 트렌드 분석 지표입니다.
기존 일목구름 단독 신호는 변동성이 크거나 신뢰도가 낮을 수 있기 때문에,
이 지표는 여러 기술적 요소를 종합적으로 평가하여
“지금이 얼마나 강력한 추세 전환 구간인가?” 를 직관적으로 보여줍니다.
🎯 지표 목적
일목균형표 구름 돌파의 신뢰도 강화
보조지표 신호를 자동으로 점수화하여 한눈에 판단 가능
캔들 위에 이모지를 배치해 시각적으로 즉시 해석 가능
초보자부터 숙련자까지 모두 활용 가능한 추세 진입 필터링 도구
🧠 점수 계산 방식 (0~5점)
구름 상향 돌파가 발생하면 아래 조건들을 체크하여 점수를 부여합니다.
▶ +1점 조건 항목
1. 골든 크로스 발생
* 최근 설정한 n봉 이내에서 Fast MA가 Slow MA를 상향 돌파한 경우
2. RSI 과매도 구간
* RSI가 설정 값 이하일 때 추세 전환 가능성이 증가
3. MACD 강세 전환
* MACD가 0 아래에 있으면서 시그널선 상향 돌파 발생
4. RSI 상승 다이버전스
* 가격은 낮아지지만 RSI는 상승 → 바닥 신호
5. 200MA 위에 위치
* 장기 추세와 일치하는 시점만 점수 강화
▶ 점수별 이모지
1점 🟡 : 약한 진입 신호
2점 🟢 : 관찰이 필요한 강화 신호
3점 📈 : 추세 전환 가능성 증가
4점 🚀 : 강한 추세 신호
5점 👑 : 매우 강력한 진입 시그널
🖥 차트 표시 요소
구름대(Span A / Span B)만 표시하여 더 깔끔한 시각화
이모지는 캔들 위에 자동 배치
필요 시 최근 n개의 캔들만 표시하도록 설정 가능
오른쪽 상단에 조건 요약 안내창 표시
🔧 사용자 설정
Tenkan / Kijun / SenkouB 기간 조정
MA, RSI, MACD, 다이버전스 사용 여부 선택
최근 몇 개의 캔들까지 점수를 표시할지 설정 가능
이모지는 사용자 취향에 따라 변경 가능
⚠️ 유의사항
본 지표는 **가격 움직임의 확률적 해석을 돕는 보조지표**이며, 단독으로 매수·매도 결정을 내려서는 안 됩니다.
시장 상황(변동성, 거래량, 프레임)에 따라 신호의 신뢰도는 달라질 수 있습니다.
실제 매매 전략에 적용하기 전 반드시 백테스트와 검증이 필요합니다.
# **📘 CloudScore by ExitAnt — English Description**
📘 CloudScore by ExitAnt
CloudScore by ExitAnt is a trend analysis indicator that evaluates bullish trend strength by scoring (0–5 points) signals based on Ichimoku Cloud breakouts combined with multiple momentum and trend indicators.
Since the default Ichimoku Cloud breakout alone can be unreliable or highly volatile, this indicator integrates several technical conditions to visually and intuitively show
“How strong is the current trend reversal opportunity?”
🎯 Purpose of the Indicator
Enhance the reliability of Ichimoku Cloud breakout signals
Automatically score multiple signals for quick visual judgment
Place emojis directly above candles for instant interpretation
Works for both beginners and experienced traders as a trend-entry filtering tool
🧠 Scoring Logic (0–5 points)
When a bullish breakout above the cloud occurs, the indicator checks the following conditions and assigns points.
▶ +1 Point Conditions
1. Golden Cross
* Fast MA crosses above Slow MA within the user-defined lookback window
2. RSI Oversold
* RSI below threshold increases the probability of trend reversal
3. MACD Bullish Shift
* MACD is below zero while crossing above the signal line
4. RSI Bullish Divergence
* Price makes a lower low while RSI makes a higher low → potential bottom signal
5. Above the 200MA
* Only scores when price aligns with long-term trend direction
▶ Emoji by Score
1 Point 🟡 : Weak early signal
2 Points 🟢 : Improved setup; watch closely
3 Points 📈 : Decent trend reversal possibility
4 Points 🚀 : Strong trend entry signal
5 Points 👑 : Very strong bullish signal
🖥 Chart Elements
Displays only Span A / Span B to keep the cloud visually clean
Emojis automatically appear above candles
Optionally limit the number of candles displaying signals
Summary box appears in the upper-right corner
🔧 User Settings
Adjustable Tenkan / Kijun / Senkou B periods
Enable/disable MA, RSI, MACD, divergence filters
Set how many recent candles should show the score
Emojis can be customized by the user
⚠️ Disclaimer
This is a technical assistant tool that helps interpret price movement probabilities; it should not be used as a standalone buy/sell signal.
Signal reliability may vary depending on volatility, volume, and timeframe.
Always conduct backtesting and validation before using it in real trading strategies.
Gösterge

Gösterge

Gösterge

Smart Cloud by Ilker (Custom Matriks)A Proprietary Hybrid Trend System for All Major Financial Assets
This indicator, originally developed for the Matriks platform, is a highly effective hybrid trend identification system designed for day-to-day analysis across all major asset classes, including Stocks, Forex, Indices, and Cryptocurrencies. It combines the forward-looking principle of the Ichimoku Kinko Hyo Cloud with heavily smoothed Moving Averages (MAs) to create a clear, visually guided trading signal. (Daily Timeframe recommended for optimal results).
📊 Algorithmic Structure and Parameters
The "Smart Cloud" utilizes six primary user-adjustable parameters that govern its sensitivity and shape, moving away from standard Ichimoku settings to provide a robust, customized trend view:
P1, P2, P3 (60, 56, 248): These long-term settings define the core structure and width of the cloud, acting as the primary dynamic support and resistance zone. The significantly longer P3 (Lagging Period) ensures the cloud reflects strong, deep market cycles.
P4 (Displacement 26): Maintains the traditional Ichimoku principle of projecting the cloud 26 periods forward to provide a predictive view of future trend support/resistance.
P5 (MA50 - Blue) & P6 (MA10 - Purple): These are the two primary Moving Averages plotted inside the cloud. They serve as fast-response momentum lines:
P5 (MA50): Represents the middle-term trend average.
P6 (MA10): Represents the short-term market momentum.
📈 Core Trend and Signal Interpretation
The indicator provides powerful trend identification based on three key components:
The Cloud (Kumo):
Green Cloud (Bullish): Indicates the dominant trend is up, suggesting dynamic support for price action.
Red Cloud (Bearish): Indicates the dominant trend is down, suggesting dynamic resistance.
The thickness and slope of the cloud are key indicators of trend strength.
MA Crossover Signal (Blue/Purple):
Buy Signal: When the faster Purple MA (P6=10) crosses above the slower Blue MA (P5=50).
Sell Signal: When the faster Purple MA (P6=10) crosses below the slower Blue MA (P5=50).
Price Action & Confirmation:
The most powerful signals occur when a MA Crossover is confirmed by price breaking out of the cloud in the same direction.
Price above the cloud and MA crossover to the upside suggests a strong buy entry.
Disclaimer: This tool is intended for analysis and decision-making support. It is not financial advice. Always use stop-loss orders and manage your risk accordingly. Gösterge