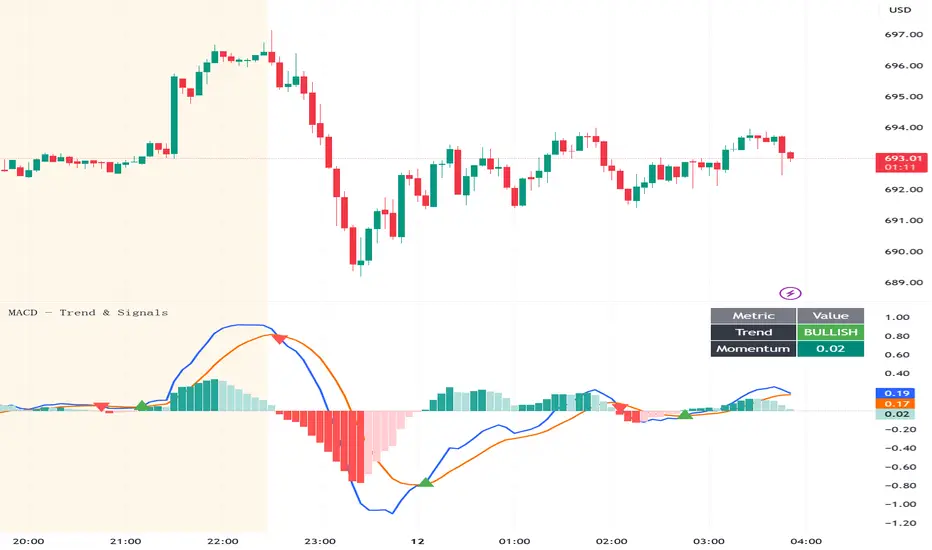
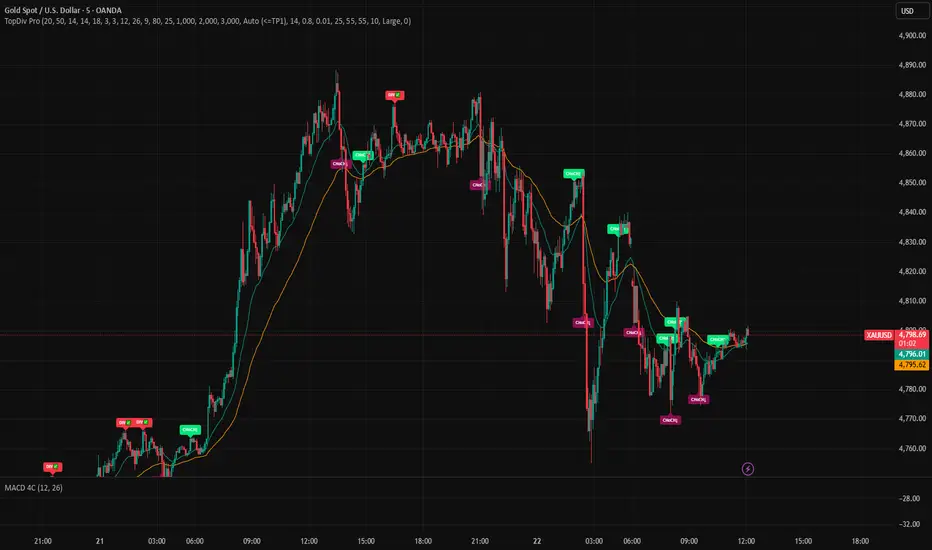
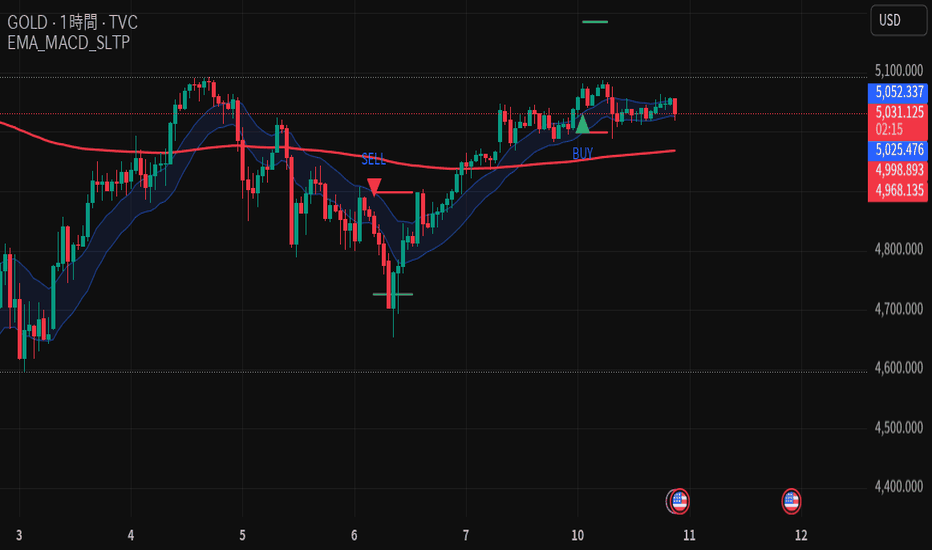
MACD - Trend & Signals with ArrowsThis isn't just another MACD to clutter your chart. I designed this Hybrid MACD Script specifically to solve the "indicator fatigue" that happens when trading multiple asset classes. Most MACD scripts require you to squint at the lines to see if a crossover actually happened; this script automates the detection and organizes the data into a clean, actionable HUD.
The Hybrid Edge: Why This Version?
Standard MACD indicators often fail in high-volatility environments (like Options or Forex) because the "cross" is hard to time visually. This program bridges that gap.
1. Key Logic & Signal Mechanics
The script uses a dual-signal confirmation system that is hard-coded into the visual output:
The Momentum HUD (Right) : Instead of calculating the trend slope in your head, the table uses a real-time logical check. If macdLine > 0, the trend is classified as BULLISH. This is critical for Stock and Fund traders who need to filter out "fake" bounces that occur below the zero line.
The Delta-Histogram : Unlike basic histograms, this one tracks velocity change.
Dark Green/Red: Momentum is accelerating.
Light Green/Red: Momentum is exhausting (The "Squeeze" phase).
Precision Entry Arrows : The plotshape function is tied to ta.crossover. These arrows only appear at the close of the candle, ensuring you don't jump into a trade on a "repainting" signal.
2. Strategic Application
For Options & Scalping
The Histogram Gradient is your exit signal. If you are long on a Call option and the histogram changes from Dark Green to Light Green, the program is telling you that the rate of change is slowing down. Even if price is still moving up, the Greeks (specifically Delta) will start working against you.
For Forex & Trend Following
Use the Zero-Line Filter.
High Probability: Only take Green Arrows if the MACD Line is already above 0.
Reversal Play: Look for Red Arrows when the MACD Line is significantly extended from the 0 axis—the "Value Area."
3. How to Use This Script Effectively
Stop Loss Placement: When a Red Arrow appears, the recent swing high is your mathematical ceiling.
Divergence Detection: If price makes a higher high, but the Momentum Value in the Dashboard table is lower than the previous peak, you are looking at a classic bearish divergence.
Cross-Asset Optimization:
Stocks/Funds: Keep the default 12, 26, 9 settings.
Crypto/Options: Consider tightening to 10, 20, 7 for faster reaction to "flash" moves.
Gösterge

Strateji

Gösterge
Gösterge

Gösterge
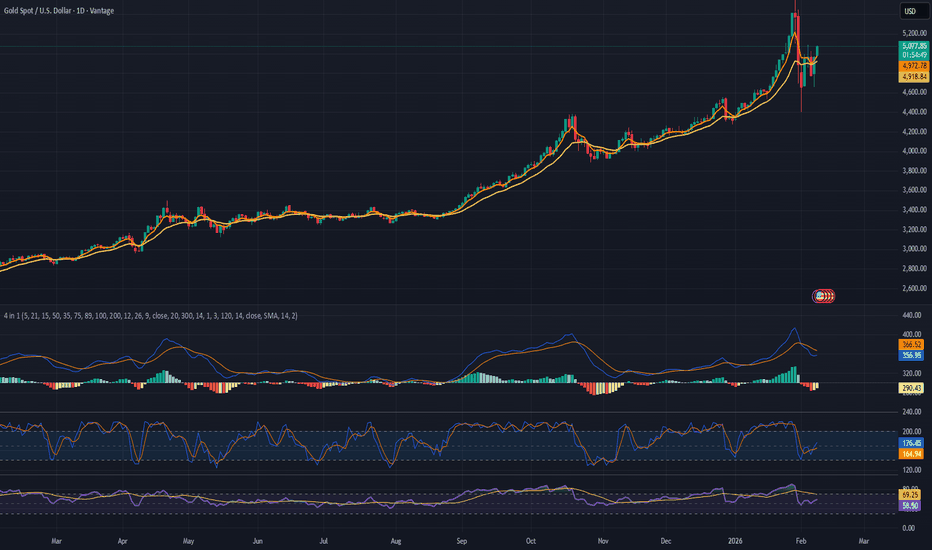
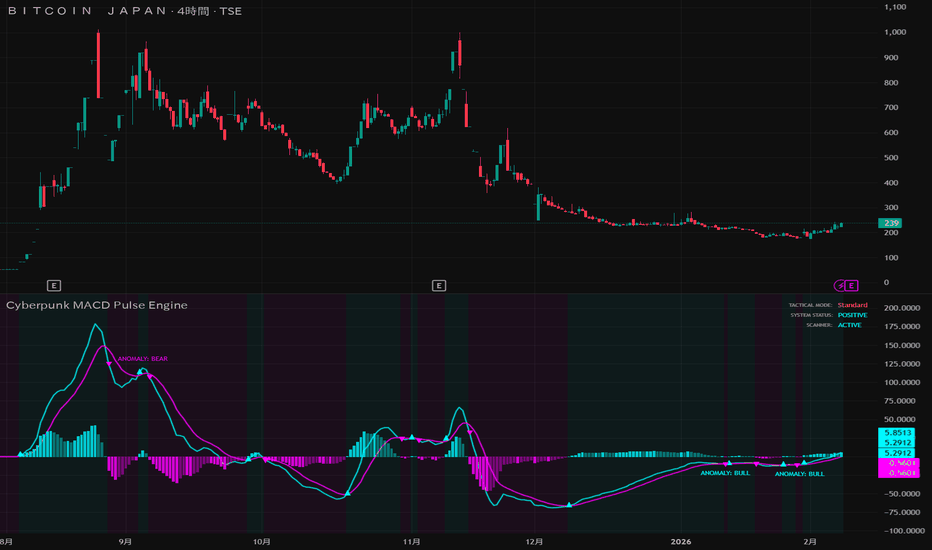
Auto-Lensed MACD + Z-Score v8.2The AL-MACD represents a departure from static technical analysis. While traditional oscillators use fixed mathematical constants, this indicator treats the market as a living, breathing cycle that requires a dynamic "Lens" to view clearly.
1. The Core Innovation: The Adaptive Lens
Standard MACDs are often "too fast" in volatile markets (causing noise) or "too slow" in trending markets (causing lag).
How it works: The script constantly measures the distance between recent price pivots to determine the Market Tempo.
The Result: It automatically recalculates its own Fast, Slow, and Signal lengths. If the market cycle compresses, the MACD tightens to catch the move; if the cycle expands, the MACD smooths out to avoid fakeouts.
2. Statistical Extremity (Z-Score Integration)
We integrated a price-based Z-Score (Standard Deviation) logic to provide a "Mean Reversion" layer.
Normalization: The Z-Score is normalized to the MACD scale so that the threshold bands breathe with the momentum.
Exhaustion Coloring: The histogram turns Aqua or Magenta when the price is statistically overextended (sigma>2.0 SD). This tells you a move is "out of breath" even before a reversal begins.
3. Signal Intelligence & Noise Reduction
To solve the "dot cluster" problem common in divergence indicators, we implemented a Quiet Build architecture:
ATR Magnitude Filter: Divergences are ignored if the price move between pivots is too small to be significant.
Signal Cooldown: A mandatory "rest period" (default 15 bars) prevents the script from firing repeated signals during a slow grind.
Slope Filter: Ignores signals if the MACD momentum is essentially flat.
4. Visual Interface & Dashboard
The Dashboard: Provides a real-time "Flight Deck" including Lens Speed, Price Z-Score, and current Adaptive Lengths.
Timeframe Recommendations: A dynamic "Rec Pivot" feature that tells the user exactly which structural settings to use based on the current chart interval (15s vs. Daily).
Sniper Alerts: A confluence-based alert system that only triggers when a Divergence meets a Z-Score extremity—the "A+ Setup."
5. Strategy Cheat Sheet
Signal
Market Context
Action
Histogram Color Shift
Z-Score sigma> 2.0
Alert: Market is overextended.
"R" Triangle + Magenta/Aqua
Divergence at Extremity
Entry: High-conviction mean reversion (The Sniper).
Rising Lens Speed
Cycle lengths are increasing
Wait: Market is entering a slow, trending grind.
Falling Lens Speed
Cycle lengths are decreasing
Prep: Volatility is coiling; expect a fast move. Gösterge

Gösterge

Strateji

Gösterge

Gösterge
Gösterge

Gösterge

Gösterge
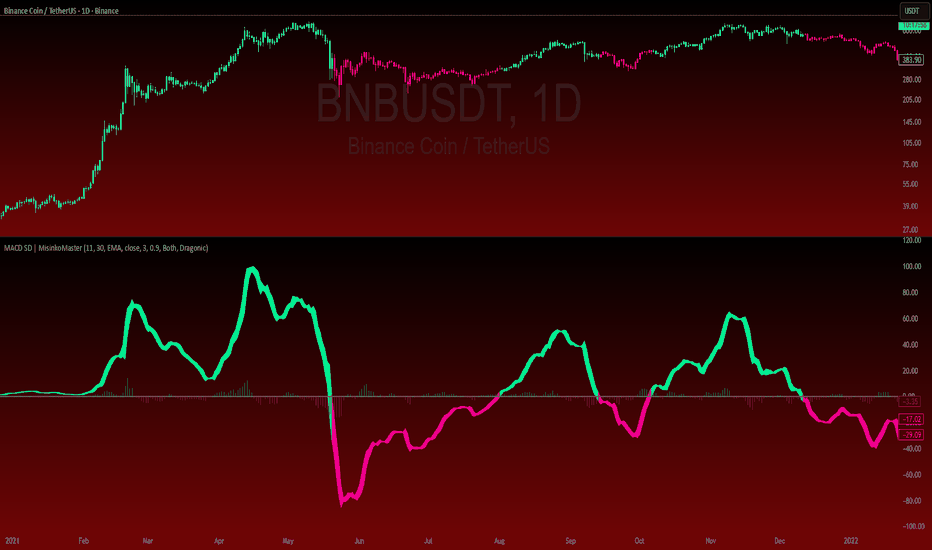
Gösterge

Gösterge

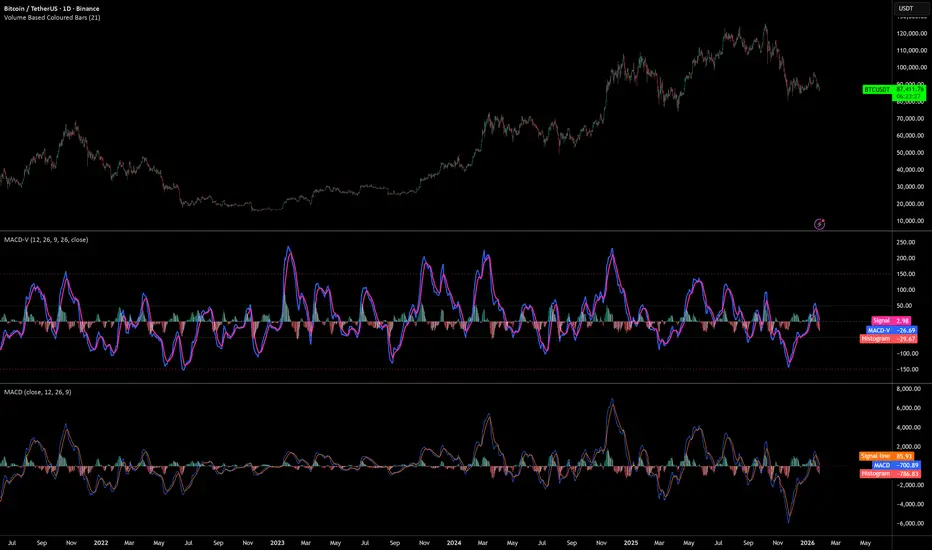
MACD-V (Volatility Normalized MACD)Award-Winning Momentum Indicator by Alex Spiroglou (CMT Charles Dao Award & NAAIM Founders Award, 2022)
The classic MACD has powered trading decisions for decades, but it suffers from five major limitations that undermine consistency:
1- Readings are not comparable over time (absolute price dependency causes massive scale differences across decades)
2- Not comparable across markets or assets (e.g., stocks vs. forex vs. crypto)
3- No universal overbought/oversold levels
4- Excessive whipsaws in low-momentum/range-bound conditions
5- Lagging signals in high-momentum reversals (e.g., missing big chunks of V-shaped recoveries)
MACD-V solves all five issues by normalizing momentum against volatility instead of price.
Core Formula
MACD-V = (EMA(12) - EMA(26)) / ATR(26) × 100
This expresses momentum in units of Average True Range (ATR), creating a volatility-adjusted oscillator that remains mathematically meaningful and comparable:
-Analysts can use MACD-V across any timeframe:
-Across any asset class (stocks, forex, commodities, bonds, crypto)
-Over decades of history
Key Features & Benefits
Time-stable & cross-market comparable: A +100 reading today has the same meaning as +100 in the past years, regardless of asset or price level.
Universal extremes: ±150 captures ~95% of all readings across markets → extreme/stretched momentum.
Momentum Lifecycle Roadmap (objective framework):
+150 or < -150: Extreme / overstretched (high reversal risk)
+50 to +150 or -50 to -150: Strong directional momentum (rallying, retracing, rebounding, reversing)
-50 to +50: Neutral / low momentum / ranging (avoid most signals — high whipsaw zone)
Range Rules for regime context: In bullish regimes (price > 200 EMA), -50 to -150 becomes the practical oversold zone; readings below -100 are rare and often powerful buy setups. Opposite in bearish regimes.
Improved signal quality: Filter whipsaws in neutral zone, anticipate lag in extremes, prioritize high-probability crosses in strong-momentum bands.
MACD-V Histogram (MACD-VH): Normalized short-term momentum with extremes at ±40 for fast reversal detection.
Backtesting & strategy-friendly: Enables reliable historical analysis, cross-asset relative strength, and systematic rules
MACD-V transforms momentum from subjective art into objective, repeatable science — giving you consistent, actionable insights no matter what you're trading.
Use it standalone or layer with trend filters (e.g., 200 EMA), volume, or price action for even stronger edges.
Developer: Alex Spiroglou
Open-source versions inspired by his work — feel free to fork and improve!
Happy trading! 🚀 Gösterge

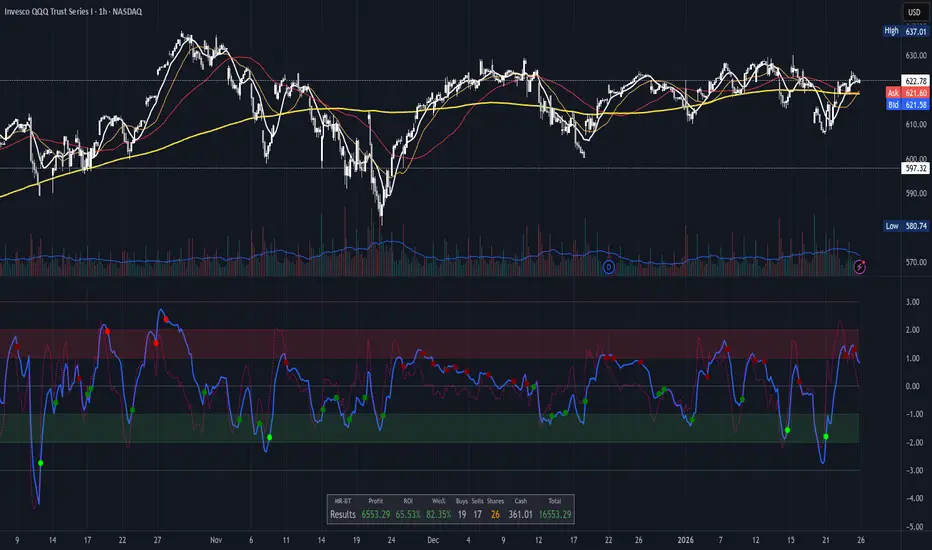
Mean Reversion [SIMI]This mean reversion indicator identifies extreme price deviations from the mean, providing high-probability reversal signals. Designed for confluence-based trading, it works best when combined with complementary indicators such as VWAP, price action, and volume analysis.
📊 Core Features
Signal Types
Prime Signals (Bright Green/Red Dots): Extreme reversions usually beyond ±1.5 SD - highest probability setups (you can customise this zone!)
Regular Signals (Dark Green/Red Dots): Standard reversions - moderate probability
Leader Line (Pink Dotted): Early warning indicator for potential reversals
Histogram Weakness: Momentum divergence signals
Normalisation Methods:
Institutional Hybrid (Z-ATR) (Recommended): Volatility-adjusted Z-score - adapts to changing market conditions
Percentile Ranking: Statistical ranking - excellent for ranging markets
PPO + ATR Hybrid: Percentage-based with volatility adjustment
Efficiency Ratio: Trend-strength weighted
ATR: Pure volatility-based
None: Raw Z-score
⚙️ Quick Setup Guide
1. Institutional Presets
Pre-configured parameter sets optimised for different timeframes:
5M Day Trading (5/21/5): Intraday scalping
1H Options Trading (6/24/5): Options-focused setups
1D Monthly Cycle (5/20/5): Swing trading
2. Signal Filtering
Prime Thresholds: Adjust ±1.5 SD to control signal quality (tighter = fewer, higher quality, adjust this zone per asset traded)
Dot Filters: Fine-tune entry zones (-0.03/+0.03 default - this ignores noisy signals near Zero line)
Volume Filter: Enable to require volume confirmation (1.4x average recommended, but fine tune yourself)
3. Advanced Filters
Dynamic SD Thresholds: Auto-adjusts for volatility regimes (tighter in low vol, wider in high vol)
Time of Day Filter: Avoids first 30 minutes, last 15 minutes, and lunch hour (11:30-13:00 EST)
💡 Trading Strategy Recommendations
Optimal Usage
This indicator is not intended as a standalone system. Use it for confluence alongside:
VWAP (institutional positioning)
Price action (support/resistance)
Options flow (institutional direction)
Volume analysis (conviction confirmation)
Signal Interpretation
Prime Signals: Wait for these for highest-probability entries - mean reversion may take hours to days
Manual Entries: Don't wait for dots - trade the ±2 SD zones directly using your own confirmation
Options Strategy: Prime sell signals at +2 SD make excellent short call setups; prime buy signals at -2 SD for long calls
Timeframe Guidance
Lower Timeframes (1M-5M): Higher noise - require additional confluence
Higher Timeframes (1H-1D): More reliable signals - suitable for options and swing trades
Best Results: Multi-timeframe analysis (check 1H and 4H alignment on 5M entries)
🔔 Alert System
Master Alert
Enable customisable alerts via the Master Alert System:
Toggle individual signal types (Prime Buy/Sell, SD Crosses, Leader, Histogram)
Receives bespoke messages with ticker, timeframe, and price
One alert condition handles all selected signals
Individual Alerts
Separate alert conditions available for Prime and Regular signals if preferred.
📈 Backtesting Notes
Important: Backtest results are date-sensitive and should not be the primary focus. Instead:
Dial in settings visually on your chosen asset
Aim for signals near actual tops and bottoms
Test different normalisation methods for your specific instrument
Optimise for signal quality, not backtest ROI
Asset Testing: Primarily developed using SPY, QQQ, and IWM as main assets to trade. Other instruments may require parameter adjustment - mess around!
Backtest Engine
Entry/Exit modes (All Signals, Prime Only, Early Signals)
Position sizing (percentage-based)
Slippage and fill method (candle close recommended)
Date range selection
⚠️ Best Practices
Always use confluence - never trade on MR signals alone
Start with Institutional Hybrid normalisation - most adaptive to market conditions
Focus on Prime signals for quality over quantity
Test on your specific asset - optimal settings vary by instrument
Longer timeframes = higher reliability - 1H+ for best results
Enable Time Filter on intraday charts to avoid volatile periods
Use Dynamic SD in highly volatile markets (earnings, FOMC, etc.)
🛠️ Troubleshooting
Too many signals: Increase Prime Thresholds or enable Volume Filter
Too few signals: Decrease Prime Thresholds or reduce Dot Filters
False signals: Enable Time of Day Filter and Dynamic SD
Signals don't align with tops/bottoms: Try different normalisation method
📝 Feedback & Development
Bug Reports: Please report any issues via TradingView comments or direct message.
Strategy Sharing: I'd love to hear how you're using this indicator and what strategies you've developed.
Open Source: Feel free to fork and modify this indicator. If you create an improved version, please share it with the community!
🙏 Acknowledgements
Developed through AI-assisted collaboration.
Special thanks to Lazy Bear for his open source MACD histogram (volume based).
Open source forever - use freely, modify, and share.
Happy Trading!
Remember: Past performance does not guarantee future results. Always manage risk appropriately.
Pandas rock \m/ Gösterge

Strateji

Strateji

Gösterge

RSI [Hash Capital Research]RSI is a visually enhanced momentum indicator built on the classic Relative Strength Index.
This version expands RSI into a more flexible analytical tool through smoothing options, adaptive zone-based coloring, optional signal line overlays, and divergence detection.
It is designed as a context-building indicator, not a standalone entry system.
What This Indicator Does
This script calculates a smoothed RSI using user-defined parameters and then provides multiple optional enhancements:
1. Adaptive RSI Visualization
The core RSI is plotted with:
Zone-based color changes (neutral, oversold, overbought)
Optional glow effects to emphasize extreme conditions
User-defined color intensity and midline visibility
The goal is to provide clearer visual segmentation of trend strength and momentum behavior.
2. Custom Smoothing & Signal Line Options
The indicator allows:
Multi-layer smoothing for RSI stability
An optional signal line using the trader’s preferred moving-average method (SMA, EMA, SMMA/RMA, WMA, VWMA)
This helps operators examine whether momentum is accelerating or stabilizing relative to its mean.
3. Overbought/Oversold Tools
User-defined thresholds determine:
Highlighted zones
Optional markers for extreme reversals (based on RSI + momentum + velocity criteria)
Midline (50) cross highlights for trend-bias transitions
These features help contextualize where the RSI sits relative to broader momentum regimes.
4. Divergence Detection (Optional)
When enabled, the script scans for regular bullish and bearish divergences using pivot-based structure.
It compares:
Price making lower lows vs RSI making higher lows (bullish)
Price making higher highs vs RSI making lower highs (bearish)
Detected divergences are plotted on the RSI panel with visual labels.
This detection uses pivot lookbacks and range limits defined by the user.
5. Alerts
The indicator provides optional alerts for:
Extreme reversals
Overbought/oversold momentum shifts
Midline (50) crossovers
Bullish / bearish divergences
Alerts are intended for monitoring, not for automated execution.
How to Use It
This RSI modification is intended to support broader analysis workflows, including:
Identifying regime shifts using midline crosses
Monitoring momentum structure across trend phases
Highlighting oversold or overbought clustering
Adding a visual signal line to interpret momentum smoothing
Spotting divergence between price and RSI
As with all indicators, this tool should be used as one component of a complete analysis framework.
What Makes This Version Distinct
This script maintains the core behavior of RSI but introduces:
A multi-layer smoothing system
Adaptive colors calibrated to oversold/neutral/overbought zones
Optional glow visualizations
A modular signal-line engine with multiple MA types
Configurable divergence detection with visual labels
Multiple marker placement modes for extreme conditions
These features expand RSI’s readability while keeping its underlying logic transparent and consistent with common operator workflows.
Important Notes
This is an indicator, not a strategy. It does not execute trades or calculate performance metrics.
The visual enhancements are designed to improve clarity, not to generate automated “buy” or “sell” systems.
Divergence detection is optional because divergence is inherently contextual and may not apply equally across all markets or timeframes.
Gösterge

Gösterge

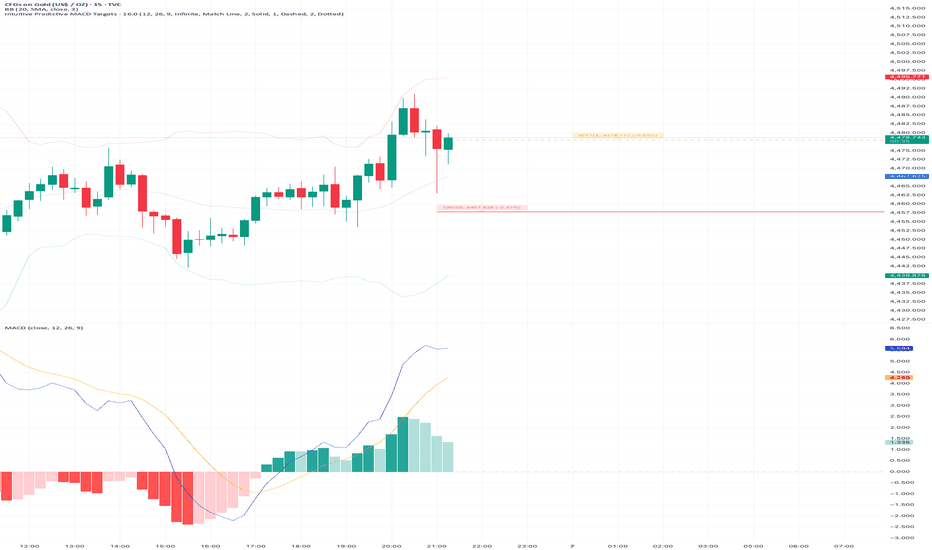
Intuitive Predictive MACD TargetsThis indicator uses Reverse Engineering math to calculate the exact price the market needs to reach for specific MACD events to happen on the current bar.
Standard MACD is a lagging indicator—you usually wait for the candle to close to confirm a signal. This script changes that by drawing "Finish Lines" on your chart, showing you exactly where price must go right now to trigger a Crossover or a Momentum Hook.
The "Reverse Engineering" Concept
Instead of calculating MACD from Price, we calculate the Required Price from the Target MACD.
Q: "At what price will the MACD line cross the Signal line?"
A: The script solves this and draws the Green/Red "Crossover" Line.
Key Features
1. Three Distinct Targets
Crossover Target (PCO/NCO): The exact price needed to trigger a Buy/Sell signal on the current candle.
Dynamic Coloring: Turns Green if price needs to go UP to cross, Red if price needs to go DOWN.
Settlement Target (The Hook): The exact price where the MACD momentum flattens out (Angle = 0). If price touches this Orange Dashed Line, the trend is likely pausing or preparing to reverse.
Zero Cross Target: The price needed for MACD to reclaim the Zero Line.
2. Smart "Staggered" Labels (No Overlap)
Unlike other scripts where text piles up and becomes unreadable, this indicator automatically spreads labels horizontally.
Crossover info stays near the price.
Settlement info is shifted to the right.
Zero info is shifted further right.
Result: You can read all three targets clearly, even if the prices are almost identical.
3. Full Customization
Line Length: Choose "Infinite" to see targets as Support/Resistance levels across the screen, or "Short" to keep your chart background clean.
Text Visibility: Option to force text to White or Black for high contrast on Dark/Light themes.
Styles: Fully adjustable colors, line widths, and styles (Solid, Dashed, Dotted) for each target type.
How to Use
The "Finish Line" Strategy: If you are Long, and the Red NCO Line appears just below the current price, be cautious. It means a very small drop will confirm a Bearish Cross.
Momentum Checks: Watch the Orange "Settlement" Line.
If price is moving away from the Orange line, the trend is accelerating (Safe to hold).
If price touches the Orange line, momentum has died (Consider taking profit).
Settings
Visual Settings: Change Line Length (Infinite/Short) and Text Color.
MACD Settings: Standard inputs (Default 12, 26, 9).
Toggles: Option to show/hide the Zero Line target. Gösterge