CL PMAPivot moving averages useing SMA's. This study is just a tweak from the study already done by @QUANTCT. I just cleaned it up and used SMAs instead of EMAs so he deserves most credit. GöstergeMreg36 tarafından10
TriexDev - SuperBuySellTrendMinimal but powerful. Have been using this for myself, so thought it would be nice to share publicly. Of course no script is correct 100% of the time, but this is one of if not the best in my basic tools. Two indicators will appear, the default ATR multipliers are already set for what I believe to be perfect for this particular (double indicator) strategy. If you want to break it yourself (I couldn't find anything that tested more accurately myself), you can do so in the settings. Basic rundGöstergeXeirt tarafındanGüncellendi 6 1.1 K
Price Pivots for NASDQ 100 StocksPrice Pivots for NASDQ 100 Stocks What is this Indicator? • This indicator calculates the price range a Stock can move in a Day. Advantages of this Indicator • This is a Leading indicator, not Dynamic or Repaint. • Helps to identify the tight range of price movement. • Can easily identify the Options strike price. • Develops a discipline in placing Targets. Disadvantages of this Indicator • The indicator is specifically made for NASDQ 100 stocks. The levels won't work for other stocks.GöstergeArun_K_Bhaskar tarafından4227
Average Daily Range (ADR) (Multi Timeframe, Multi Period)Average Daily Range (ADR) (Multi Timeframe, Multi Period, Extended Levels) Tips • Narrow Zones are an indication of breakouts. It can be a very tight range as well. • Wider Zones can be Sideways or Volatile. What is this Indicator? • This is Average Daily Range (ADR) Zones or Pivots. • This have Multi Timeframe, Multi Period (Up to 3 Levels) and Extended Target Levels. Advantages of this Indicator • This is a Leading indicator, not Dynamic or Repaint. • Helps to identify the reversalGöstergeArun_K_Bhaskar tarafındanGüncellendi 105 3 K
50% Strat RetracementThe purpose of this script is to show/alert you when there is a 50% Strat Reversal. It works very well to find possible 3 candles. The arrows, and line can be turned on and off. You can change the 50% to say 45% so that you will be alerted before it actually hits the 50% retracement. The script will only alert if the reversal is a 2up red candle, a 2up green candle which will hopefully turn into a 3 candle. GöstergeTraderCreatorPro tarafından1240
Auto Round levels by Script051This indicator is designed to show psychological levels/round levels. The difference between this version and the others is that : It will automatically show round levels for each symbol you select without having to enter "tick value" manually. Settings Gap : If the value is equal to zero, the round levels will be found automatically, but if you change the value, the gap between the lines will be adjusted based on the value you specified. X2 and /2 : doubles or halves the distance betGöstergescript051 tarafından303
Customizable Pivot Support/Resistance Zones [MyTradingCoder]This script uses the standard pivot-high/pivot-low built-in methods to identify pivot points on the chart as a base calculation for the zones. Rather than displaying basic lines, it displays a zone from the original pivot point to the closest part of the available body on the same candle. The script comes in handy by utilizing Pinescripts available input.source() function to allow for an external indicators output value to be used within the indicator. Make sure to read all of the TOOLTIPS in thGöstergeMaglebySystems tarafından19 2.5 K
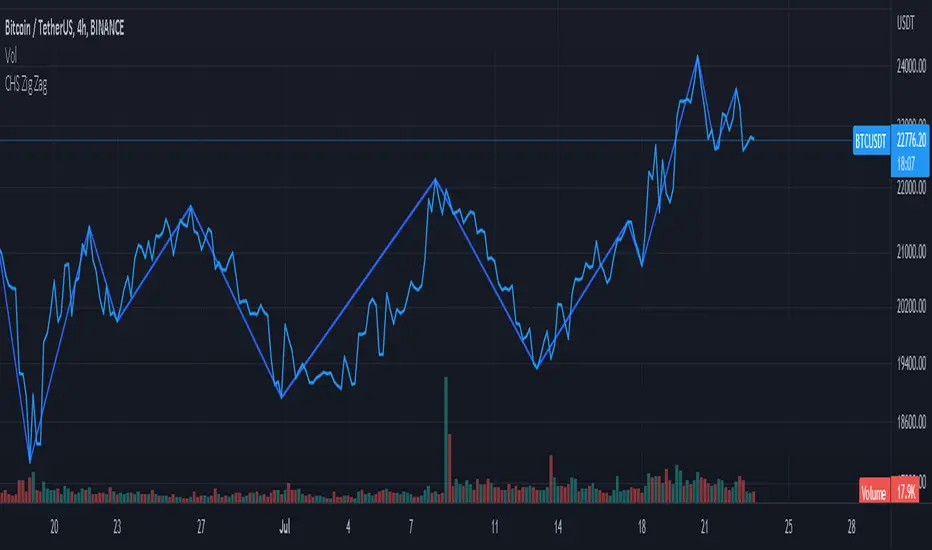
CHS Zig ZagCHS ZigZag stands for Changeable Source ZigZag The original ZigZag indicator offered by TradingView doesn't have the ability to measure the tips and troughs based on closing prices (line chart), however, this indicator is capable of receiving an input from user that determines the price source used for further calculations. The default inputs of the original ZigZag indicator have been also changed in order to make it adapt to pivots formed on line chart but users can change arbitrarily. GöstergeMahdi_Fatemi1998 tarafından39295
Swing Points & FVGClassic ITH/ITL Intermediate Term High - High that has short term high on either of it's side. Intermediate Term Low - Low that has short term low on either of it's side. FVG The indicator also marks Fair Value Gaps which is a very important concept in price action trading. FVGs are formed when there is ineffeciency,or imbalance, in the market. Rebalanced ITH/ITL Rebalanced ITH - A short term high that rebalanced the ineffeciency in price can be considered as an Intermediate Term HighGöstergeVulnerable_human_x tarafından15 1.3 K
Pre Market \ Opening Range High LowGreen vertical lines are showing pre market open and then the opening range as the first hour of market NYSE market open Pre market high and low are blue lines | intraday opening range high low are in white Trades are taken in the current direction above | below range breaks with the direction of price action using the moving averages Price breaking through moving averages and a range is the optimal trade to enter - exit at next range for target - stop loss below the lower | higher movingGöstergeLucrorStrategies tarafındanGüncellendi 6476
Price Pivots for NSE Index & F&O StocksPrice Pivots for NSE Index & F&O Stocks What is this Indicator? • This indicator calculates the price range a Stock or Index can move in a Day, Week or Month. Advantages of this Indicator • This is a Leading indicator, not Dynamic or Repaint. • Helps to identify the tight range of price movement. • Can easily identify the Options strike price. • The levels are more reliable and authentic than Gann Square of 9 Levels. • Develops a discipline in placing Targets. Disadvantages of this IndiGöstergeArun_K_Bhaskar tarafından21 1 K
Fibonacci Pivot Points UltimateA better version of the Fibonacci Pivot Points . I added 100, 138, 161 and 200 support/resistance pivots , lookback function and now you can use daily/weekly/monthly/yearly fibonacci pivot points .GöstergeIto_Process tarafından3466
Support and Resistance Multiperiod (Zig Zag Based)Support and Resistance Multiperiod (Zig Zag Based) What is the indicator? • The indicator is a multi period (up to 5 lengths) Support and Resistance indicator calculated based on Zig Zag. Who can use? Scalpers to Long term investors What timeframe to use? • Any timeframe What are the lines? • Green lines are Support levels. • Orange lines are Resistance levels. How to use? • Buy Low and Sell High. • Brighter zones means strong Support or Resistance. • Weaker zones appear lighter.GöstergeArun_K_Bhaskar tarafındanGüncellendi 29 2 K
Waddah Attar Weekly Camarilla Pivots [Loxx]Waddah Attar Weekly Camarilla Pivots is an indicator built by Ahmad Waddah Attar that draws weekly Camarilla over lower timeframes. What are Camarilla pivots? Camarilla Pivot Points is a math-based price action analysis tool that generates potential intraday support and resistance levels. Similar to classic pivot points, it uses the previous day's high price, low price, and closing price. Camarilla Pivot Points is a modified version of the classic Pivot Point. Camarilla Pivot Points wereGöstergeloxx tarafından4396
Pivot Points Standard Higher Timeframe█ OVERVIEW This indicator was intended as educational purpose only and alternative way to write pine script in version 5 for Pivot Points Standard. █ CREDITS Credits to TradingView for original built-in source code. █ FEATURES Display price or percentage. Change color for labels and lines. █ USAGE EXAMPLES GöstergeRozaniGhani-RG tarafından2422
Relative Strength Index - Divergences - LibertusHello all, To ease everyone's trading experience I made this script which colors RSI overbought and oversold conditions and as a bonus displays bullish or bearish divergences in last 50 candles (by default, you can change it). Script is open source, part of code is from Trading View examples. If you have suggestions or you already made some improvements, please report in comment. Happy trading and good luck!Göstergedragon92022 tarafından53
Camarilla PivotsA slimmed down/cleaner version of the "Pivot Points Standard" indicator. This is for Camarilla pivots only. The S and R pivots are renamed to L/H and the colors of pivot 1 and 2 are faded out by default since those pivots are less used in the Camarilla trading system. They can also be disabled of course.Göstergechipmonk tarafındanGüncellendi 51 1.9 K
Real IndicatorReal indicator is an indicator to convert ohlcv charts to one oscilator! there is an effective thing in all charts: "Volume", and I used this thing to mix it by price Buy: on crossing above to Bollinger-lower-band (on Up-trends) Sell: on crossing under Bollinger-upper-band (on Down-Trends) use an SMA-200 to determine trends ;)Göstergemablue tarafındanGüncellendi 4374
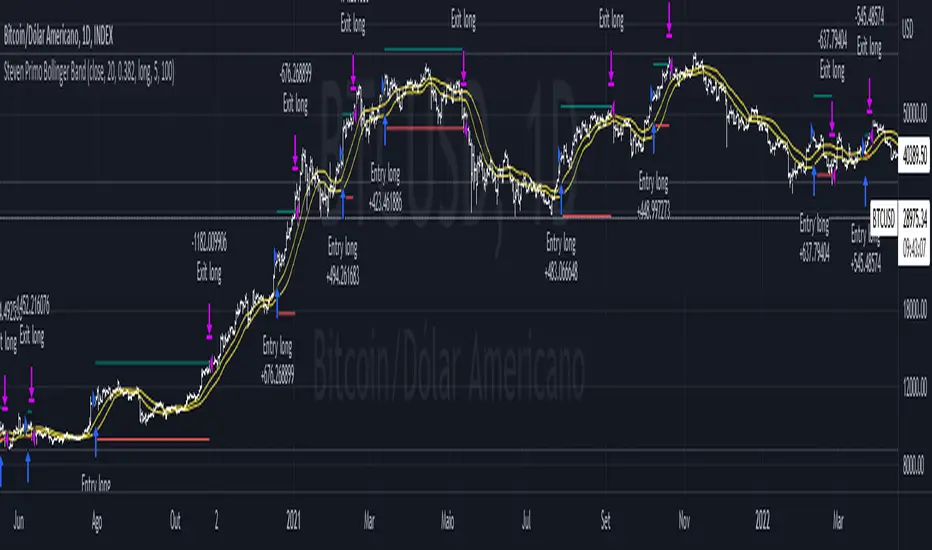
Steven Primo's bollinger bands strategyHi, this strategy is taken from a video made by Steven Primo. You can look it up on YouTube if you want to know about it. It is a mean-reversion strategy based on the Bollinger Bands, in which we wait for 5 consecutive closes above the upper band, and for a short-term top. Once it happens, we place an entry order on this top, with a stop at the nearest bottom before the movement started, and use the difference from the stop and entry point to determine the target. For shorting, it's the same prStratejiEduardoMattje tarafından1205
Resistance/Support Indicator - FontiramisuIndicator showing resistances and support, based on pivots location When a new pivot location is near from a resistance/support the latter gains weight. You can modify multiple parameters : Nb Max res/sup : Define the number max res/sup to keep in our res/sup history array. The greater it is the older bar index will be taken. Nb show res/sup : Define the number of res/sup to be drawn. Min weight shown : Define min res/sup weight to be shown. Weight is used to measure strengh of res/sGöstergeFontiramisu tarafındanGüncellendi 290
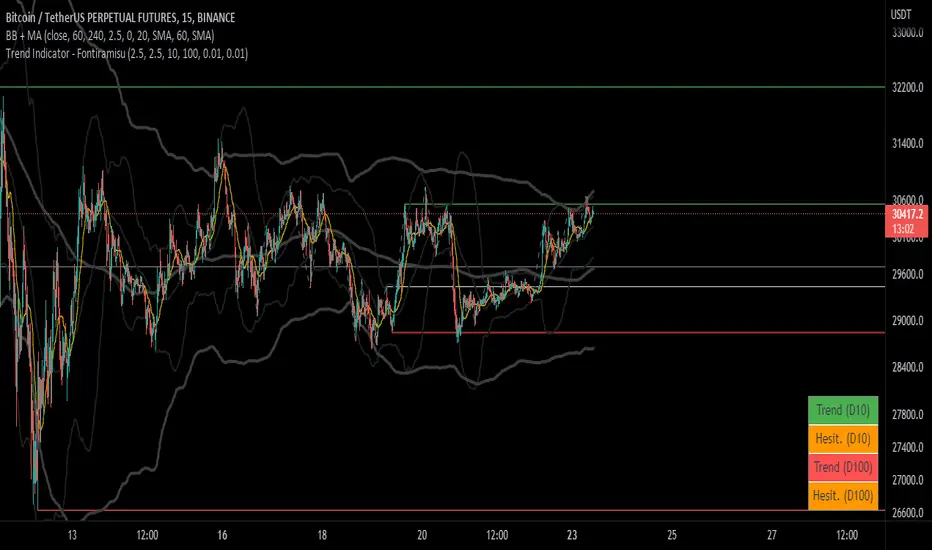
Trend Indicator (dow trending) - FontiramisuIndicator showing pivots and interpret a trend out of it. Pivots are calculating with deviation parameter to validate with more precision. Trending moves are calculated according to Dow Theory : In an uptrend, if the price made a new high, the price must make a new high to confirm the trend, otherwise, it might signal a possible change in the trend. In an uptrend, if the price made a new low, the price must make a new low to confirm the trend, otherwise, it might signal a possible chanGöstergeFontiramisu tarafından121
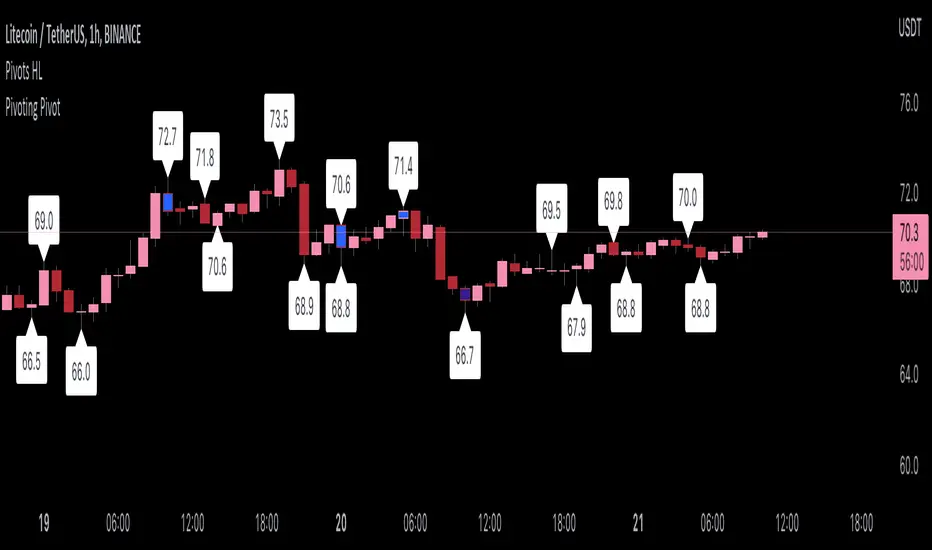
Pivoting PivotMany people use Pivots when conducting analysis, but I don't see many people using pivoting pivots. Pivoting pivots are pivots that don't have any other pivots around them. They can be useful when trying to separate pivot clusters from important pivot points. The code is calculated by finding the distance between two candlesticks (left check), then calculating the distance between the last pivot and the current candlestick. On the chart: labels are TradingView's official pivot high and pivot lGöstergeOztheWoz tarafından278
Nabz-BBMACD-2022-V1.1I have tried to make script which triggers indicators on combination of different feedback including Bollinger bands and MACD. Also used some of my logic by trial and error, It gave 744%+ profit on back-testing on coin RUNE/USDT from Jan 2021. It is my first script, I am happy to help the community. Please share your feedback. Stratejinabamb tarafından5114
Hayden's Advanced Relative Strength Index (RSI)Preface: I'm just the bartender serving today's freshly blended concoction; I'd like to send a massive THANK YOU to @iFuSiiOnzZ, @Koalafied_3, @LonesomeTheBlue, @LazyBear, @dgtrd and the rest of the PineWizards for the locally-sourced ingredients. I am simply a code editor, not a code author. The book that inspired this indicator is a free download, plus all of the pieces I used were free code from the PineWizards; my hope is that any additional useful development of The Complete RSI trading sysGöstergeBarefootJoey tarafındanGüncellendi 31 1.4 K