ElliottABC Pulse Multi-Timeframe Correction MapperElliottABC Pulse – Multi-Timeframe Correction Mapper
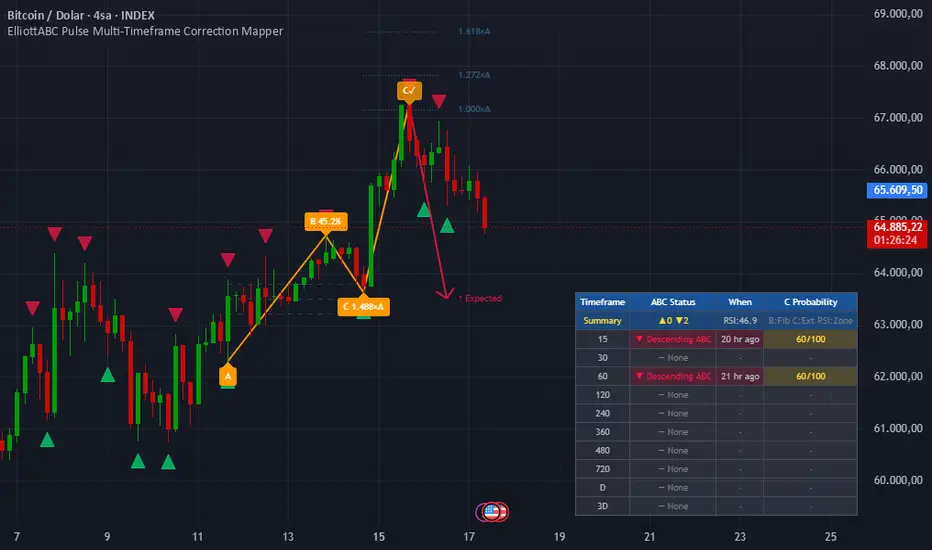
ElliottABC Pulse automatically identifies and labels Elliott Wave ABC corrective structures across up to ten simultaneous timeframes, combining classical wave theory with Fibonacci ratio validation, RSI confluence filtering, and a real-time signal scoring engine — all rendered as a single chart overlay.
Instead of manually hunting for corrective patterns on each timeframe separately, this indicator scans pivot structures across all selected timeframes at once and presents a consolidated dashboard showing signal direction, elapsed time since formation, and a composite quality score for every active timeframe.
What Is an ABC Correction?
In Elliott Wave theory, markets move in two phases: impulsive waves (in the direction of the trend) and corrective waves (counter-trend). The ABC correction is the most common corrective structure, consisting of three legs:
Wave A — The initial counter-trend move from a swing high or low
Wave B — A partial retracement back toward the origin of wave A
Wave C — A final push in the direction of wave A, typically equal to or extending beyond wave A
When the C wave completes, price often resumes the original trend direction — making C completions high-probability areas for re-entry or reversal trades.
This indicator detects two variants:
Descending ABC (H-L-H-L): A bearish correction that resolves into a potential bullish continuation. The C wave terminates below the B wave origin.
Ascending ABC (L-H-L-H): A bullish correction that resolves into a potential bearish continuation. The C wave terminates above the B wave origin.
Features
Automatic ABC corrective pattern detection using zigzag pivot filtering
Strict Fibonacci ratio validation for both wave B retracement and wave C extension
Optional RSI momentum confluence filter
Real-time 0–100 composite signal scoring system
Fibonacci target projection levels (1.000×A, 1.272×A, 1.618×A)
B wave retracement grid (38.2%, 50.0%, 61.8%)
Expected direction arrow projected from the C completion point
Duplicate-safe drawing engine — the same pattern is never drawn twice
Multi-timeframe dashboard across up to 10 user-defined timeframes
Color-coded elapsed time indicator (fresh / aging / stale signals)
Clean, non-repainting overlay with full input customization
How It Works
Pivot Detection
The indicator uses Pine Script's ta.pivothigh() and ta.pivotlow() functions with user-defined left and right bar counts to identify structural swing highs and lows. A zigzag filter (Min. Swing Size %) discards any pivot where the price move is smaller than the defined percentage threshold, eliminating micro-noise from the pivot array and keeping only meaningful structural swings.
Pivots are stored in an alternating high/low array. If two consecutive pivots occur in the same direction, only the more extreme one is kept — ensuring the zigzag structure is always clean and directionally alternating.
ABC Validation
Each candidate pattern is tested against five conditions simultaneously:
ConditionRequirementAlternating structurePivots must follow strict H-L-H-L or L-H-L-H alternationB retracement (min)Wave B must retrace at least Min A-B Retracement of wave A (default 38.2%)B retracement (max)Wave B must not retrace more than Max A-B Retracement of wave A (default 88.6%)C extension (min)Wave C must extend at least Min C Extension of wave A (default 1.0×)C extension (max)Wave C must not extend beyond Max C Extension of wave A (default 1.618×)Structural integrityC must break B's origin; B must not exceed A's originRSI confluence (optional)Descending ABC: RSI < 50 / Ascending ABC: RSI > 50
The indicator scans up to 6 consecutive pivot windows on each bar update, so it catches both fresh and recently formed patterns without missing setups due to pivot array timing.
Duplicate Prevention
A dedicated index array tracks the bar position of each pattern's A pivot. Once a pattern is drawn, its A bar index is recorded and skipped on all future bar updates — preventing the redraw artifacts common in pivot-based indicators.
Signal Scoring (0–100)
Every confirmed ABC pattern receives a composite score from four independent components:
ComponentMax ScoreConditionB Fibonacci Zone30 ptsB retracement within 0.500–0.618 (golden zone) scores full; 0.382–0.786 scores partialC Extension Zone25 ptsC extension within 1.0–1.272 (classic target) scores full; 1.272–1.618 scores partialRSI Extreme Zone25 ptsRSI below 30 (Bull) or above 70 (Bear) scores full; partial credit between 30–50 or 50–70A Wave Magnitude20 ptsWave A spanning ≥ 2% of price scores full; ≥ 1% scores partial
Scores of 70 or above indicate high-quality setups. Scores between 40–69 are moderate. Below 40 suggests marginal structure — still valid, but lower-conviction.
Chart Overlays
When a valid ABC is confirmed, the following elements are drawn directly on the chart:
Wave labels: A at the origin, B with its retracement percentage, C with its extension multiplier, and C✓ at the completion point
Connecting lines: Segment lines linking A → B → C → C✓
Fibonacci extension levels: Three dotted horizontal lines projected from the C pivot — 1.000×A, 1.272×A, and 1.618×A — showing classic C wave targets
B retracement grid: Three dashed horizontal levels at 38.2%, 50.0%, and 61.8% between A and B for precision B entry zones
Direction arrow: A projected arrow from the C✓ point toward the A-B midpoint, visually indicating the expected post-correction move direction
Multi-Timeframe Dashboard
The bottom-right table runs the full ABC detection engine independently on each of the 10 configured timeframes using request.security() with lookahead_off to prevent any future data leakage.
Each row in the table shows:
ColumnDescriptionTimeframeThe TF label as configured (e.g. 15, 60, 240, D)ABC Status▲ Ascending ABC / ▼ Descending ABC / — NoneWhenHow long ago the C pivot formed — color-coded green (< 30 min), yellow (< 4 hr), gray (older)C ProbabilityThe composite 0–100 score, color-coded green / yellow / red by strength tier
A summary row at the top displays the total count of bullish and bearish signals across all timeframes, plus the current RSI reading color-coded by zone. When multiple timeframes simultaneously show the same signal direction, confluence is high and setup quality increases significantly.
How To Use
Basic Setup
Add the indicator to your chart on any timeframe
Set TF 1 through TF 10 to the timeframes you want to monitor simultaneously (e.g. 15m, 30m, 1H, 2H, 4H, 6H, 8H, 12H, D, 3D)
Watch the bottom-right dashboard for active ABC signals across all timeframes
Tuning Pivot Sensitivity
Increase Left Bars / Right Bars for fewer, stronger pivots (better for higher timeframe structure)
Decrease them for more frequent, shorter-term pivots (better for intraday scalping)
Raise Min. Swing Size (%) to filter out noisy pivots on volatile assets such as crypto
Tuning ABC Strictness
Tighten Min/Max A-B Retracement to focus only on golden zone retracements (0.5–0.618)
Narrow Min/Max C Extension to require only classic C targets (1.0–1.272)
Enable RSI Divergence Filter on trending instruments for higher-conviction signals
Reading the Dashboard
Prioritize signals where 3 or more timeframes show the same direction simultaneously
Prefer signals with scores of 70 or above for the clearest Fibonacci structure
Use the When column to avoid acting on stale signals — fresh signals (green) carry more weight
Cross-reference with the current RSI reading in the summary row for momentum context
Fibonacci Levels
The 1.000×A level is the minimum expected C target — often used as a conservative take-profit
The 1.272×A level is the most common termination zone for standard ABC patterns
The 1.618×A level marks the extended C target — relevant in high-momentum corrective moves
The B retracement grid (38.2% / 50% / 61.8%) helps identify optimal B-wave entry levels before C begins
Recommended Use Cases
Intraday traders: Configure TF 1–5 as 5m / 15m / 30m / 1H / 2H. Look for ABC completions on the 15m or 30m confirmed by a matching signal on the 1H or 2H for intrabar precision entries.
Swing traders: Use 1H / 4H / 6H / 12H / Daily / 3D. Wait for the daily or 3D to print a fresh high-score ABC before entering on a lower timeframe pullback.
Multi-timeframe analysts: Monitor confluence across all 10 timeframes. When 4 or more timeframes simultaneously show the same signal type with scores above 60, the corrective structure is likely significant on the macro level.
Originality
This script is an original work combining zigzag-filtered pivot detection, simultaneous ten-timeframe ABC corrective pattern validation, a four-component signal scoring engine, and a proximity-safe duplicate prevention system. While Elliott Wave ABC detection is a known concept, the specific implementation — the alternating zigzag array, the 6-window sliding pattern scan, the composite scoring model, and the fully integrated MTF dashboard with elapsed-time coloring — represents the author's own approach to making corrective wave analysis practical and actionable on a live chart.
Limitations
RSI filtering uses the current bar RSI as an approximation for pivot-bar RSI. This is a deliberate simplification that improves signal quality on trending instruments but may occasionally exclude valid setups during consolidation.
The pivot array is capped at 50 pivots and the drawing history arrays at 100 entries to maintain performance. On very active instruments with tight pivot settings, the oldest patterns scroll off automatically.
TradingView's runtime limit of 500 labels and 500 lines applies. On charts with a very long history and tight pivot settings, older drawings are removed by the platform.
This tool is designed for confluence analysis and structural context, not as a standalone mechanical entry system. Always integrate with broader market structure, session context, and sound risk management.
Disclaimer
This indicator is intended for educational and analytical purposes only. No indicator can predict future market movements with certainty. Always use proper risk management and combine multiple forms of analysis before making trading decisions.
TradingView Short Description:
Automatically detect Elliott Wave ABC corrective completions across up to 10 timeframes. Features Fibonacci ratio validation, RSI confluence filtering, a 0–100 signal scoring engine, and a live multi-timeframe dashboard showing signal direction, elapsed time, and setup quality — all in a single chart overlay. Gösterge

Liquidity Vault [Dojo La Nuit]Liquidity Vault maps resting liquidity on your chart as clean horizontal levels and tracks what happens to them — without any buy/sell signals or predictions. It is a pure visualization tool for traders who read price around liquidity.
HOW IT WORKS
The script detects swing pivots and clusters nearby highs (and nearby lows) into single liquidity zones using an ATR-based tolerance, so the levels travel across instruments without re-tuning. Each zone gets a strength score from 0 to 100 built from three factors:
• Touches — how many times price reacted at the level
• Freshness — recent levels score higher and decay over time (configurable half-life)
• Volume — relative volume that accumulated at the level
HOW TO READ IT
• Red lines = sell-side liquidity (resting above price)
• Green lines = buy-side liquidity (resting below price)
• Opacity = strength: the stronger the zone, the more solid the line
• Dimmed, dotted lines = zones that have already been swept (price wicked through the level). They are kept as context, not removed.
SETTINGS
• Zone Detection — adaptive or fixed pivot length, clustering tolerance, lookback, max live zones
• Zone Strength — minimum score to display, freshness half-life, volume weighting on/off
• Visuals — theme (auto/dark/light), strength-based intensity, keep swept zones, line width
• Colors — fully customizable buy-side / sell-side colors
NOTES
Strength is shown through line opacity by design, to keep the chart minimal. Zones are recalculated on confirmed bars. This tool highlights where liquidity rests and when it gets taken — it does not generate entries, targets or signals.
This indicator is for educational and analytical purposes only. It is not financial advice. Always do your own research and manage your own risk.
─────────────────────────
🌙 LIQUIDITY VAULT — Dojo La Nuit
Liquidity Vault mostra la liquidità presente sul grafico come livelli orizzontali puliti e ne traccia l'evoluzione, senza segnali di acquisto/vendita e senza previsioni. È uno strumento puramente visivo per chi opera attorno alla liquidità.
COME FUNZIONA
Lo script individua i pivot di mercato e raggruppa i massimi (e i minimi) vicini in un'unica zona di liquidità tramite una tolleranza basata sull'ATR, così i livelli funzionano su strumenti diversi senza dover ritoccare i parametri. A ogni zona viene assegnato un punteggio di forza da 0 a 100, calcolato su tre fattori:
• Tocchi — quante volte il prezzo ha reagito al livello
• Freschezza — i livelli recenti pesano di più e si attenuano nel tempo (half-life configurabile)
• Volume — il volume relativo accumulato sul livello
COME SI LEGGE
• Linee rosse = liquidità sell-side (sopra il prezzo)
• Linee verdi = liquidità buy-side (sotto il prezzo)
• Opacità = forza: più la zona è forte, più la linea è piena
• Linee attenuate e puntinate = zone già spazzate (il prezzo ha bucato il livello con un'ombra). Restano come contesto, non vengono rimosse.
IMPOSTAZIONI
• Rilevamento zone — pivot adattivo o fisso, tolleranza di clustering, lookback, numero massimo di zone attive
• Forza zone — punteggio minimo da mostrare, half-life della freschezza, peso del volume on/off
• Visual — tema (auto/scuro/chiaro), intensità in base alla forza, mantieni zone spazzate, spessore linea
• Colori — colori buy-side / sell-side completamente personalizzabili
NOTE
La forza è rappresentata tramite l'opacità della linea, per scelta, per mantenere il grafico minimale. Le zone vengono ricalcolate sulle barre confermate. Lo strumento evidenzia dove si trova la liquidità e quando viene presa: non genera entrate, target o segnali.
Questo indicatore è a scopo puramente didattico e di analisi. Non è consulenza finanziaria. Fai sempre le tue valutazioni e gestisci il tuo rischio. Gösterge

Acceleration + Wyckoff (Balanced) v6Hey,
I created this indicator with GROK.
I welcome all feedback, as I really don't know what i'm doing lol
Here is a summary of what I'm trying to achieve....
This is a custom momentum and acceleration indicator that combines Stan Druckenmiller’s second-derivative concept with Wyckoff Method principles. It helps traders identify potential turning points by measuring not just momentum, but the rate of change of momentum (acceleration).
It is designed to be more readable and practical than traditional Rate of Change (ROC) indicators, while providing actionable Wyckoff-style signals (Springs and Upthrusts).
Benefits
Early Reversal Detection: By focusing on acceleration (not just price or basic momentum), it can highlight potential turning points earlier than many standard indicators.
Wyckoff + Modern TA Hybrid: Combines classic Wyckoff concepts (Springs & Upthrusts) with Druckenmiller-style second-derivative thinking.
Flexible Across Assets: Works well on both individual stocks (e.g. RRL) and commodities (e.g. Gold).
Customizable: Users can adjust sensitivity, enable/disable volume filtering, and choose display styles.
Actionable Signals: Clear visual markers (green/red triangles) make it easy to spot potential high-probability setups.
Best Use Cases
Daily charts for swing trading and short-term reversals
Weekly charts for identifying larger structural shifts
Trending markets (especially useful on Gold and resource stocks)
Identifying exhaustion points in both uptrends and downtrends
Combining with other tools (volume, support/resistance, or your existing indicators)
In Summary
This indicator gives you a clearer view of momentum strength and acceleration while adding Wyckoff-inspired reversal signals. It solves common issues with traditional momentum indicators (poor scaling and late signals) and provides a practical, visual way to spot potential Springs and Upthrusts with adjustable sensitivity.
Gösterge

Camarilla Pivot Plays - Maaz= Camarilla Pivot Plays - Maaz (Advanced Framework Engine) =
Camarilla Pivot Plays - Maaz is an institutional-grade quantitative workspace engine engineered for professional intraday equity, index, and futures traders. Designed to strip out raw market noise and address the mathematical flaws of standard retail pivot scripts, this system delivers a highly precise view of daily support, resistance, and expansion structures based on classic institutional order-flow frameworks.
== 🚀 1. Core Innovations & Multi-Session Engine ==
Standard pivot indicators calculate historical lines purely off daily bars, blindly mixing Regular Trading Hours (RTH) and Extended Trading Hours (ETH) data. This creates misaligned lines that do not match professional order-flow layouts.
This indicator resolves that issue by deploying a customized Multi-Session Snapshot Engine. By calculating historical session boundaries and tracking extended-hours shifts, the indicator plots clean, un-cluttered stepline levels that anchor to the exact structural bars seen on standalone institutional platforms:
CP (Central Pivot): The dynamic directional anchor boundary for the trading day.
R3 / S3: The dynamic range boundaries defining institutional value and traversal mean-reversion loops.
R4 / S4: The critical breakout launchpads where institutional short squeezes or liquidations accelerate.
R6 / S6: Ultimate daily mathematical expansion target projections.
== 📊 2. The Integrated Workspace HUD Panel ==
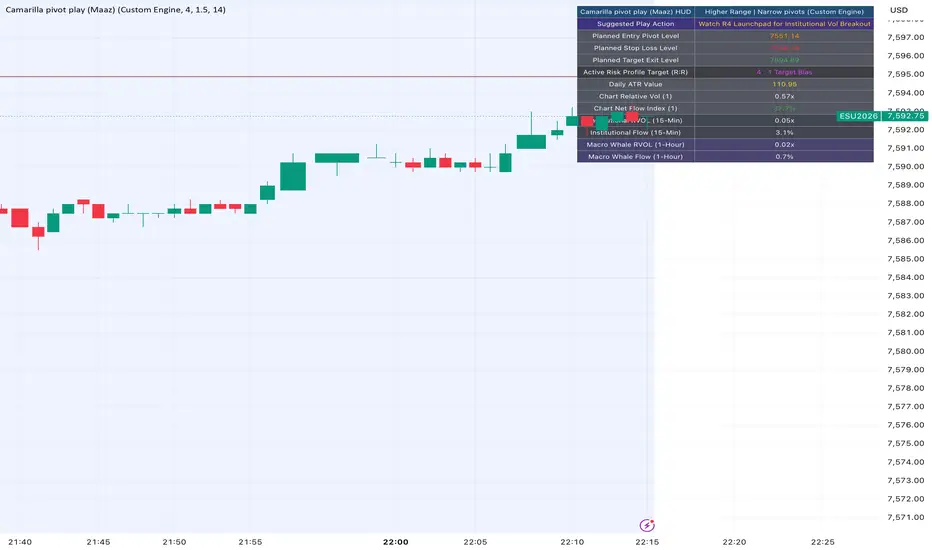
To bypass standard table clipping errors, this script embeds a stacked, comprehensive workspace dashboard in the top-right corner of your workspace screen. This HUD continuously reads live price metadata to evaluate and display:
Strategic Profile Matrix: Tracks your active framework mode (Alpha Momentum, Tactical Delta, Direct Market DME, or Legacy Frame).
Volatility Coiling Status: Classifies the current pivot width as Wide or Narrow to instantly dictate whether you should fade the range or play a trend breakout.
Suggested Play Actions: Prints dynamic tactical suggestions or shifts to bright yellow execution flags when levels are actively breached.
Pre-Calculated Target Prices: Explicitly projects your Planned Entry, Planned Stop Loss, and Planned Target Exit levels inside the table before a trade even triggers.
== 🔬 3. Granular Metric Guide ==
=== A. Relative Volume (RVOL) — The Breakout Validation Filter ===
RVOL mathematically divides the current session's volume at the exact live bar index by a rolling 20-period simple moving average of volume.
0.00x – 0.79x (Illiquid / Sub-Normal): STRICT HOLD. Institutional desks are absent. Breakouts crossing R4 or S4 inside this range are highly prone to immediate failure.
0.80x – 1.49x (Standard Consolidation): Healthy volume for mean-reversion traversals fading R3 and S3.
1.50x – 2.99x (Institutional Spark / True Breakout): CONFIRMED EXECUTION WINDOW. Volume is at least 150% higher than historical normal averages at this specific time. Big blocks are aggressively absorbing supply and pushing price out of consolidation.
3.00x+ (Climax Volatility): Hyper-extended volume spikes. Highly favorable for rapid target completions, but entering right at the print risks buying the absolute peak of a volume exhaustion spike.
=== B. Institutional Net Flow Index — The Order Flow Sentiment Tape ===
Tracks the volume-weighted locations of candle closes relative to their total intraday high/low ranges to monitor net structural capital flows in real time.
+70.0% to +100.0% (Aggressive Buying / Short Squeeze): Extreme institutional demand. Do not attempt to short or fade resistance levels under any circumstances.
+15.1% to +69.9% (Steady Capital Accumulation): Supportive environment for buying pullbacks or taking upward R4 breakout trades.
-15.0% to +15.0% (Equilibrium / Chop Zone): Total structural balance. Order flow is clean on both sides. Ideal for Wide Pivot Traversal Plays.
-15.1% to -69.9% (Steady Capital Distribution): Institutions are steadily unloading size. Rallies are being met with heavy selling overhead.
-70.0% to -100.0% (Aggressive Distribution / Capitulation): Intense liquidation pressure. Do not attempt to catch a falling knife or buy support.
== 🛠️ 4. User Inputs & Variable Profiles ==
Platform Profile Presets: Select an innovative model profile to automatically override calculation parameters and match specific platform emulations (Alpha Momentum, Tactical Delta, Direct Market DME, Legacy Frame).
Risk-to-Reward Ratio (R:R): Allows complete control over your risk multiples. The HUD automatically updates stop loss and take-profit pricing fields based on the selected parameter ratio.
Execution Filters: Toggle requirements for high-volume breakouts, filter out sub-threshold volatility noise, and configure custom ATR target verification lengths.
== 💻 5. Technical Source Code Blueprint & Implementation ==
The architecture of Camarilla Pivot Plays - Maaz is engineered utilizing Pine Script v6. Below is a highly annotated structural blueprint explaining the execution loops, session snapshot tracking systems, and calculations used in the code matrix:
Pine Script
// --- Lookback Range Capture Functions ---
getHighestSince(bool sinceCondition, int offset) =>
ta.highest(high, nz(ta.barssince(sinceCondition)) + 1)
getLowestSince(bool sinceCondition, int offset) =>
ta.lowest(low, nz(ta.barssince(sinceCondition)) + 1)
// --- Custom Volatility Capture Math ---
float yS3 = snapshotVal(s3, preStartBar)
float yR3 = snapshotVal(r3, preStartBar)
float currentRange3 = r3 - s3
float yRange3 = yR3 - yS3
// --- Dynamic Width Engine Matrix Assignment ---
string pivotWidthClass = "Similar pivots"
if currentRange3 > yRange3 * (1 + widthThreshold / 100)
pivotWidthClass := "Wide pivots"
else if currentRange3 < yRange3 * (1 - widthThreshold / 100)
pivotWidthClass := "Narrow pivots"
// --- Asymmetric Risk Mitigation Calculations ---
getStopLoss(float pivotLevel, float target, float rrRatio) =>
(pivotLevel * (rrRatio + 1.0) + target * (0.5 - 1.0)) / (rrRatio + 0.5)
== 📜 6. Disclaimer & Terms of Use ==
This script is published for educational and analytical purposes only. Past performance does not guarantee future market results. Backtest parameters thoroughly and manage your risk according to your own personalized capital rules before deploying live market execution. Gösterge

Camarilla Pivot Plays - MaazCamarilla Pivot Plays - Maaz is a institutional-grade quantitative workspace engine engineered for active intraday equity and futures traders. Designed to strip out raw market noise and address the flaws of standard layout pivot scripts, this system delivers an institutional-level view of daily support, resistance, and breakout structures based on Thor Young's classic trading playbook.
The indicator is split into two major algorithmic engines:
1. The Multi-Session Historical Alignment Engine
Unlike generic pivot indicators that pull simple daily data bars (often mixing regular and extended hours incorrectly), this script utilizes a complex multi-session memory snapshot pipeline. By calculating historical session boundaries and tracking extended-hours shifts (useEthForCams), the plots shift step-heights at the exact structural bars required to match professional configurations. It provides clean, un-cluttered stepline plots for:
CP (Central Pivot): The ultimate directional anchor boundary for the session.
R3 / S3: The dynamic range boundaries defining institutional value and traversal reversion loops.
R4 / S4: The critical breakout launchpads where institutional short squeezes or liquidations occur.
R6 / S6: Ultimate daily mathematical expansion targets.
2. The Integrated Precision HUD Panel
The system bypasses standard chart-clipping errors by embedding a stacked, comprehensive workspace dashboard in the top-right corner of your screen. This HUD continuously reads live price metadata to evaluate and display:
Trend Range Bias: Classifies the session macro structure as Higher Range, Lower Range, or Neutral.
Volatility Coiling Status: Classifies the pivot width as Wide or Narrow to instantly tell you whether you are in a range-fading or trend-breakout environment.
Suggested Play Actions: Tells you exactly what setup to watch for (e.g., Watch R4 for Outright Breakout Long) or shifts to bright yellow execution flags (TRIGGER ACTIVE) when levels break.
Pre-Calculated Target Prices: Explicitly states your Planned Entry Pivot Level and Planned Target Exit Level directly inside the table before the trade even triggers.
Institutional Filters: Provides live readouts of Daily Average True Range (ATR), Relative Volume (RVOL) to confirm big block-order breakouts, and an Institutional Net Flow Index tracking raw buy/sell delta pressure. Gösterge

Visible Range Support and Resistance [BigBeluga]🔵 OVERVIEW
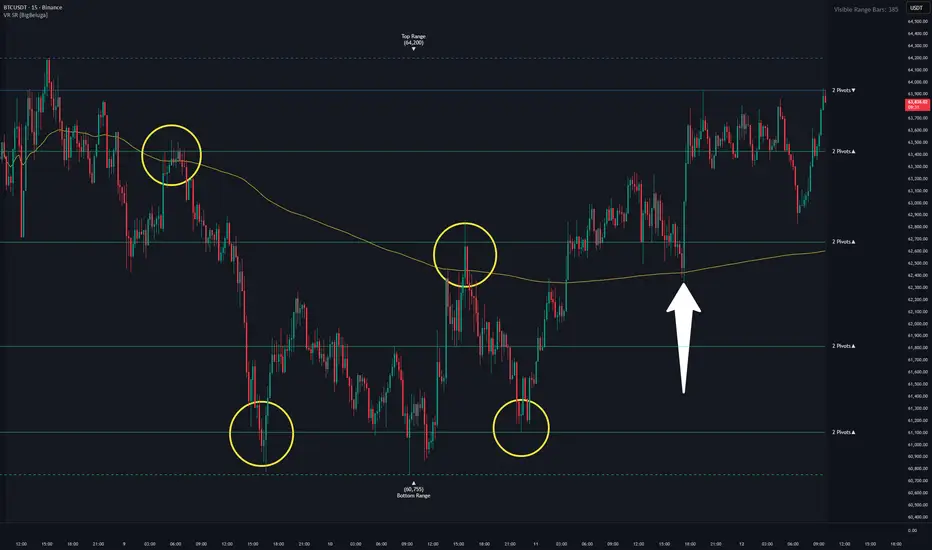
Visible Range Support and Resistance is a dynamic support/resistance tool that analyzes price structure only within the visible range of your chart. It detects key levels based on clustered pivots inside a binned vertical range and highlights zones where price has historically reacted. The tool adjusts in real-time as you pan or zoom, offering adaptive precision at any scale.
🔵 CONCEPTS
Pivot Clustering: Price highs/lows are collected into horizontal "bins" across the visible chart range. If multiple pivots align within a bin, that area is marked as a potential support or resistance zone.
Visible Range Only: Calculations are limited strictly to the bars currently visible on the chart. Zooming or panning changes the result.
Bin System: The visible high-to-low range is divided into 100 horizontal zones (bins) to group pivots and detect confluence.
Multi-Threshold Detection: Users can enable two separate S/R detection levels with different pivot count thresholds for more nuanced signals. The more pivot points a level has, the thicker and richer the color.
Directional Context: Labels include arrows (▲ or ▼) to show whether the current price is above (support) or below (resistance) each zone.
Range Boundaries: The top and bottom of the visible range are marked with dashed lines and labeled as Top Range and Bottom Range .
🔵 FEATURES
Detects S/R zones based on the number of pivots found within each price bin.
100 horizontal bins divide the visible price range, allowing high resolution detection.
Only uses data from visible bars—zooming out recalculates the indicator for more data.
Customizable number of pivot confirmations (e.g., 2, 3, 4, 5) before a level is shown.
5 Pivots
Dual-level detection lets you show stronger and weaker zones separately.
Automatically colors support (green) and resistance (blue) with dynamic intensity.
Labels show pivot count and direction (support/resistance).
Automatic cleanup of overlapping levels for visual clarity.
Dashed top/bottom range markers help define the visible scope.
Session SMA calculates from the visible range start (from the chart edge)
Visible range bars count
🔵 HOW TO USE
Zoom in for precise intra-range support and resistance zones based on current structure.
Zoom out to load more pivot data and identify long-term levels.
Use the pivot threshold (e.g., 3 or 4) to control signal strength—higher = stronger levels.
Watch for price reactions or breakouts around high-pivot zones to identify key areas.
Combine with trend, volume, or order flow tools to confirm the relevance of each S/R zone.
Adjust line and label colors for better contrast with your chart theme.
🔵 CONCLUSION
Visible Range Support and Resistance is a smart, range-sensitive tool for mapping meaningful horizontal levels. By scanning only what you see on the screen, it provides an adaptive edge to traders focused on real-time price action. Whether you’re scalping short-term zones or zooming out for macro structure, this tool flexes with your view to keep the most relevant levels front and center. Gösterge

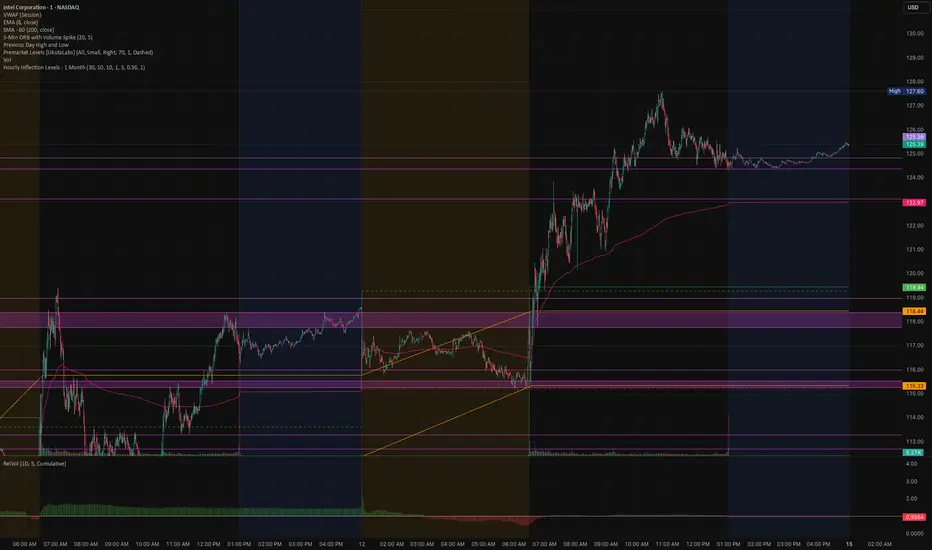
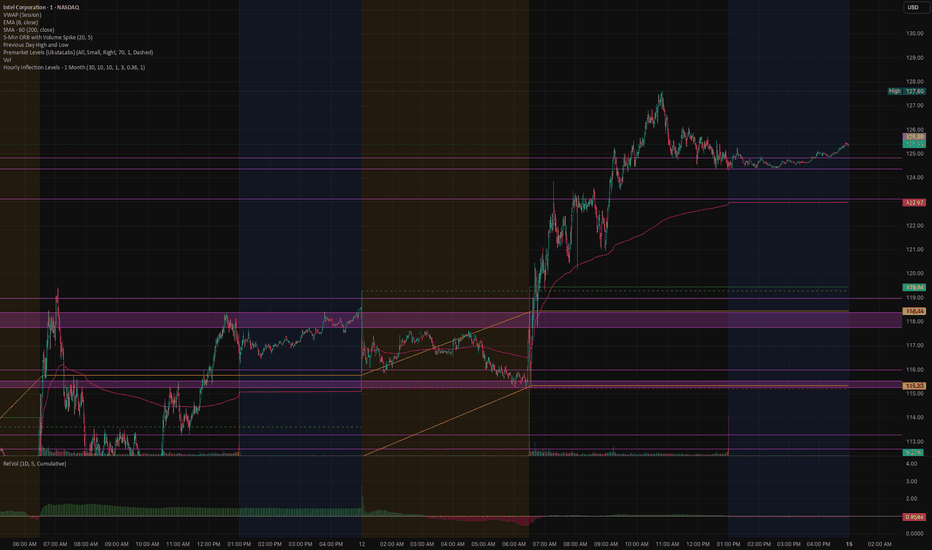
Hourly Inflection Levels/ pivot pointsThis indicator finds the price levels where the hourly chart has repeatedly turned, and draws them as support/resistance zones — regardless of what timeframe your chart is on. It pulls 1-hour data via request.security, so the same zones appear whether you're viewing a 5-minute, 1-hour, or 4-hour chart.
How it works
1. Pivot detection. On the hourly series it locates two kinds of turning points:
Wick pivots — pivot highs/lows based on candle high/low (where price actually reached).
Body pivots — pivot highs/lows based on max(open, close) / min(open, close) (where price closed the swing).
2. Intensity filter. Each pivot is scored by how far price travelled inside its pivot window (the displacement between the pivot and the opposite extreme). Weak, shallow pivots are discarded via the Min Inflection Intensity threshold, so only meaningful inflections survive.
3. Cross-type merging into zones. Every qualified pivot — wick or body, high or low — is pooled together, sorted by price, and merged: any pivots within the Merge / Zone Tolerance of each other collapse into a single zone. The zone's boundaries become the highest and lowest merged price; each merge adds one to the zone's touch count, and the zone keeps the strongest intensity of its members.
4. Display. Zones that have been touched at least Min Touch Count times are drawn as boxes, optionally extended to the right, with a label showing the level's mid-price, touch count, and intensity %. Levels touched fewer times are hidden.
Inputs
Lookback Period — how many days of hourly history to scan (rolling window; old levels are pruned automatically).
Pivot Left/Right Bars — sensitivity of pivot detection.
Min Touch Count — how many pivots must fall in a zone for it to be shown.
Min Inflection Intensity — minimum swing strength for a pivot to count.
Merge / Zone Tolerance — how close pivots must be to merge into one zone.
Wick / Body toggles — choose which pivot types feed the zones.
Display — extend zones right, show labels, zone color, border width.
Reading the zones
A zone with a high touch count and high intensity marks a price area the market has reacted to strongly and repeatedly over the past month — prime candidates for support, resistance, and reaction levels.
Note: Zones are confluence levels built from past hourly pivots, not signals. They don't repaint historically (pivots are confirmed), but the active set updates as new hourly bars form and old ones age out of the lookback window. Gösterge
Fibonacci Touch HeatmapFibonacci Touch Heatmap
Fibonacci Touch Heatmap is an advanced Fibonacci channel indicator that dynamically builds a full upper and lower Fibonacci structure over a user-defined lookback window, then scores each level by how many times price has genuinely touched or respected it. The result is a ranked, color-coded map of the most statistically significant support and resistance zones on your chart — updated automatically on every bar.
What Problem This Solves
Standard Fibonacci tools require manual swing selection and draw static levels with no feedback on whether price actually reacted to them. This indicator eliminates both limitations: it auto-detects the range, draws all 14 Fibonacci levels (7 upper + 7 lower), and continuously counts how many times each level has been touched — giving traders an objective, data-driven view of which levels the market genuinely respects.
How It Works — Technical Details
Range Detection:
The indicator uses ta.highest(high, lookback) and ta.lowest(low, lookback) to identify the high and low of the most recent N bars (default: 300). The midpoint is calculated as the arithmetic average of these two values.
Fibonacci Level Construction:
Seven standard Fibonacci ratios (0.0, 0.236, 0.382, 0.500, 0.618, 0.786, 1.0) are applied symmetrically from the midpoint — upward toward the range high (upper channel) and downward toward the range low (lower channel) — producing 14 distinct price levels in total.
Touch Counting Algorithm:
On the final bar (barstate.islast), the script iterates backward through every bar in the lookback window. For each bar, it checks whether the high or low came within a user-defined sensitivity threshold of any Fibonacci level. The threshold is calculated as a percentage of the level price (default: 0.2%), making it adaptive across different asset classes and price scales. Each qualifying bar increments that level's touch counter.
Gradient Coloring:
A custom gradColor() function interpolates RGB values across three anchor colors — bottom (green), mid (yellow), top (red) — based on the level's vertical position within the channel. This creates a smooth visual gradient that immediately communicates zone type: green = support territory, red = resistance territory.
Touch Heatmap:
Line opacity and the color in the top-right table are determined by each level's touch count relative to the maximum touch count across all 14 levels, using the touchColor() function. Levels with more touches render with warmer, more opaque colors.
Background Zones:
The channel is divided into 9 equal vertical slices, each rendered as a semi-transparent colored box, creating a heat gradient background that visually reinforces price zone significance.
Multi-Timeframe Panel
Two additional timeframes (default: 1H and 4H, fully customizable) are analyzed via request.security(). For each external timeframe, the script independently fetches the 500-bar high/low range, builds the complete Fibonacci channel, runs the touch-counting algorithm, and identifies the top 2 most-touched levels. These are displayed in the bottom-right table, color-coded by timeframe (blue = TF1, purple = TF2), allowing traders to instantly identify cross-timeframe Fibonacci confluences.
Top-Right Table — Most Touched Fib Levels
Displays the top 4 most-touched Fibonacci levels from the current chart timeframe, ranked using a bubble sort across all 14 levels. Each row shows:
Fib ratio with direction arrow (↑ upper channel / ↓ lower channel)
Exact price of the level
Touch count (colored from blue → red based on relative touch frequency)
Zone — Upper (resistance side) or Lower (support side)
How To Use
Set Lookback Bars to define the range of history to analyze. Higher values (500+) reveal macro structure; lower values (50–150) focus on recent structure.
Identify high-touch levels from the top-right table — these are the levels price has tested most frequently and are the strongest candidate zones for future reactions.
Use the multi-TF table to find confluences: when the same Fibonacci level appears as most-touched on both TF1 and TF2 simultaneously, it indicates a high-probability reaction zone.
Adjust Touch Sensitivity (%) based on asset volatility:
Crypto: 0.2–0.5% recommended
Forex: 0.05–0.15% recommended
Equities: 0.1–0.3% recommended
Color gradient gives immediate visual context — price trading near red zones suggests resistance pressure; near green zones suggests support.
Inputs Summary
InputDefaultDescriptionLookback Bars300Number of bars used for range and touch detectionTouch Sensitivity (%)0.002Tolerance for a bar high/low to qualify as a touchFib Line Width1Visual thickness of dashed level linesTop / Mid / Bottom ColorRed / Yellow / GreenGradient anchor colorsTimeframe 160 (1H)First external TF for multi-TF panelTimeframe 2240 (4H)Second external TF for multi-TF panel
Originality
This script is an original work combining automatic range-based Fibonacci channel construction with a bar-by-bar touch counting algorithm and multi-timeframe confluence detection. While Fibonacci retracement is a widely used concept, the specific implementation — symmetric dual-channel construction from a dynamic midpoint, percentage-adaptive touch sensitivity, RGB gradient heatmap coloring, bubble-sort level ranking, and simultaneous multi-timeframe touch analysis via request.security() — represents the author's own methodology for transforming static Fibonacci levels into a dynamic, data-scored support/resistance framework.
Disclaimer
This indicator is intended for educational and analytical purposes only. No indicator can predict future price movements with certainty. Always combine multiple forms of analysis and apply proper risk management before making any trading decisions.
Short Description:
Automatically builds a dual Fibonacci channel from the N-bar range high/low, counts how many times price has touched each of the 14 levels, and ranks them by touch frequency. Includes a multi-timeframe panel showing the most-respected Fibonacci levels across two additional timeframes for confluence analysis. Gösterge

ORB WindowsA clean, fully configurable Opening Range Breakout indicator with up to three simultaneous time windows. This script lets you define your own windows. Set them to whatever your session or strategy calls for.
Three configurable windows
Each window tracks its own high and low independently. Window 1 defaults to 5 minutes, Window 2 to 15 minutes, Window 3 to 60 minutes (hidden by default). Set any window to whatever range you want. Lines are visually differentiated: W1 is solid, W2 is dashed, W3 is dotted.
Break and confirm markers
Two signals per level, per window:
Small triangle — price ticked through the level (break)
Larger triangle — candle closed through the level (confirmation)
Filtering on close confirmation reduces noise from wicks and fakeouts.
Range label
When each window locks in, a label shows the high, low, and range size in both points and percentage. Useful for quickly assessing whether the ORB is tight or wide before deciding how to trade the break.
Formation window highlight
A subtle background color marks the W1 formation period so you can see exactly which candles built the range.
12 alert conditions
Four per window: break above, break below, close above, close below. Wire them up however your workflow calls for.
Settings
ORB Windows: set the duration (in minutes) for each of the three windows
Visibility: toggle each window, markers, range label, and formation highlight independently
Colors: fully customizable per window
Designed for intraday use. Works on any liquid instrument with a defined regular session. Gösterge

FENIX Waves# FENIX Waves · pacote de publicação (TV House Rules)
Script: FENIX Waves (EN, self-contained) · fonte local: fenix_waves.pine
Status: injetado + compilado + salvo no editor (slot novo aberto pelo user 29/05).
## Passos manuais no TV (user faz · eu não consigo publicar)
1. Renomear o script SALVO pra "FENIX Waves" (o título on-chart já é FENIX Waves via indicator(); o nome do script salvo pode ter ficado "Meu script").
2. Add to chart → deixar SÓ o FENIX Waves visível (esconder Buy Sell, EMA, RSI, etc) → gráfico LIMPO (House Rule #4).
3. Publicar → colar o título e a descrição abaixo (inglês primeiro).
4. Marcar como Open-source (recomendado · descrição é o que o usuário lê).
## Título da publicação (EN only)
FENIX Waves — Elliott A-B-C visualizer with colored HMA line + projection
## Descrição (EN · colar)
FENIX Waves turns a discretionary Elliott Wave count into a clean, always-on chart overlay.
What it does
- Paints a smooth Hull Moving Average (HMA) line that follows price and RE-COLORS per wave: Wave A (down) red, Wave B (up) green, and the sub-waves of Wave C in amber (down legs) / cyan (up legs), so the active wave is obvious at a glance.
- Labels every turning point. When a macro turn and a sub-wave turn fall on the same candle, the labels MERGE into one (e.g. "C-i") instead of overlapping.
- Draws a dashed PROJECTION of the path you expect next (wave-2 target → wave-3 bottom → extension). The projection is measured in candles via bar_index, so it stays consistent on every timeframe. A "Nearest target only" switch hides the deep legs so the price scale stays tight.
How it works
- You mark the pivots by date in the settings: the macro A/B/C turns (top, bottom of A, top of B) and, as the count develops, the ends of sub-waves i…iv of C. The script segments the HMA by those timestamps and colors/labels each segment accordingly. Label distance from price auto-scales with ATR.
- Nothing is auto-detected: this is a VISUALIZATION engine for YOUR count, not a wave-finder. That keeps it honest — it shows exactly the structure you mapped.
How to use
1. Add to chart. The defaults show a sample BTC A-B-C count.
2. Open settings → Macro: set Wave A start, A→B (bottom of A), B→C (top of B) to your own pivots (by date).
3. Sub-waves of C: set the end of each sub-wave as price confirms it (leave far-future to disable).
4. Projection: set the price targets and how many candles ahead each leg should reach.
What makes it original
- Not a mashup and not another auto-ZigZag. It is a manual Elliott mapping tool: a single colored line that encodes the whole A-B-C + sub-wave count, with coincident-label merging and a timeframe-consistent forward projection — a compact way to keep a discretionary wave thesis visible and unambiguous across timeframes.
Notes
- Works on any symbol/timeframe. Best read on the timeframe where you defined the pivots.
- Open-source — read the code to see exactly how segmentation and projection are computed.
## Checklist House Rules (do TV_PUBLISH_REGRAS.md)
- Título em inglês
- UI/inputs/labels em inglês (self-contained)
- Descrição EN detalhada · método + como usar + originalidade
- Não é mashup · motor de visualização próprio
- Gráfico LIMPO na publicação (esconder outros estudos) · passo manual
- Desenhos explicados (linha colorida, labels A/B/i.., projeção tracejada)
Gösterge

Liquidity Sweep Indicator [Income Statement]Liquidity Sweep & Reversal Detector
This indicator is built around a specific market structure concept: liquidity sweeps (also called stop-hunts), where price temporarily violates a known swing level to trigger resting orders, then immediately reverses back inside range. That failed breakout is the signal, not the breakout itself.
The three filters are not independent features — they are a deliberate confirmation stack designed to answer one question: is this reversal likely to be institutional, or is it retail noise?
HOW THE LOGIC WORKS
1. Swing Structure (Pivot Detection)
The script continuously tracks the most recent confirmed pivot highs and lows using a user-defined lookback period. These pivots represent visible liquidity pools — price levels where stop-loss orders from trapped traders are clustered.
2. The Sweep Condition
A bullish sweep is confirmed when: (a) the current bar's low dips below the most recent pivot low, and (b) the bar closes back above that level. This closing behaviour is critical — it distinguishes a genuine stop-hunt from a continuation breakdown. The reverse applies for bearish sweeps. A minimum sweep depth (%) filter prevents the script from triggering on negligible edge-grazes.
3. Volume Confirmation (Smart Money Filter)
Institutional absorption of liquidity typically produces above-average volume. The script compares the sweep bar's volume against a 20-bar simple moving average and requires it to exceed a configurable multiplier (default 1.7×). This single filter eliminates the majority of false positives generated by low-liquidity sweeps in off-hours or thin markets.
4. EMA Trend Alignment
To avoid taking counter-trend reversals in strong momentum environments, an optional EMA filter restricts bullish sweep signals to bars closing above the EMA, and bearish sweep signals to bars closing below it. This transforms the detector from a range-bound tool into one that works across trending and ranging conditions.
5. ATR-Based Targets
Take Profit levels are calculated as a multiple of the 14-period ATR from the close of the sweep bar. Because ATR is normalised to the instrument's volatility, the same multiplier setting produces sensible targets across assets with very different price scales — stocks, crypto, forex, and commodities. Targets are displayed in the asset's native tick precision using syminfo.mintick.
SETTINGS GUIDE
Swing Length (2–20): Controls the pivot lookback. Lower values (2–5) detect intraday liquidity pools; higher values (10–20) track significant swing highs/lows on higher timeframes.
Minimum Sweep % : Sets the minimum wick penetration beyond the pivot before a sweep is considered valid. Prevents false signals from minor wicks that barely exceed the level.
Volume Multiplier : Sweep bar volume must exceed this multiple of the 20-bar average. Increase for stricter institutional confirmation; decrease in lower-volume instruments.
EMA Length & Trend Filter Toggle : The EMA acts as a macro regime filter. When enabled, it restricts signals to the trend direction. Disable it in ranging/mean-reverting markets.
ATR Target Multiplier : Scales the Take Profit distance relative to recent volatility. 1.5 is a balanced default; tighten for scalping, widen for swing trades.
USAGE NOTES
This indicator works best when sweep signals align with additional confluence — for example, a bullish sweep occurring at a higher-timeframe support zone, a Fair Value Gap, or a daily demand area. The script does not predict reversals; it identifies the structural conditions under which reversals statistically have higher probability.
Always use proper risk management and do not rely on any single indicator in isolation . Gösterge

Central Pivot Range (CPR) with SignalsCentral Pivot Range
The Central Pivot Range (CPR) is an indicator to identify key price points to set up trades. CPR is beneficial for intraday trading.
Before you understand the CPR, it is important for you to know the Support and Resistance; I’d suggest you read through this chapter to know what more about Support and Resistance before proceeding further.
The CPR consists of three components –
Pivot
Bottom Central Pivot (BC)
Top Central Pivot (TC)
These are derived out of the underlying’s High, Low, and Close calculations –
Pivot = (High + Low + Close)/3
Bottom CPR = (High + Low)/ 2
Top CPR = (Pivot – BC) + Pivot
Spend a minute to understand the formula. These are simple averages and manipulation to the averages. In any technical indicator, the moment you see averages, you need to associate the indicator to the underlying trend.
The CPR does just this, i.e. helps the trader identify key price points and the associated trend around these price points.
Today’s CPR values act as the reference for tomorrow’s trading. We will get back to this in a bit.
On Kite search for ‘Pivot’ in studies, and you’ll find the CPR indicator –
I’m looking 15-minute chart of M&M here. Once you load the CPR, the CPR loads as three horizontal lines, as seen below.
One thing that stands out is the varying width of the CPR. I’ve marked three points on the chart to discuss this.
I want you to look at the first arrow starting from left, ignore the CPR but look at the price action itself. Remember this is the 15-minute chart, and it is quite clear that the day started with a small green candle with not much movement through the day. The open and close were close to each other.
Whenever, we have a sideways movement, the next day’s CPR narrow ranged, this is exactly what we observe on the next day. Now the 2nd day itself was trending day. Hence the CPR for 3rd day was a wide-ranged one.
So the point is –
If today is a narrow range day, tomorrow’s CPR will be a narrow ranged CPR.
If today is a trending day, tomorrow’s CPR is a wide-ranged one. Higher the trend, wider is the CPR.
Alright, so how do we use the CPR? Well, this is quite straightforward –
Bullish outlook, look for buying opportunities when the current market price is higher than ‘Top central pivot’ (TC).
Let me elaborate. Assume a stock has rallied for a bit. The current market price is higher than the TC, and you are looking for an opportunity to set up a buy trade.
You can now wait till the stock arrests its rally and retraces back to the TC line.
I’ve highlighted a possible opportunity here –
From a price action perspective, when the current market price is higher than the TC, it indicates that the traders are willing to buy even though the average price is higher. Hence, it would help if you are looking for buying opportunities. Remember, when CMP is higher than TC, the TC now acts as a support line.
Likewise, when the stock or the index is trading lesser than the “Bottom Central Pivot’ (BC). When the current market price is less than that BC, it implies that there is bearishness in the market, hence look for selling opportunities.
Again, look for a price pull back to the BC line before initiating a fresh short.
You can even trade the stock while it is within the CPR. Trading while the stock price is within the CPR is like a range trade.
You buy when the stock is at BC, with TC as a target and sell (fresh short) when the stock is at the TC with an expectation that the price declines to BC soon.
Of course, I know many traders who prefer not to trade the range and prefer to trade only the pullbacks. I too would prefer to use CPR only to trade the pullbacks.
Lastly, here is something that you need to be aware of when trading the CPR.
When you plot the EOD CPR, the previous month’s OHLC is referenced.
Previous week’s OHLC is a reference when you plot CPR for 30mins and 1-hour candles.
Previous day’s OHLC is referenced when you plot CPR for 1, 3, 5, 10, and 15 minutes candles.
Happy trading.
Key Takeaways from this chapter
You can trade from the chart by selecting the trade button.
The trade button is a floating window which you can place anywhere on the chart.
The candle pattern helps identify the candlestick patterns, use this to reconfirm the pattern.
CPR helps you identify the S&R pattern
It is considered bullish if the current market price is higher than the TC line.
It is considered bearish if the current market price below the BC line. Gösterge

Apex Pivot & S/R Dynamics [Pineify]Apex Pivot & S/R Dynamics
This indicator maps structural support and resistance directly from confirmed pivot highs and lows, then tracks each level in real time until price decisively closes through it. Rather than drawing static zones at fixed intervals, every line is anchored to an actual swing point and extended bar by bar — the moment a close-based breach occurs, the line is deleted and a breakout label appears. The result is a chart that reflects only the levels that are still relevant right now.
Key Features
Pivot-confirmed S/R lines drawn at the exact bar where a swing high or low was established
Close-based breakout detection with a one-bar confirmation filter — no reaction to wicks alone
Automatic line removal on breach, keeping the chart free of invalidated levels
Configurable cap on active lines per side; oldest unbroken levels drop off when the limit is hit
Separate color controls for resistance, support, bullish breakout labels, and bearish breakout labels
How It Works
Pine's built-in ta.pivothigh() and ta.pivotlow() functions require price to form a local extreme confirmed by length bars on both sides. A pivot confirmed with length=15 means the indicator "sees" it 15 bars after it forms — and draws the line aligned back to that original swing bar. This lag is inherent to pivot detection and trades off responsiveness for confirmation quality.
Each confirmed pivot spawns a dashed horizontal line stored in a typed array alongside its exact price. Every subsequent bar, the loop iterates through active lines and extends them to the current bar. When a close-above-resistance or close-below-support transition occurs (previous close on the wrong side, current close on the right side), the breakout condition fires: the line is deleted from the array, an annotated label is placed, and the level is gone from the chart permanently.
Bars accumulate until a swing extreme is confirmed on both sides
A dashed line is created at the pivot price, extending right indefinitely
Each bar, the loop checks whether price has closed through each level
On breach: label placed, line deleted, level removed from active tracking
If unbroken levels exceed the configured cap, the oldest is silently removed
How the Components Work Together
The pivot detection sets the quality bar for which prices become levels — only price extremes that the market has already tested and respected on both sides qualify. The one-bar close confirmation then filters out wicks that pierce a level intrabar but don't follow through: a single candle that closes back inside the range doesn't trigger a breakout. Together, these two filters mean the breakout label fires on the first candle that suggests actual intent to move away from the level, not just noise around it.
The array-based memory management is what separates this from simpler implementations that draw lines and forget them. Because each line object is tracked with its price level, the indicator can cleanly unwind invalidated structure rather than letting stale lines accumulate across months of history.
Trading Ideas and Insights
On a retest setup: watch for price to pull back to a freshly broken resistance level (now acting as support) without triggering a new bearish breakout label — that silence is the confirmation
When multiple resistance lines cluster within a few ticks of each other, the zone represents confluent supply; a breakout label through that cluster carries more weight than a breach of an isolated swing
Use the breakout label count per session as a rough measure of trend strength — trending days tend to fire several same-direction labels in sequence, while ranging days flip back and forth
On higher timeframes (daily, weekly), the lines mark major structural zones; consider using a tighter lookback (8–10) on intraday charts where swing structure is denser
Past behavior at these levels does not guarantee future outcomes. S/R analysis works best when combined with volume, momentum, or broader context rather than used in isolation.
Unique Aspects
Lines are anchored to their originating pivot bar visually — the small triangle marker shows exactly which candle created each level, so you can assess the quality of the original swing without scrolling back
Close-based breakout confirmation with a prior-bar check is more conservative than most pivot S/R scripts, which often fire on any penetration regardless of close location
The self-cleaning design — lines disappear when breached and oldest lines drop when the cap is hit — makes the chart readable across all timeframes without manual cleanup
How to Use
Add to any chart; the indicator overlays directly on price with no separate pane
Adjust "Pivot Lookback" to match your timeframe — higher values (20–30) on daily charts identify major structure; lower values (5–10) on intraday charts capture faster swings
Red dashed lines are active resistance levels; green dashed lines are active support levels
A blue "B" label above a bar signals a bullish breakout through resistance; an orange "B" below signals a bearish breakdown through support
If the chart becomes crowded, lower "Max Active Lines" to keep only the most recent unbroken levels visible
Customization
Pivot Lookback (default: 15) — Controls how many bars on each side must be lower/higher to confirm a pivot. Increasing this confirms stronger, less frequent levels; decreasing it produces more levels with earlier detection but more sensitivity to minor swings.
Highlight Breakouts (default: on) — Toggles the breakout labels. Turn off if you only want the S/R lines without annotation.
Max Active Lines (default: 15) — Caps the number of lines per side. On instruments with very dense swing structure or long histories, reducing this to 8–10 keeps the chart uncluttered.
Line and Label Colors — Four separate color inputs for resistance lines, support lines, bullish breakout labels, and bearish breakout labels. Adjust to match your chart theme.
Conclusion
Apex Pivot & S/R Dynamics automates the manual process of marking swing highs and lows, extending them forward, and cleaning them up when they are no longer valid. The close-based breakout filter and automatic array management mean the chart reflects current market structure rather than accumulated history. Traders focused on price action and structural levels — particularly those who trade retests and breakout continuations — will find this a practical alternative to manually drawn S/R zones.
Gösterge

Gösterge

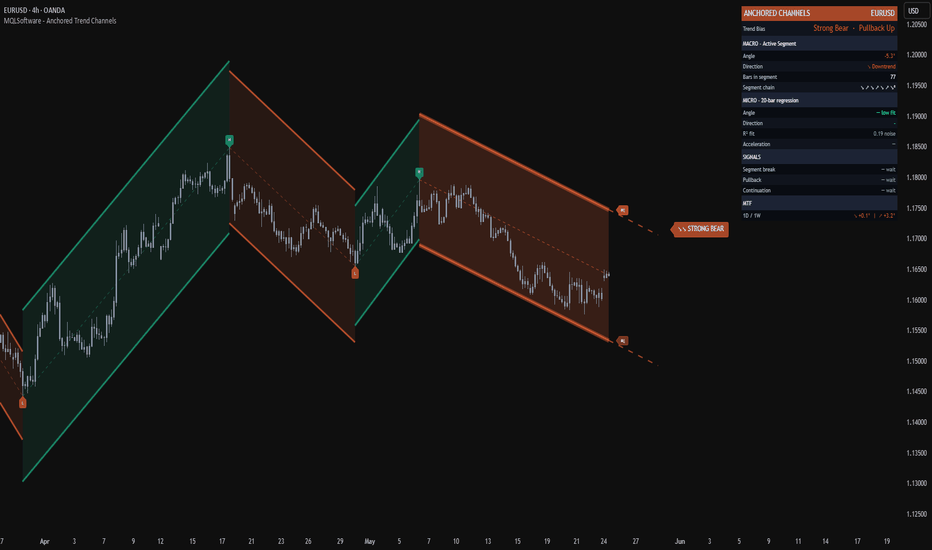
Anchored Trend Channels [MQLSoftware]Anchored Trend Channels is a structural overlay that maps each phase of price action between confirmed swing points as its own parallel trend channel. Instead of fitting one curve or band to all of price history, it breaks the chart into discrete pivot-to-pivot segments and renders each one as a self-contained anchored channel with its own slope, width, and angle. The active channel projects forward with a dashed extension so future support and resistance levels are visible at a glance.
A second, finer regression channel (Micro) lives inside the currently forming Macro segment to show local momentum and its relationship to the broader trend. A compact right-side panel reads off the resulting structure, the active segment angle, the segment chain, multi-timeframe context, and three optional structural events.
This is a visual analytical tool intended for chart reading and structure mapping. It does not execute trades and does not provide financial advice.
Key Features
Pivot-anchored Macro channels that segment price action into discrete trend phases (one channel per phase, anchored on confirmed swing pivots)
Active segment with a forward-extending dashed projection of about 20 bars, showing where the channel boundaries would lie if the trend continues
Adaptive Micro regression channel inside the active segment, with R-squared fit quality readout
Trend Bias scoring weighted by segment length and angle, combined with net price move across the analysis window
Acceleration metric showing how much the Micro angle deviates from the Macro angle (faster, slower, or flat)
Right-side panel with Macro angle, segment chain visualization, Micro R-squared, MTF context, and three structural signal states
Non-Repaint Mode toggle for users who prefer closed-bar-only updates on the active segment
Three optional structural event markers (Segment Break, Macro Pullback, Micro Continuation) with a configurable cooldown to avoid clustering
Core Concept
Most channel and trend indicators on TradingView take one of two approaches. They either fit a single continuous curve to all of price (linear regression channels, ATR-trailing bands, smoothed moving averages with deviation bands) or they detect individual trendlines through two pivots and project them indefinitely. Both approaches have known limitations. A single continuous channel cannot describe a market that has clearly changed phase. Two-pivot trendlines drift, get broken, and need constant manual maintenance.
This indicator builds on a third approach: piecewise channels anchored on confirmed pivots. Each finished segment is a closed, immutable object that describes one phase of price action between two opposite swing points. The chain of segments left behind is a structural history of how the trend developed, where it accelerated, where it reversed.
The indicator adds three specific algorithmic elements on top of that base.
1. Quality Filters at Segment Birth. Before a new segment is committed, two filters check that the pivot move is structurally meaningful. The pivot-to-pivot price distance must exceed a configurable ATR multiple (default 2.5x), and the bar count must exceed a minimum length (default 8 bars). Pivots that fail either check are skipped, so the visible chain reflects real phase changes, not noise.
2. Pivot-Anchored Geometry with Max-Deviation Width. Each segment's basis line is the straight line between its two anchor pivots. The channel half-width is the maximum deviation of any bar inside the segment from that basis line, scaled by a user multiplier and floored by an ATR-based minimum. This produces channels that visibly contain the price action that built them, rather than mathematical fits that ignore visible swings.
3. Trend Bias from Weighted Segments Plus Net Move. Most chain-based indicators classify direction by counting up-segments versus down-segments. That gives equal weight to a 30-bar trending move and a 5-bar choppy retracement. This indicator weights each segment by the product of its bar count and its absolute angle, then combines that with the net price move across the analysis window measured in ATR units. The result is a Trend Bias label (Strong Bull, Bullish, Mixed, Bearish, Strong Bear) that reflects which side has accumulated the actual structural progress, not just the count of segments.
Anatomy of the Display
Historical segments are drawn as parallel green or coral channels between confirmed past pivots. They are immutable once committed and form a left-to-right chain that visually traces the structure of the trend.
The active segment is the right-most channel, drawn in bright color with a wider glow layer. It anchors on the most recent confirmed pivot and extends to the current bar. The dashed projection continues the channel about 20 bars to the right at the current slope, so users see where price would touch the upper and lower boundaries if the segment kept its angle.
The Micro channel is a 20-bar linear regression with standard-deviation bands, rendered in cyan or pink depending on its own direction. It only appears when the regression's R-squared fit quality clears a user threshold, so it auto-hides when local price action is too noisy for a meaningful regression.
H and L pivot markers sit at the pivot anchor points. H labels mark confirmed high pivots, L labels mark confirmed low pivots.
The right-side panel groups the data into Trend Bias (top), Macro Active Segment (angle, direction, bars in segment, segment chain), Micro Channel (angle, direction, R-squared, acceleration), Signals (three states), and MTF (current angle of two higher timeframes).
Acceleration in the panel is the Micro angle minus the Macro angle. A positive number means the local momentum is steeper than the surrounding trend phase (often early-stage continuation). A negative number means the local momentum is flattening relative to the surrounding trend phase (often late-stage or stalling).
Optional Structural Event Markers
Three structural events can be displayed as on-chart markers. These describe what is happening to the channel geometry. They are not trade entries.
Segment Break (BRK). Price closes beyond the opposite boundary of the active segment. In an active uptrend channel, this is a close below the lower boundary. In a downtrend channel, a close above the upper boundary. This marks a violation of the active phase structure.
Macro Pullback (PB). Price closes within 0.2 ATR of the band on the same side as the trend direction. In an uptrend, price closes near the lower boundary. In a downtrend, price closes near the upper boundary. This marks a touch back to the channel boundary in the direction of the active phase.
Micro Continuation (CONT). The Micro channel breaks its own boundary in the same direction as the Macro segment, while the segment is still in its early stage (3 to 25 bars in). This marks a moment when local momentum aligns with the broader trend phase early in its life.
All three event types are gated by a configurable cooldown (default 15 bars) to prevent clustering. Each event is computed on closed bars only.
Multi-Timeframe Panel Row
The MTF row at the bottom of the panel shows the active segment angle on two higher timeframes. The two HTFs are selected automatically from the standard timeframe ladder based on the current chart timeframe. For example, on a 15m chart the panel reads 4H and 1D. On a 1H chart it reads 1D and 1W. HTF values are read with `lookahead=barmerge.lookahead_off` and a one-bar offset, which is the standard non-repainting pattern for higher-timeframe reads.
Notes on Repainting
Historical segments do not repaint. They are built from confirmed pivots (`ta.pivothigh` and `ta.pivotlow` with a right-bars parameter). A pivot is only confirmed several bars after it forms, so historical segments remain anchored in place forever once committed.
The active segment updates as new bars print. With Non-Repaint Mode ON (default), it recalculates only on closed bars, so its boundaries remain stable intra-bar. With Non-Repaint Mode OFF, it updates on every tick for users who prefer maximum responsiveness and accept the visual jitter.
Pivot detection has an inherent delay equal to the pivot lookback (default 30 bars on Very Long sensitivity). A pivot becomes visible after that many bars have closed past it. This is a property of all pivot-based indicators, not a flaw specific to this script.
All signal markers and alerts are gated by `barstate.isconfirmed`. They fire exactly once per closed bar and never intra-bar.
MTF panel data uses `lookahead=barmerge.lookahead_off` with a one-bar offset on every series, which is the canonical non-repainting pattern for higher-timeframe context.
Typical Analysis Workflow
A common analytical workflow may include:
Reading the Trend Bias label and color in the panel header to anchor an overall directional view
Checking the segment chain in the panel against the visible historical channels on the chart to confirm structure is consistent
Watching the active segment's dashed projection to identify forward levels where the channel boundaries are heading
Comparing the Micro channel direction and angle against the Macro segment direction and angle (Acceleration row) to read whether local momentum aligns with the broader phase
Cross-checking the MTF row to see whether higher timeframes are in the same structural direction or in conflict
Treating Segment Break, Macro Pullback, and Micro Continuation markers as structural events for context, then combining that read with other forms of analysis and risk management
Configuration
Pivot Sensitivity - Short (5), Medium (10), Long (18), or Very Long (30). Lower values produce more segments of shorter average length. Higher values produce fewer, longer-lived segments. Very Long is the default and produces the cleanest premium look.
Min Segment Size (x ATR) - Minimum price distance between consecutive pivots, measured in ATR. Pivots below this threshold are skipped. Higher values produce fewer, more significant segments.
Min Segment Length (bars) - Minimum bar count between consecutive pivots. Short segments are skipped.
Channel Width Multiplier - Multiplier on the max-deviation width. 1.0 means the channel just contains the price action that built it. 1.2 to 1.5 adds visible breathing room.
Min Band Width (x ATR) - Floor on the channel half-width. Prevents razor-thin channels on short segments where deviation is small.
Max Segments Stored - FIFO cap on historical segments (default 15). Older segments are removed as new ones form.
Regression Length (Micro) - Number of bars in the Micro regression window (default 20).
Std Dev Multiplier (Micro) - Width of the Micro band in standard deviations.
Min R-squared to Show (Micro) - Hides the Micro channel when regression fit quality is below this threshold.
Signal Cooldown (bars) - Minimum bars between consecutive same-type signal markers.
Non-Repaint Mode - When ON (default), the active channel uses closed-bar data only. When OFF, it updates live with each tick.
Show toggles - Macro segments, Micro channel, panel, status badge, endpoint labels, pivot markers, signal markers, basis lines, channel fills, MTF row.
Markets and Timeframes
The indicator can be applied across multiple markets and timeframes:
Forex
Stocks and Indices
Commodities
Cryptocurrencies
Because slope is ATR-normalized and channel width is ATR-floored, the visual behavior remains consistent across instruments and timeframes. The Pivot Sensitivity preset can be tuned per chart for the cleanest read on a given symbol and timeframe.
Alerts
Three alert conditions are available:
Segment Direction Changed - fires when the active segment direction flips between uptrend and downtrend
Segment Break - fires when price closes beyond the opposite boundary of the active segment
Micro Continuation - fires when the Micro channel breaks its own boundary in the same direction as the active Macro segment, in the early portion of the segment
All alerts evaluate on confirmed bars to avoid intra-bar oscillation. Gösterge
Confluence FlowConfluence Flow — A multi-layer confluence system combining EVWAP, Adaptive Pivots, Impulse Council & Smart Candles
Confluence Flow unifies five analytical layers — Regime, Momentum, Structure, Pattern, and Confidence — into one powerful overlay. Instead of scattered signals, you get a coherent market narrative through intelligent candle coloring, adaptive levels, and a clean dashboard.
─────────────────────────────────────────────
EVWAP (Exponential Volume Weighted Average Price)
─────────────────────────────────────────────
The heart of the regime filter. This EVWAP dynamically anchors to the most recent significant swing high or low and uses an adaptive half-life that responds to market volatility. Fast markets = faster reaction. Quiet markets = smoother response.
Includes ±1σ and ±2σ bands that clearly show fair value, premium/discount zones, and statistical extremes.
─────────────────────────────────────────────
Adaptive Pivots (S9)
─────────────────────────────────────────────
A next-level dynamic support/resistance system. Band width adapts intelligently using a Trend Quality Index (TQI) based on efficiency, volume, structure, and momentum alignment. High-quality trends get tighter bands. Chop gets wider bands to reduce whipsaws.
─────────────────────────────────────────────
Impulse Council (4-School Voting)
─────────────────────────────────────────────
Four independent schools vote on momentum:
• OBV Flow & Divergence
• Volume Delta (VWMA)
• Wyckoff Springs & Upthrusts
• EMA Confluence (9/21 + 55 filter)
Minimum 2 agreeing schools required for a valid signal.
─────────────────────────────────────────────
Smart Candles
─────────────────────────────────────────────
Candles are colored on a gradient from deep maroon (strong bear) to bright cyan (strong bull) based on the composite bias. Both body and wicks adapt, giving instant visual conviction.
─────────────────────────────────────────────
Pattern Recognition & High-Confidence RR Boxes
─────────────────────────────────────────────
Detects 20 classical patterns with strength scoring and regime alignment filtering. Patterns that conflict with the prevailing regime are automatically dimmed on the chart — keeping your focus on high-probability setups and filtering out counter-trend noise. When a strong pattern aligns with high TQI, strong displacement, and volume — a ★ High Confidence signal triggers automatic 1:2 RR boxes with smart stop placement.
─────────────────────────────────────────────
Dashboard
─────────────────────────────────────────────
Real-time overview of Bias, Council votes, S9 trend, EVWAP direction, and SMA trend.
─────────────────────────────────────────────
Best Used As
─────────────────────────────────────────────
A powerful confluence tool for day traders and swing traders on 5min to 4H timeframes. The strongest setups occur when EVWAP, S9, Council, and Smart Candle bias all align.
Settings default to "Patterns Only" so you can add it without changing your chart's original candle look — toggle to "Candles + Patterns" to enable the full Smart Candle gradient coloring. Gösterge

Gösterge

Gösterge

Gösterge

Gösterge

Gösterge

Gösterge

Gösterge