Gösterge
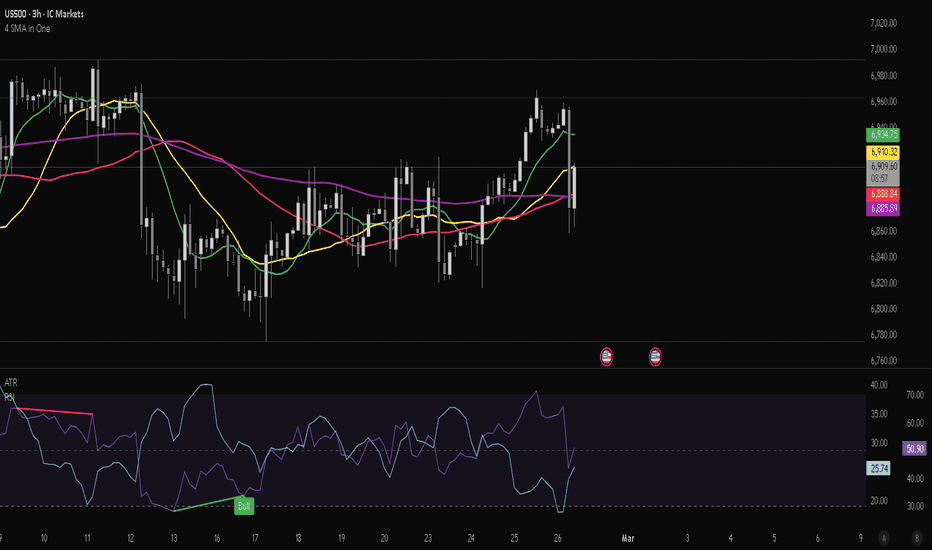
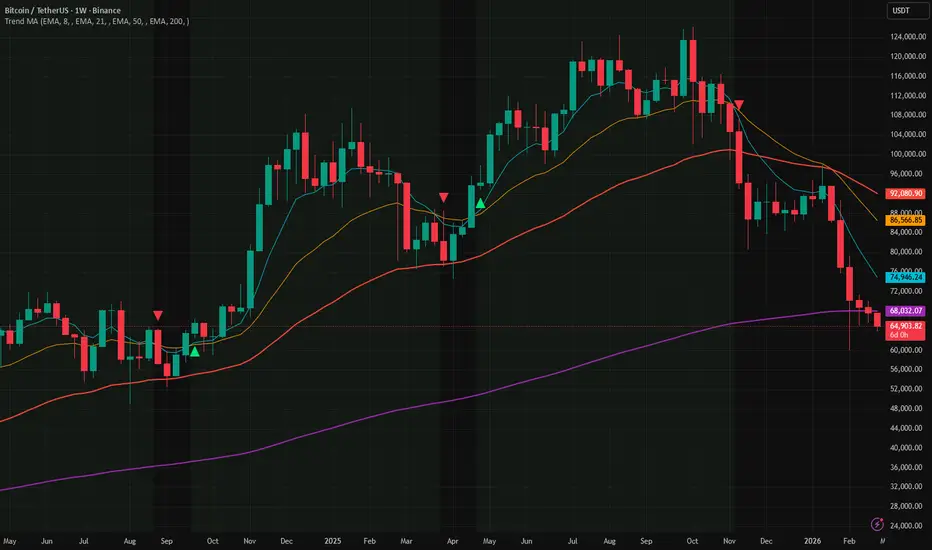
Trend Alignment Ribbon - Multi Timeframe Moving AveragesTrack trend direction across multiple timeframes — all in one view.
Trend trading works best when the short, medium, and long-term views all agree. This indicator places four moving averages on your chart simultaneously and highlights the moment they fall into full alignment — giving you a simple, visual confirmation that a trend is in control.
──── What You're Looking At ────
Four smooth lines on your chart, each tracking price at a different speed:
MA1 (fastest, default: 8 bars) — reacts quickly to price. The first line to turn when momentum shifts.
MA2 (default: 21 bars) — short-to-intermediate direction. Confirms or challenges what MA1 is saying.
MA3 (default: 50 bars) — the medium-term trend backbone. Widely watched by institutions.
MA4 (slowest, default: 200 bars) — the long-term trend anchor. The most important line on most charts.
──── How to Read It ────
Green background — all four lines are stacked in order, fastest on top. The trend is strongly up. High-confidence environment for long trades.
Red background — all four lines are stacked in reverse order. The trend is strongly down. High-confidence environment for short trades.
No background — the lines are tangled or out of order. The market is ranging or in transition. Reduce risk or wait for clarity.
Triangle up ▲ below a candle — the fast line just crossed above the medium line. Early momentum shift to the upside.
Triangle down ▼ above a candle — the fast line just crossed below the medium line. Early momentum shift to the downside.
──── Multi-Timeframe Mode ────
Each of the four lines can be pinned to a different timeframe , independent of the chart you are on. For example, while viewing a 15-minute chart you can display the 200-bar average as it appears on the daily chart — so the big picture is always visible.
Leave the Timeframe field blank to use the current chart's timeframe (default behaviour).
──── Settings ────
Each moving average has its own settings group (Moving Average 1–4):
Show — toggle each line on or off independently.
Type — choose between four calculation methods:
EMA (Exponential) — reacts faster to recent price. Most commonly used. Default.
SMA (Simple) — a plain average of all bars. Slower to react, widely respected by institutions.
WMA (Weighted) — middle ground, heavier weight on recent bars.
HMA (Hull) — very fast and smooth. Minimises lag while reducing noise.
Length — how many bars are included in the average. Higher number = slower, smoother line.
Timeframe — leave blank for the current chart. Enter 1D for daily, 1W for weekly, 4H for four-hour, etc.
Color — fully customisable per line.
Under Visuals :
Ribbon Fill — fills the space between MA1 and MA4 with a transparent green or red shade. Useful for seeing trend strength at a glance.
Alignment Background — highlights the chart background when all 4 lines agree on direction. On by default.
Cross Signals — places small triangle markers on the chart when MA1 and MA2 cross. On by default.
──── Alerts ────
MA Bull Cross — the fast line crossed above the medium line
MA Bear Cross — the fast line crossed below the medium line
Full Bull Alignment — all 4 lines just entered bullish order for the first time
Full Bear Alignment — all 4 lines just entered bearish order for the first time
──── Tips ────
Set an alert for Full Alignment — these moments often mark the start of the strongest, cleanest trend moves on any instrument.
A cross signal that fires while the alignment background is already lit is a higher-confidence entry than a cross signal in a mixed or choppy environment.
A "tight stack" of closely spaced lines means the trend is young and orderly. Wide spacing with tangled lines means the market is extended or breaking down — not an ideal entry point.
On intraday charts, try pinning MA3 or MA4 to the daily timeframe. This keeps your long-term bias anchored without switching charts.
All timeframe calculations use confirmed (closed) bars only — there is no repainting.
Gösterge

Gösterge

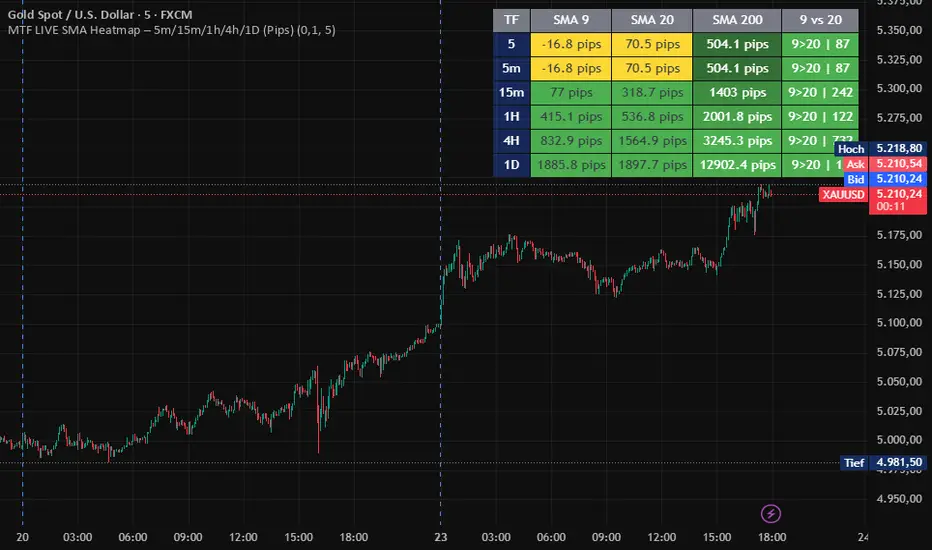
MTF LIVE SMA Heatmap This tool displays a multi‑timeframe heatmap for SMA 9, SMA 20, and SMA 200.
It combines trend direction, pip distance, and market structure in a compact table.
Features
Pip distance between price and SMA (automatically calculated for each symbol)
Yellow highlight when price is between SMA 9 and SMA 20
Green when price is above both SMAs
Red when price is below both SMAs
SMA‑200 heatmap based on percentage distance (with neutral zone)
Trend comparison 9 vs 20 (9>20, 20>9, or neutral)
Additional row for the current timeframe
Supports Forex, Gold, Silver, Indices, Crypto, and Energies
Pip Engine
A universal pip engine automatically detects the correct pip size for each symbol
(e.g., XAU = 0.10, XAG = 0.01, BTC = 1.0, EURUSD = 0.0001, etc.).
Use Cases
Perfect for:
Trend filtering
Multi‑TF confirmation
Scalping / intraday trading
Identifying transition zones (yellow area)
SMA cluster analysis
9to20 Pip Distance Gösterge

Pivot Pro - CPR PDH/PDL EMA by Sani═══════════════════════════════════════════════
PIVOT POINTS PRO — CPR + PDH/PDL + EMA
Full Historical | No Repaint | All Customizable
═══════════════════════════════════════════════
A professional all-in-one indicator combining the
Standard Pivot Point system with CPR (Central Pivot Range),
Previous Day High/Low, and dual EMAs — all non-repainting,
fully customizable per level, and drawn across complete
chart history.
━━━━━━━━━━━━━━━━━━━━━━━━━━━━━━━━━━━━━━━━━━━━
🔷 PIVOT POINTS
━━━━━━━━━━━━━━━━━━━━━━━━━━━━━━━━━━━━━━━━━━━━
- Supports all 6 types: Traditional, Fibonacci,
Woodie, Classic, DM, Camarilla
- Timeframe anchoring: Auto, Daily, Weekly, Monthly,
Quarterly, Yearly, and multi-year periods
- Every level (P, R1–R5, S1–S5) has its own
independent Color, Line Style, and Line Width
- Lines extend to the right edge of the chart
- Historical pivot count controlled by "Number of Pivots Back"
━━━━━━━━━━━━━━━━━━━━━━━━━━━━━━━━━━━━━━━━━━━━
🔶 CPR — CENTRAL PIVOT RANGE
━━━━━━━━━━━━━━━━━━━━━━━━━━━━━━━━━━━━━━━━━━━━
- Calculated from previous day OHLC (non-repainting)
- Draws CPR Pivot, BC (Bottom Central), TC (Top Central)
- Visible across ALL historical sessions — not just today
- Each line has its own Color, Style (Solid/Dashed/Dotted),
and Width
- Current session extends to right edge automatically
━━━━━━━━━━━━━━━━━━━━━━━━━━━━━━━━━━━━━━━━━━━━
🔹 PDH / PDL — PREVIOUS DAY HIGH & LOW
━━━━━━━━━━━━━━━━━━━━━━━━━━━━━━━━━━━━━━━━━━━━
- Previous day High and Low plotted per session
- Full chart history — every completed day visible
- Independent Show/Hide, Color, Style, and Width
for PDH and PDL separately
- Current session extends to right edge automatically
━━━━━━━━━━━━━━━━━━━━━━━━━━━━━━━━━━━━━━━━━━━━
📈 EMA — FAST & SLOW WITH TREND COLORING
━━━━━━━━━━━━━━━━━━━━━━━━━━━━━━━━━━━━━━━━━━━━
- Dual EMA (default 10 / 20) with dynamic color:
→ Green when Fast > Slow (bullish)
→ Red when Fast < Slow (bearish)
→ Yellow when flat
- Optional EMA Band background highlight (purple)
when price is between the two EMAs
- EMA Touch + 2-Candle confirmation alerts included
━━━━━━━━━━━━━━━━━━━━━━━━━━━━━━━━━━━━━━━━━━━━
⚙️ SETTINGS OVERVIEW
━━━━━━━━━━━━━━━━━━━━━━━━━━━━━━━━━━━━━━━━━━━━
- Pivot Type & Timeframe
- Labels: Show/Hide, position (Left or Right), prices
- Per-level: P, R1–R5, S1–S5 — Color, Style, Width
- CPR: Master toggle + individual Pivot / BC / TC controls
- PDH/PDL: Master toggle + individual PDH / PDL controls
- EMA: Lengths, Width, Band background
━━━━━━━━━━━━━━━━━━━━━━━━━━━━━━━━━━━━━━━━━━━━
🛡️ NO REPAINT
━━━━━━━━━━━━━━━━━━━━━━━━━━━━━━━━━━━━━━━━━━━━
All values fetched using:
request.security(..., lookahead=barmerge.lookahead_on)
with shift on daily OHLC — values are locked to
the previous completed day and never change on the
current bar.
━━━━━━━━━━━━━━━━━━━━━━━━━━━━━━━━━━━━━━━━━━━━
📌 BEST USED ON
━━━━━━━━━━━━━━━━━━━━━━━━━━━━━━━━━━━━━━━━━━━━
Intraday timeframes: 1m, 3m, 5m, 15m, 30m, 1H
Works on any market: Stocks, Forex, Crypto, Futures
━━━━━━━━━━━━━━━━━━━━━━━━━━━━━━━━━━━━━━━━━━━━
🔔 BUILT-IN ALERTS
━━━━━━━━━━━━━━━━━━━━━━━━━━━━━━━━━━━━━━━━━━━━
- EMA Bullish Cross
- EMA Bearish Cross
- Price Touched PDH
- Price Touched PDL
- Price Near CPR Pivot Gösterge

High Volatility EMA Extension Bands
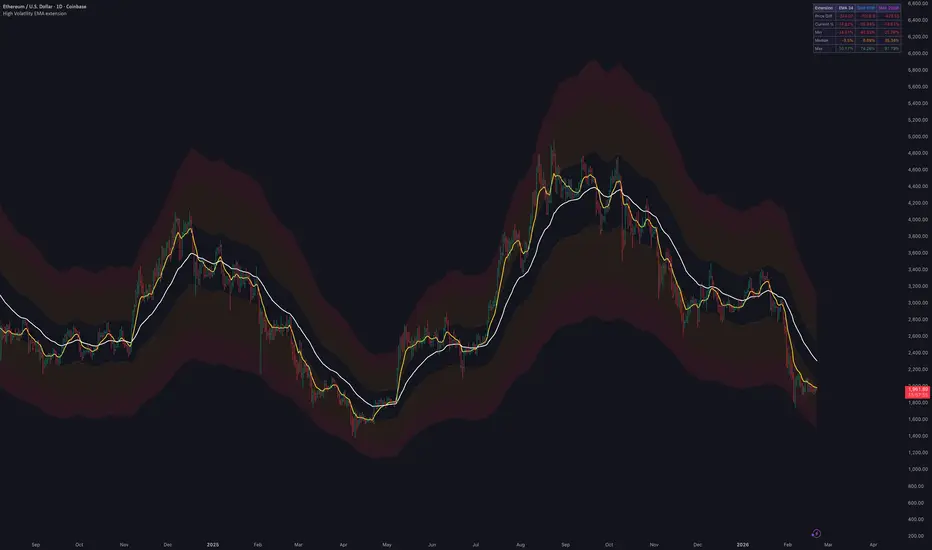
An EMA-based trend indicator with extension bands and statistical tracking for higher-volatility assets.
What it shows:
8 EMA (yellow) and 34 EMA (white) lines
Three extension bands at 10%, 25%, and 35% above and below the 34 EMA
Color-coded zones: green (10%), amber (25%), red (35%)
Extension statistics table showing current %, price difference, min/max/median values for EMA 34, 50-week SMA, and 200-week SMA
Settings:
Adjustable EMA lengths (default: 8 and 34)
Customizable extension percentages (default: 10%, 25%, 35%)
Toggle extension bands on/off
Toggle statistics table on/off
Gösterge

Low Volatility EMA Extension Bands
An EMA-based trend indicator with tight extension bands and statistical tracking for lower-volatility assets.
What it shows:
8 EMA (yellow) and 34 EMA (white) lines
Three extension bands at 10%, 15%, and 20% above and below the 34 EMA
Color-coded zones: green (10%), amber (15%), red (20%)
Extension statistics table showing current %, price difference, min/max/median values for EMA 34, 50-week SMA, and 200-week SMA
Settings:
Adjustable EMA lengths (default: 8 and 34)
Customizable extension percentages (default: 10%, 15%, 20%)
Toggle extension bands on/off
Toggle statistics table on/off
Gösterge

Custom EMA SMA Ribbon
Indicator name and purpose
Custom EMA SMA Ribbon is a six-layer moving average ribbon built to show trend alignment, momentum structure, and signal readiness in a single glance. Rather than relying on one crossover, it renders a stacked relationship between fast, medium, and slow averages so the trend context is visible without extra indicators. The purpose is to make trend direction, trend stability, and momentum alignment readable at a glance, while also providing filtered entry signals and a visual status matrix that summarizes the current bias against each moving average.
Long set up
Short set up
Mixed scenario
What it does
Each moving average layer is colored based on whether it is above or below the next slower layer. When the ribbon is stacked with fast lines above slow lines, the structure is bullish. When fast lines fall below the slower lines, the structure is bearish. This layered coloring reveals whether the trend is cleanly aligned or mixed. The script also highlights full alignment, where all fast layers sit above or below the slowest line, which is usually the most stable trend condition. In addition to the visual ribbon, it generates trend-filtered signals: a bullish signal appears only when the slow ribbon is aligned bullish and MA1 crosses above MA2, while a bearish signal appears only when the slow ribbon is aligned bearish and MA1 crosses below MA2. A signal status matrix in the chart corner shows whether price is above or below each moving average, giving a compact snapshot of current bias without scanning every line.
How it works in detail
The indicator calculates six moving averages from a single price source. You can use EMA for a more responsive ribbon or SMA for a smoother ribbon that reduces noise. Each line’s color is determined by its position relative to the next slower line, building a visible map of internal trend health. The slowest line acts as the anchor. If all faster lines remain above it, the ribbon is fully bullish. If all faster lines remain below it, the ribbon is fully bearish. The trend-filtered signals add a momentum layer: they require a clean macro stack first, then confirm entry with the fast crossover of MA1 and MA2. Signals are plotted as tiny circles, so they do not clutter the chart. Bullish signals plot at the bottom in green, bearish signals plot at the top in red. Optional background shading emphasizes the full alignment zones, and all signal states can be confirmed on bar close with the non-repainting toggle. The signal status matrix is updated on the last bar and labels each MA as LONG or SHORT depending on whether the current close is above or below that line, allowing quick context checks during live monitoring.
Default settings
The default lengths 10, 20, 50, 100, 150, and 200 create a balanced mix of short-term, mid-term, and long-term context. The 10 and 20 lengths capture fast swings and early shifts. The 50 and 100 lengths reflect the core trend structure. The 150 and 200 lengths anchor the ribbon to the broader market bias. This combination makes it easy to see if short-term momentum is moving with the larger trend or if it is fighting it. EMA is selected by default to keep the ribbon responsive enough for intraday and swing traders, but you can switch to SMA for smoother, slower trend mapping. With the default configuration, the signal logic is naturally conservative because the faster cross must occur only after MA3, MA4, MA5, and MA6 are stacked in the same direction, filtering many counter-trend crosses. The matrix defaults to the bottom right so it stays visible without covering price action, but you can move it to any corner or center position.
How to use it on charts
Use the ribbon as a trend filter first. When most lines are green and stacked in order, the trend is bullish and pullbacks can be treated as potential continuation zones. When most lines are red and stacked downward, rallies can be treated as corrective unless the stack flips. The strongest trend environments occur when the ribbon is fully aligned above or below the slowest line. If the ribbon becomes mixed with alternating colors, that signals transition or consolidation and signals should be treated more cautiously. In those mixed states, ignore the MA1/MA2 crosses because the macro alignment filter will not allow signals, which is intentional to reduce noise. The matrix helps confirm whether price is holding above multiple layers during a bullish trend or below multiple layers during a bearish trend, which can support trade management decisions like scaling in or tightening stops.
Signal logic explained
Bullish signal requirements: MA3 above MA4, MA4 above MA5, and MA5 above MA6 must all be true, confirming a clean bullish macro stack. Once that macro alignment exists, a bullish signal is generated when MA1 crosses above MA2. This is the earliest momentum entry that still respects the larger trend. Bearish signal requirements: MA3 below MA4, MA4 below MA5, and MA5 below MA6 must all be true. Once that macro alignment exists, a bearish signal is generated when MA1 crosses below MA2. This ensures the momentum entry is taken only in the direction of the larger ribbon stack. Signals appear as tiny circles to keep the chart clean: white at the bottom for bullish signals, black at the top for bearish signals. The matrix adds a second layer of confirmation by showing whether the close remains above each MA during a bullish signal or below each MA during a bearish signal.
Practical usage examples
Trend continuation example: price rises, the ribbon is fully bullish, and fast lines stay above the slowest line during pullbacks. When MA1 crosses back above MA2 after a shallow pullback, the green circle appears at the bottom, indicating a momentum continuation aligned with the macro structure. If the matrix also shows LONG across most rows, it confirms that price remains above the key layers. Trend reversal example: the ribbon compresses, fast lines cross down, and the full alignment flips bearish after several mixed states. Once MA3 to MA6 are stacked bearish, the red top circle appears when MA1 crosses below MA2, signaling the first momentum entry in the new trend direction. If the matrix shifts to SHORT across multiple rows, it confirms the shift in control.
All Long signals on matrix
Mixed signals on matrix
How the components work together
The layered coloring shows immediate, mid, and macro alignment in one view. The full alignment state acts as a high confidence filter for trend bias. Optional background shading gives a quick visual signal of those high confidence zones. The trend-filtered MA1/MA2 cross signals provide a concise momentum trigger that only fires when the broader ribbon is aligned. The signal status matrix summarizes price position versus each MA, helping traders quickly gauge whether momentum entries are supported by broader structure. Together these components provide a complete trend map, entry framework, and state dashboard without overloading the chart.
What makes this script original
This ribbon is not a simple fast slow crossover. Each layer is colored relative to its adjacent layer, which exposes the internal order of the ribbon and the health of the trend rather than only the outer edges. The macro alignment filter combined with a fast crossover creates a structured momentum signal that is stricter than most ribbons, helping avoid counter trend entries. The added status matrix provides a compact decision aid that shows whether price is above or below each layer in real time, which most ribbons do not include. The non-repainting toggle ensures the behavior is consistent between historical and live data. The indicator focuses on structural clarity and disciplined signals rather than generic crossover spam.
Markets, timeframes, and trading styles
This indicator is suitable for any liquid market including Forex, Crypto, Stocks, Commodities, and Indices. For scalping on 1m to 5m charts, keep lengths shorter or use EMA to maintain responsiveness, and focus on quick momentum continuation after macro alignment while using the matrix to confirm price remains above the faster layers. For day trading on 5m to 1H charts, the default lengths provide a balanced view of trend and pullback structure. For swing trading on 1H to daily charts, the default lengths remain effective and reduce noise. For position trading or investing on weekly charts, consider increasing all lengths proportionally to match the longer holding horizon and only take signals that align with the macro stack and matrix bias.
Settings guidance
Shorter lengths create faster signals but more noise; longer lengths create smoother signals but more lag. EMA reacts faster and suits active styles, while SMA smooths the ribbon for broader trend interpretation. Line styles and thickness controls let you emphasize the layers you care about most. Background shading is best kept subtle to preserve chart readability and should be used primarily to highlight full alignment states. Signal markers can be toggled off if you want a purely visual ribbon without entries. The matrix position can be moved to any corner or center area of the chart to avoid overlapping price action or other annotations.
Alerts
The script includes alerts for full bullish alignment, full bearish alignment, fast crosses between MA1 and MA2, and the trend-filtered bullish and bearish cross signals. All alerts respect the non-repainting toggle, so they fire on confirmed bars only when that option is enabled. Messages include symbol, timeframe, and price placeholders for automation or logging.
Non-repainting behavior
When non-repainting mode is enabled, all signal conditions and background states are confirmed on closed bars. This avoids signals appearing and disappearing mid bar and ensures live behavior mirrors historical behavior. Disabling the toggle makes the ribbon update in real time but signals should be treated as provisional until the bar closes.
Disclaimer
This indicator is a technical analysis tool and does not constitute financial advice. Always test settings on your chosen market and timeframe, use risk management, and confirm signals with additional context. No indicator is perfect; use this ribbon as one component of a broader trading plan.
Gösterge

Gösterge

Strateji

Gösterge
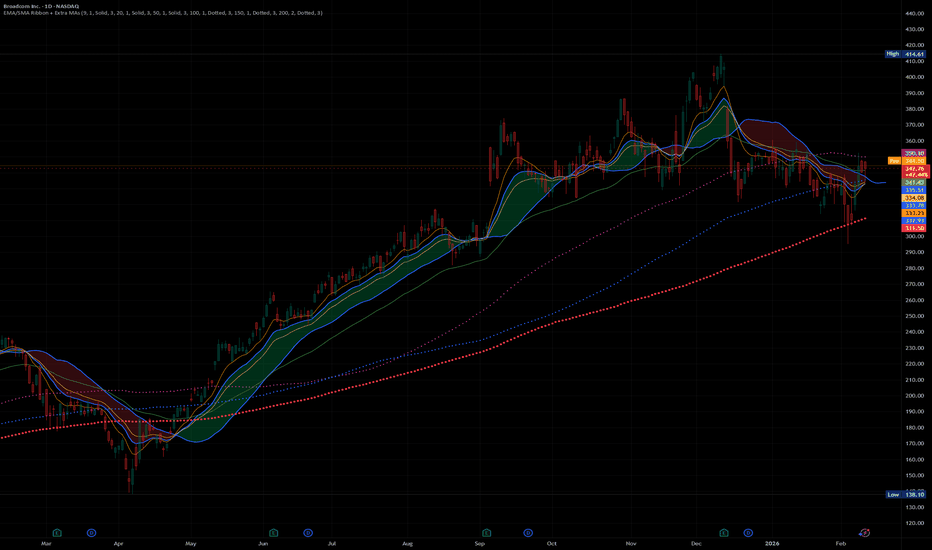
MTF 9 SMA of High (W/M/3M/6M/Year)MTF SMA is a powerful multi‑timeframe indicator that plots higher‑timeframe Simple Moving Averages (SMA) on any lower timeframe chart.
It helps traders clearly identify higher‑timeframe trend, dynamic resistance, and support levels without switching charts.
This indicator is especially useful for intraday and swing traders who want higher‑timeframe context while trading on lower timeframes.
✅ Key Features
📐 Multi‑Timeframe SMA Plotting
Default timeframes:
Weekly
Monthly
3‑Monthly
6‑Monthly
Yearly (12M)
Plus 2 additional custom timeframe placeholders
All SMAs are visible on any chart timeframe (1m, 5m, 1H, Daily, etc.)
🎯 Source Selection (Dropdown)
Choose one common source for all SMAs:
High
Close
Open
Low
This makes the indicator flexible for different trading styles:
High → resistance mapping
Low → support mapping
Close → trend confirmation
Open → session bias analysis
🏷️ Smart Labels (Optional)
Enable/disable labels per timeframe
Labels show:
Timeframe
SMA length
Optional live SMA value
Labels update only on the last bar (clean & clutter‑free)
Automatic vertical offset to avoid overlap
🎛️ Full Customization
Show / hide each SMA line individually
Custom colors and line width
Label position offset (right side)
Works seamlessly on all instruments (Equities, Indices, Crypto, Forex)
🧠 How to Use
Use Weekly / Monthly SMAs as major trend direction
Watch for price reaction near HTF SMAs on lower timeframes
Combine with:
Breakouts
Pullbacks
VWAP / RSI / Price Action
Ideal for top‑down analysis
⚙️ Technical Notes
Built using Pine Script v6
Uses request.security() for accurate higher‑timeframe values
Non‑repainting (no future data leakage)
Optimized label handling (v6‑safe, no mutable arguments)
📌 Best For
Swing traders
Positional traders
Anyone using multi‑timeframe analysis
🚀 Summary
MTF SMA brings higher‑timeframe structure directly onto your trading chart with clean visuals, flexible source selection, and precise labeling—making it easier to trade with the trend, not against it. Gösterge

Gösterge

Oliver Velez System Visual Helper [CocoChoco]Not endorsed by or related to Oliver Velez himself.
🐘 Oliver Velez System Visual Helper
🎯 Overview
Unlock the power of Institutional Trading with this precision tool designed for followers of the Oliver Velez (OV) methodology. This indicator specializes in identifying the "Narrow State"—the coiled spring of the market—and highlighting the high-probability entry candles that signal institutional participation.
Unlike standard indicators that lag, this helper focuses on the transition from low to high volatility, giving you a front-row seat to the moves that matter.
🧩 The Core Philosophy: The Narrow State
According to Oliver Velez, the most explosive moves in the market occur when the 20 SMA and the 200 SMA converge into a Narrow State. This represents a moment of equilibrium where both short-term and long-term traders are in agreement, and the next move is likely to be a significant expansion.
This indicator automates that discovery by:
Measuring Distance: It calculates the exact percentage gap between the SMAs to find the "coil."
Verifying Parallelism: It ensures the SMAs are moving "somewhat horizontal" and parallel, filtering out chaotic crossovers.
Multi-Timeframe Confirmation: It checks your higher timeframe (e.g., 15m) to ensure the big players are aligned before you take a trade on the smaller timeframe.
⚡ Power Entry Highlights
Once a Narrow State is confirmed, the indicator "paints" the chart with specific Velez-style entry patterns. These bars only highlight when Price > 20 SMA > 200 SMA (Bullish) or Price < 20 SMA < 200 SMA (Bearish), ensuring you never trade against the trend.
EB (Elephant Bar): The "Institutional Footprint." Large, solid-bodied bars that represent massive buying or selling.
TB (Tail Bar): Bottoming and Topping tails that show clear rejection of the SMAs, signaling a reversal into the main trend.
180 (Bull/Bear 180): A two-bar reversal pattern where the current bar completely engulfs the body of the previous bar, effectively "flipping" the momentum.
🛠️ Key Features
Dynamic Cloud Ribbon: A solid visual zone between the 20 and 200 SMAs that appears only when the Narrow State and MTF alignment are perfect.
Smart Bar Coloring: Only the specific institutional breakout bars change color, keeping your chart clean and professional.
Dual Alert System:
Narrow State Start: Get notified the second the market begins to coil.
Entry Candle Close: Get a ping exactly when a valid EB, TB, or 180 closes.
Consolidated Style: A clean UI that allows you to manage all pattern colors with a single picker.
🚀 How to Use
Wait for the Cloud: When the ribbon appears between the SMAs, the market is in a Narrow State.
Look for the Color: Watch for an Aqua (default) candle to form.
Check the Label: Verify the entry type (EB, TB, or 180).
Execute: Per OV's rules, enter on the break of the entry bar’s high/low with a stop at the tail/low of the bar.
Disclaimer: Trading involves significant risk. This tool is a visual aid, and may be significantly different from Oliver Velez system, and does not constitute financial advice. Always practice proper risk management. Gösterge

Capital Rotational Event CRE As A Multi Pair ScannerCapital Rotational Event (CRE) – Multi Pair Rotation Scanner
This open-source, non-overlay indicator scans for **capital rotation signals** across one lead/benchmark asset and up to four receiver/target assets simultaneously.
It detects when capital appears to be rotating **into** one or more of the receiver assets relative to the lead asset — a classic macro/rotation concept used in intermarket analysis.
Core Concept
In regime-shifting or macro-driven markets, money flows between asset classes or correlated instruments (risk-on → risk-off, equities → bonds, growth → value, etc.). When one asset class starts consistently outperforming another — and that outperformance is accelerating — it can signal a change in investor preference, risk appetite, or sector leadership.
This scanner visualizes that rotation in real time by calculating relative strength + momentum for multiple pairs at once.
How It Works
1. User selects:
- One Lead/ Benchmark asset (default: SPY – equities proxy)
- Up to four Receiver assets (defaults: GLD, TLT, USO, XLE)
2. For each receiver pair:
- Relative Strength (RS) = SMA( Receiver Close / Lead Close , RS Length )
- RS Momentum = SMA( change(RS) , Momentum Length )
3. Rotation Signal per pair:
- Bullish CRE (+1): RS > its own SMA **and** RS momentum > 0
→ Receiver outperforming Lead **and** the outperformance is accelerating
- Bearish CRE (-1): RS < its own SMA **and** RS momentum < 0
→ Receiver underperforming Lead **and** the underperformance is accelerating
- Neutral (0): otherwise
4. Visual Output:
- Four separate lines (green, blue, orange, purple) showing CRE signal for each receiver
→ +1 = bullish rotation into that asset
→ -1 = bearish rotation away from that asset
→ 0 = no clear rotation
- Background tint: light green when **at least one** receiver shows bullish CRE (+1)
Why this multi-pair scanner?
- Single-pair RS tools only show one relationship at a time.
- Monitoring multiple receivers simultaneously reveals **which** asset class or sector is currently receiving capital flows — very useful for macro traders, sector rotation strategies, or risk-on/off positioning.
- The momentum filter reduces lag and false signals compared to raw RS crossovers alone.
Typical Use Cases
- Risk-on/Risk-off: SPY (lead) vs GLD + TLT + USO (safe havens/commodities)
- Sector leadership: SPY vs XLE (energy) + XLK (tech) + XLV (healthcare) + XLF (financials)
- Macro themes: SPY vs TLT (equities vs bonds), DXY vs GLD, etc.
- Timeframes: Daily/weekly for macro swings, 4h/1h for tactical rotations
How to Use
1. Apply to any chart (timeframe of your choice — the indicator is timeframe-agnostic).
2. Set your preferred Lead asset and up to 4 Receivers in the inputs.
3. Adjust RS Length (default 14) and Momentum Length (default 9) to match your horizon.
4. Interpretation:
- Green line above zero → capital rotating into that receiver
- Multiple green lines rising → strong multi-sector rotation
- Light green background → at least one bullish rotation detected
- Use in combination with price action on the actual assets — this is a relative bias tool, not a direct trade signal.
5. Best in trending or regime-shifting markets; less useful when all assets move in strong correlation.
Inputs
- Lead Asset: benchmark (default SPY)
- Receiver 1–4: assets to monitor rotation into (defaults GLD, TLT, USO, XLE)
- RS Length: smoothing for relative strength (default 14)
- Momentum Length: smoothing for RS change (default 9)
Publishing Recommendation
- Publish with a clean chart (e.g., daily or 4h SPY, or any index/ETF)
- The indicator is non-overlay — it plots in a separate pane below price
- No other indicators needed for basic use
This script is fully open-source for transparency and learning. It highlights relative rotation patterns — not guaranteed future performance. Trading and investing involve significant risk of loss.
Feedback welcome — especially suggestions for other useful receiver pairs! Gösterge

Strateji

Gösterge
Gösterge

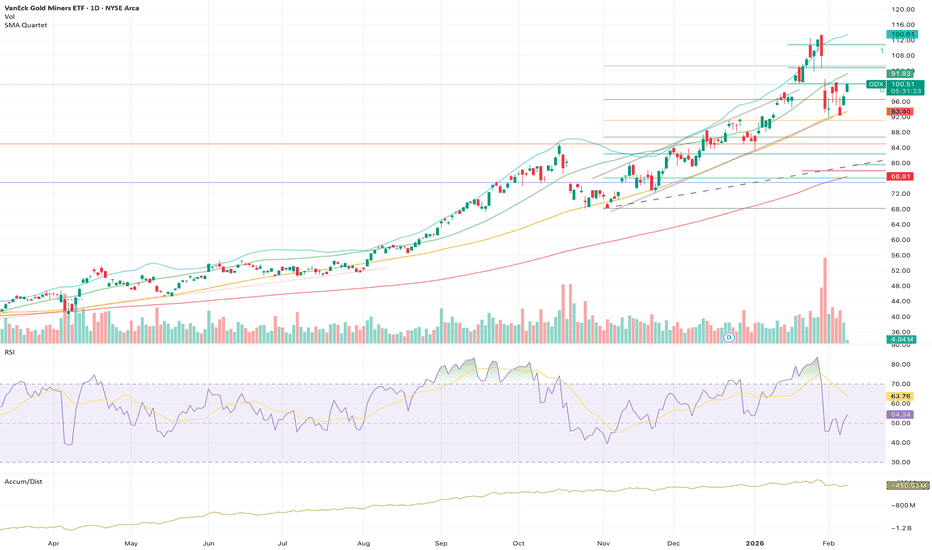
Anchor-Point AverageAnchor-Point Average (APA) - Pine Script Indicator
Overview
The Anchor-Point Average (APA) is a unique technical indicator that calculates the average price from a user-defined starting point to the present. Unlike traditional Simple Moving Averages (SMA) that use a rolling window of fixed periods, APA uses a fixed anchor point in time, creating a cumulative average that grows with each new bar.
Key Features
Interactive Time Selection
Click-to-Select: Simply click on any bar in the chart to set your anchor point
Visual Markers: Clear labels show the start point with date/time and current average price
Flexible Analysis: Anchor to any significant event, price level, or time period
Multiple Price Types
Choose from 7 different price calculations:
Close: Standard closing price
Open: Opening price for gap analysis
High/Low: Track resistance and support levels
HL2: Midpoint price (High + Low) / 2
HLC3: Typical price (High + Low + Close) / 3
OHLC4: Average price (Open + High + Low + Close) / 4
Customizable Display
Color Settings: Customize both anchor point and current label colors
Clean Interface: Minimalist design with essential information only
Professional Labels: Display average price, sample count, and timestamps
Smart Alerts
Cross Above Alert: Notifies when price crosses above the anchor-point average
Cross Below Alert: Notifies when price drops below the anchor-point average
Visual Markers: Green triangles (bullish cross) and red triangles (bearish cross)
Why Anchor-Point Average?
Different from Traditional SMA
Traditional moving averages use a rolling window (e.g., last 20 bars), which means older data constantly drops out. APA maintains all data from your chosen anchor point, providing a true cumulative average that represents the mean price since that specific moment.
Use Cases
Long-Term Investment Analysis
Calculate average entry cost from your first purchase date
Track performance against your initial investment timing
Identify if current price is above or below your historical average
Event-Based Analysis
Anchor to product launches, earnings reports, or policy announcements
Measure price behavior after significant market events
Compare current price to post-event average levels
Support/Resistance Identification
The anchor-point average often acts as dynamic support or resistance
As more data accumulates, the line becomes increasingly stable
Price reactions to this level can signal trend continuation or reversal
Volatility Assessment
Increasing distance from anchor average indicates growing volatility
Convergence suggests consolidation or equilibrium
Track how current price deviates from long-term mean
Technical Advantages
Stability Over Time
As the sample size grows, the anchor-point average becomes progressively smoother and less sensitive to short-term volatility, providing a robust reference level.
Historical Context
Unlike moving averages that "forget" old data, APA preserves the entire price history from your chosen point, offering complete context for your analysis.
Psychological Significance
Often traders anchor mentally to specific dates or events. This indicator makes that psychological level visible and quantifiable.
How to Use
Add to Chart: Apply the indicator to any TradingView chart
Select Anchor Point: Click on the bar where you want to begin calculation
Choose Price Type: Select which price component to average (default: Close)
Customize Colors: Adjust label colors to match your chart theme
Set Alerts: Create alerts for price crossovers to stay informed
Perfect For
Long-term investors tracking cost basis
Swing traders analyzing from key pivot points
Event-driven traders measuring post-announcement trends
Anyone seeking a stable, cumulative price reference
Technical Notes
Built on Pine Script v5
Overlay indicator (plots directly on price chart)
Real-time calculation with bar-by-bar updates
Supports all timeframes and instruments
Zero repainting - calculations are final once bar closes Gösterge

Gösterge

Gösterge

Gösterge

Gösterge