Intraday Pullback Sniper (BB, Stoch RSI, Liquidity, HTF)An intraday entry-timing indicator.
It looks for pullbacks into a Bollinger band in the direction of the higher-timeframe bias — buying dips in an up regime, selling rallies in a down one — and marks the candle where the pullback has run far enough and the lower-timeframe structure has turned back.
It marks conditions. It does not place stops, targets or position sizes, and it does not tell you to buy. That decision stays with you.
TWO DOTS, AND THE DIFFERENCE BETWEEN THEM IS THE WHOLE IDEA
A small dot means a setup is armed. Four conditions on the same candle: the wick touched a band, the candle closed back inside and in the half that faces that band, the Stoch RSI was at its extreme within the last few candles, and the bias allows that direction. Read it as "price bounced off the band, I am watching."
A large dot means every enabled condition is met. On top of a setup still running from an earlier candle it needs the structure of the entry timeframe to have confirmed the turn, a second band touch with a rejection on this very candle, the bias, the liquidity sweep if you require one, an open session, and the cooldown after the last signal to have passed. Read it as "price did it a second time, and the structure turned in between."
The decisive part is the time gap. The band has to be touched twice, and the structure has to confirm between the two. A large dot can therefore never appear on the same candle as its own small dot — the following one at the earliest. A new small dot on a signal candle is normal: that candle meets the setup conditions as well, so it arms the next setup while the current one fires.
WHAT IT DRAWS
On the price chart: Bollinger Bands, the bias EMA, setup and signal dots with the price they occurred at, swing labels (HH / HL / LH / LL), market structure (BOS / CHOCH / MSB) for several timeframes, liquidity levels named by side and rank, and session boxes sized to the high and low each session made.
In its own pane: the Stoch RSI the logic actually runs on, its levels, dots at the extremes, the bias as a background tint, and a strip along the bottom that runs for as long as a setup is still waiting for its signal.
HOW SWINGS ARE FOUND
Everything structural — swing labels, market structure and liquidity — comes from one single engine using the classical definition of a turning point. A swing high is the highest candle of a window with the same number of candles on its left and on its right, so it is a local extreme in the literal sense. It is confirmed and never repainted, at the cost of a delay equal to that window.
Highs and lows strictly alternate. A second point of the same kind before the opposite one does not open a new leg; it replaces the current one if it is more extreme, otherwise it is discarded. Two degrees are calculated: a short one with a lookback of 2, the classic fractal, and a longer one for the larger move.
Structure breaks are judged on the close, never on wicks. A break with the prevailing direction is a BOS, one against it a CHOCH; both are MSB events.
Liquidity levels are swing points price has not closed beyond. Once a candle of that timeframe closes through a level, the orders resting there have been filled and the level is dropped. A wick through it with a close back on the old side is a sweep, not a break, so the level survives and is marked as swept.
HOW TO USE IT
Put the chart on the setup timeframe, 5 minutes by default. The entry timeframe must be lower than the chart; its candles are read from inside each chart candle. All higher-timeframe data comes from closed candles only, and signals are evaluated at the close of a chart candle, never intrabar.
The 5-minute default describes the preset, not a limit. Every timeframe is adjustable — a 15m chart with a 1H bias and 5m entry structure works the same way. The status table tells you if the chart and the setup timeframe do not match.
For alerts, pick "Any alert() function call" with the trigger "Once Per Bar Close". One alert then covers both directions, and the message carries symbol, direction, price, bias, setup direction, structure state, sweep and session. Separate SNIPER LONG and SNIPER SHORT conditions exist as well.
Every setting has a tooltip. Group 0 holds a glossary of the labels and a short guide to the alerts.
ON THE DEFAULTS
The defaults are deliberately on the safe side and the strict bias is on. If you get too few signals, switch conditions off one at a time and watch what changes — that is far more instructive than loosening several at once. The liquidity sweep is the one filter that is off by default; switch it on for the stricter variant.
LIMITATIONS, HONESTLY
Lower-timeframe data on TradingView is limited to a few months of intrabar history depending on your plan. Further back the entry structure and the signals that depend on it are missing, while everything else keeps drawing normally.
A swing is only confirmed after its window has passed, so the most recent candles cannot carry a label yet. That delay is the price of never repainting, and it is not a bug.
The indicator needs no volume, so it works on CFDs, forex and futures alike. It assumes continuous trading without large gaps — on instruments that gap overnight a band touch can come from the opening gap rather than from a rejection, and the logic is of little use there.
Suited to liquid, continuously traded instruments: index CFDs, major crypto, major forex pairs, liquid futures. On crypto the sessions carry no meaning; either switch all three off or trade the overlapping hours deliberately.
This is a tool for your own analysis, not financial advice. Past behaviour of any setup says nothing about future results. Gösterge

Blended Momentum OscillatorBlended Momentum Oscillator
Overview
A bounded momentum indicator plotted in a separate pane below the chart. It blends two normalized momentum measures into a single 0–100 line, smoothing out the whipsaw that either measure produces on its own.
How it works
The output is the arithmetic mean of two components:
1. **Smoothed RSI** — a 14-period RSI passed through a 14-period Hull Moving Average. The HMA reduces lag compared to a simple or exponential smoothing of the same length while cutting the noise of raw RSI.
2. **Slow Stochastic** — a 200-period Stochastic of close against the 200-bar high/low range, smoothed with a 50-period EMA. The long lookback makes this component a slow-moving positional reference rather than a fast trigger.
Both components are natively bounded to 0–100, so their average is too. Missing values are substituted with the neutral midpoint of 50 so the line stays continuous on new symbols or thin history.
The fast RSI leg supplies responsiveness; the slow Stochastic leg anchors the reading to where price sits within its longer-term range. A high combined value therefore requires both recent momentum *and* an elevated position in the 200-bar range.
Reading the indicator
**Color gradient.** The line is continuously colored by its own value, dark green at the bottom of the scale through green, lime, yellow, orange, red, to maroon at the top. Color alone communicates the current regime without reading the number.
**Levels.** Dashed lines mark 80 and 20; a dotted line marks the 50 midpoint. The 20–80 band is lightly shaded. Because both components are long-period and averaged, excursions past 80 or below 20 are comparatively rare — these are not the frequent, low-signal touches typical of a standalone 14-period RSI.
**Pivot markers.** An X cross is plotted at each confirmed local extreme of the oscillator that occurs in an extreme zone: pivot highs above 80 (maroon) and pivot lows below 20 (teal). Detection uses one bar left and one bar right, so a marker is confirmed one bar after the fact and is drawn back at the pivot bar. These mark the point where an extended reading actually turns, rather than the moment it first enters the zone.
**Scale.** Two invisible anchor plots at 0 and 100 pin the pane to the full range. The vertical scale never rescales to the visible data, so the distance between readings is comparable across symbols and timeframes.
Notes
- No inputs. All periods are fixed by design; the component lengths are chosen to be deliberately mismatched in speed, and altering them changes the character of the blend.
- Requires roughly 200 bars of history before the slow component is fully seeded.
- Timeframe-agnostic. It works on any chart period, but the 200-bar Stochastic means the effective lookback in calendar time scales with the chart's timeframe.
- This is an analytical tool, not a signal system. Extreme readings and pivot markers describe conditions; they are not entry or exit instructions.
Gösterge

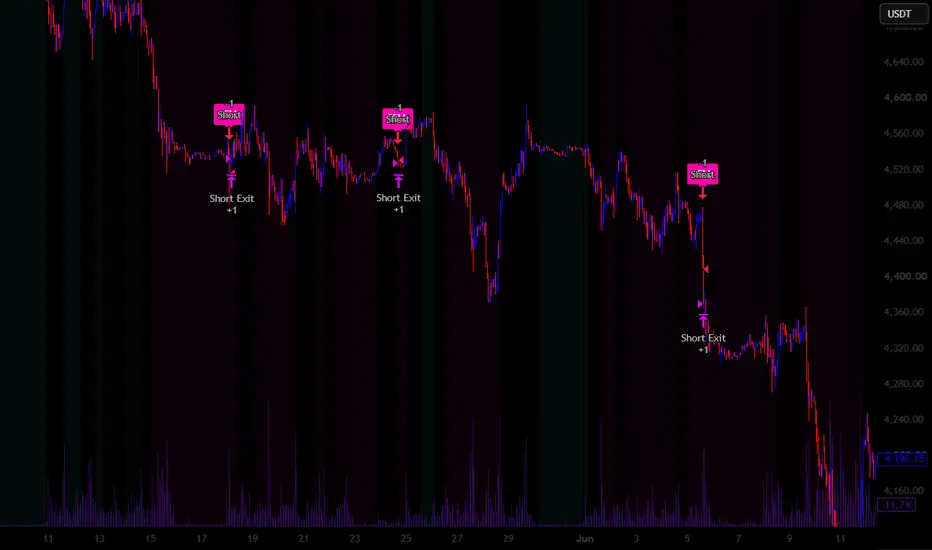
StackLight MTF | MTF Momentum Stack + Stochastic ConfluenceThe strategy only fires a signal when three timeframes of your choosing — fast, medium, and slow — all agree on direction. Each timeframe is scored bullish, bearish, or neutral using either RSI or EMA slope, and displayed as a live 3-light traffic signal in the corner of your chart. Green means go, red means no — and when all three lights match, the strategy arms itself for entry.
Once the stack is aligned, entries are triggered by a stochastic %K/%D crossover on your chart timeframe, confirmed by a linreg-smoothed stochastic on your slowest timeframe — so you're not just trading a momentum cross in isolation, you're trading one that's backed by higher-timeframe agreement.
Risk is handled with ATR-based stops and targets, and position size adjusts automatically so every trade risks a fixed percentage of your account — no more, no less — regardless of how wide or tight the current stop distance is. An optional "stack flip" exit closes trades early if the multi-timeframe alignment breaks down before your stop is hit, cutting losers faster than a static stop alone.
Features
3-light traffic signal table — instant visual read of alignment across your fast/medium/slow timeframes
Dual momentum modes — RSI (with adjustable neutral band to reduce flip-flopping) or EMA slope
Linreg-smoothed MTF stochastic — filters out the staircase artifact from pulling higher-timeframe data
Bias label — STRONG BULL / BULL LEAN / NEUTRAL / BEAR LEAN / STRONG BEAR at a glance
Background tint + bar coloring — full-chart visual confirmation, not just the indicator pane
Risk-based position sizing — fixed % equity risk per trade, auto-scaled to current ATR
ATR stop/target + stack-flip early exit — two independent exit mechanisms
Built-in alert conditions for long/short signals — ready for automation
Long-only, short-only, or both — directional bias control in one input
Strateji

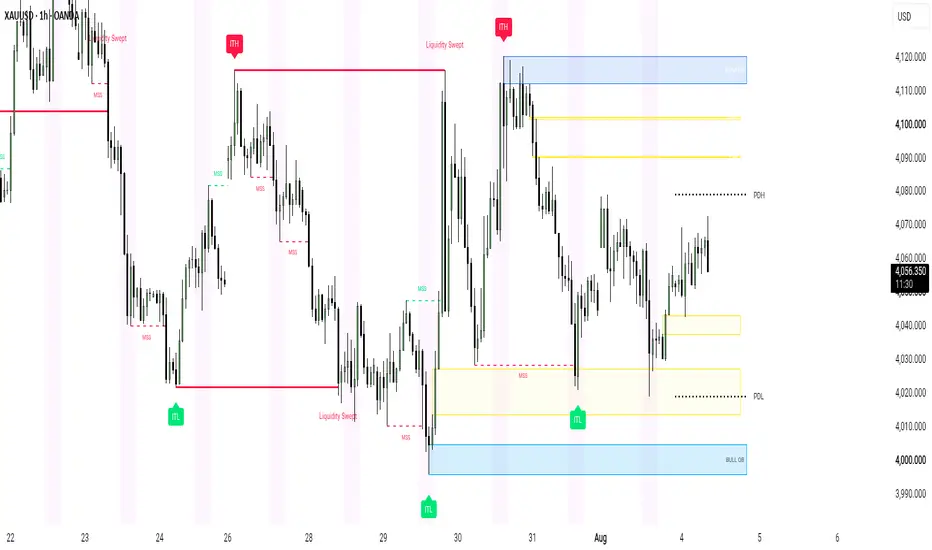
ICT Smart Money Execution Engine PROICT Smart Money Execution Engine PRO
ICT Smart Money Execution Engine PRO is an advanced, high precision technical analysis tool designed for traders practicing Inner Circle Trader and Smart Money Concepts methodologies. It automatically maps structural context, liquidity sweeps, macro price extremes, and key session windows while keeping your charting environment ultra clean.
Key Features Overview
1. Intermediate Term Highs and Lows Badge Labels
Identifies major market turning points with distinct solid badge style labels. Intermediate Term Highs are clearly displayed with red ITH badges above swing points, and Intermediate Term Lows are displayed with green ITL badges below swing points.
2. Auto Mitigating Previous Day High and Low
Projects active daily boundaries on your chart. To prevent visual clutter, Previous Day High and Previous Day Low lines automatically delete as soon as price touches or mitigates them.
3. Red Line Termination Liquidity Sweeps
Tracks high probability liquidity pools sitting above swing highs and below swing lows. When price sweeps liquidity, a solid 2x width red line connects the original swing point directly to the sweeping candle wick, terminating instantly with a clear Liquidity Swept label.
4. Dynamic Auto Mitigating Fair Value Gaps
Automatically identifies bullish and bearish price imbalances across all timeframes. Unmitigated FVG boxes dynamically clean up and vanish as soon as price returns to fill them.
5. Volume Validated Order Blocks
Detects key institutional order block zones using a customizable 50 bar lookback by default. Zones remain active until price firmly closes beyond their boundaries.
6. Clean New York Session Highlight
Provides a single, ultra light background overlay specifically for the New York Session window, eliminating the distraction of multiple overlapping global sessions.
7. Market Structure Shift Detection
Tracks momentum reversals in real time by drawing clean dashed structure lines and MSS labels when key structural pivots are broken by candle closes.
How to Use
Step 1: Determine Macro Bias
Use the red ITH and green ITL badges to locate institutional swing extremes and understand the broader market trend.
Step 2: Focus on New York Session
Analyze price action during the highlighted New York Session window when market volume and institutional volatility are highest.
Step 3: Identify Liquidity Sweeps
Watch for price to sweep an active Previous Day High, Previous Day Low, or recent swing level marked by the bold red Liquidity Swept line.
Step 4: Execute on Structural Confirmation
Wait for a Market Structure Shift signal following a liquidity sweep, then evaluate entries on retaps into active Order Blocks or Fair Value Gaps.
Settings Overview
ITH / ITL Settings
- Show ITH / ITL Badge Labels: Toggle visibility of intermediate swing badges.
- Lookback Sensitivity Length: Adjust pivot lookback sensitivity for detecting macro highs and lows.
- Colors: Customization options for ITH and ITL badge background colors.
Previous Day High and Low Settings
- Show Active PDH / PDL: Toggle display of auto disappearing daily levels.
- Line Width and Style: Choose between solid, dotted, or dashed line styles and adjust thickness.
Fair Value Gap Settings
- Show Active FVGs: Toggle dynamic imbalance box visibility.
- FVG Transparency: Adjust fill opacity for bullish and bearish boxes.
Order Block Settings
- OB Lookback Length: Customize the pivot length used for order block detection (default is set to 50).
Liquidity Sweep Settings
- Show Liquidity Sweeps: Toggle sweep lines and labels.
- Sweep Line Color: Customize the color of the 2x width sweep termination line.
Session Settings
- Show Only New York Session: Toggle visibility of the session background highlight.
- NY Session Window: Set exact session hours to match your local or UTC-4/5 preferences.
Disclaimer
This script is built strictly for educational, analytical, and charting enhancement purposes. It does not provide financial advice, automated trading signals, trade management, or guaranteed results. Trading financial markets involves substantial risk of capital loss. Always perform your own analysis and practice strict risk management.
Gösterge

DCA Performance Backtester [Multi-Mode]
DCA Performance Backtester
WHAT IT DOES
This indicator backtests Dollar-Cost Averaging (DCA) accumulation strategies on any symbol and shows the full result on the chart: an on-chart summary table, entry markers, average-cost line, real dividend (ex-date) tracking, a dividend-yield value zone, and a fair comparison against Lump Sum investing. It is accumulate-only (HODL) — no selling logic.
BUY MODES (can be combined)
1. Time-Based DCA — buy a fixed amount every Day / Week / Month. You can pick the weekday (weekly), the day of month (monthly, e.g. payday), or the hour (daily on intraday charts). If the market is closed on the target day, it buys the next trading day.
2. Buy the Dip — buy when price drops X% (default 12%) from the highest close of the last N bars (default 20). A cooldown (default 14 bars) spaces out repeat buys while the condition persists. Optional RSI settings:
• Filter mode — only buy when RSI is below the threshold (default 30).
• Hybrid mode — buy a normal unit on every qualifying dip (blue "D" label) AND an extra special unit when RSI is also below the threshold (red "fire" label), each stream with its own cooldown. The special unit size is adjustable via a multiplier.
3. Martingale-style averaging — first unit at a fixed size, then buy a larger unit (configurable multiplier) each time price falls another X% from the last entry, with a max-steps cap and optional reset when price recovers above average cost.
DIVIDENDS (REAL EX-DATE DATA)
Uses the symbol's actual dividend history. On each ex-date the script credits dividend × units held. Choose Gross or Net; where an exchange only provides gross figures (e.g. SET), Net is estimated as Gross × (1 − withholding tax %). Each ex-date is marked on the price chart with its per-round yield ("XD 2.35%" = dividend per share ÷ close of that day).
DIVIDEND-YIELD VALUE ZONE
Highlights price areas where the annual dividend yield at that price exceeds your threshold (default 8%/year) — useful for income-focused accumulation. Two calculation modes: trailing 12 months (TTM) or last completed calendar year. An outlier filter (default 2.5× median) excludes one-off special dividends so they do not inflate the yield. A reference line shows the exact price where yield equals the threshold.
SUMMARY TABLE
Buy count (normal vs RSI-passed dips), invested capital, units held, average cost, current portfolio value, P/L, ex-date count, total dividends received, dividends as % of invested capital, current TTM yield, DCA total return (incl. dividends), and a Lump Sum comparison computed from the same invested amount at the start date — including dividends on the Lump Sum side for a fair comparison.
ALERTS
Every buy signal fires alert() with a JSON payload (symbol, mode, price, amount, drawdown from high, RSI, and whether the RSI condition passed) — ready for webhooks. Create an alert with "Any alert() function call". Alerts fire on bar close for signals that occur after the alert is created; historical backtest markers do not fire.
HOW TO USE
Recommended on daily charts. Enable one or more buy modes, set your budget and date range, and read the "DCA beats/loses Lump Sum" row to judge whether systematic dip-buying suits the symbol. Typical tuning: calmer stocks work with smaller dip thresholds (5–7%), volatile ones with larger (12–15%).
METHOD & LIMITATIONS
Simulation buys at bar close (no intrabar fills). Accounting is computed by the script itself (indicator, not a strategy — no Strategy Tester tab). Commission % per purchase is included in cost basis. Dividend data depends on TradingView's database and may be incomplete for some markets or older periods. Past performance does not guarantee future results. Educational tool — not investment advice.
═══════════════════════════════════════════════
DCA Performance Backtester
เครื่องมือทดสอบย้อนหลัง (backtest) กลยุทธ์สะสมหุ้นแบบ DCA กับสินทรัพย์ใดก็ได้ แสดงผลครบบนชาร์ต: ตารางสรุป, จุดซื้อ, เส้นต้นทุนเฉลี่ย, เงินปันผลจากวัน XD จริง, โซนราคาที่ปันผลคุ้ม และการเทียบกับ Lump Sum อย่างยุติธรรม — เป็นแบบซื้อสะสมอย่างเดียว (HODL) ไม่มีการขาย
โหมดการซื้อ (เปิดพร้อมกันได้)
1) DCA ตามรอบเวลา — รายวัน/รายสัปดาห์/รายเดือน เลือกวันและเวลาซื้อได้ ตลาดปิดวันเป้าหมายจะเลื่อนให้อัตโนมัติ
2) Buy the Dip — ซื้อเมื่อราคาย่อจาก High ตาม % ที่ตั้ง (ค่าเริ่มต้น 12% จากกรอบ 20 แท่ง เว้นซื้อซ้ำ 14 แท่ง) พร้อมตัวเลือก RSI สองแบบ: กรองอย่างเดียว หรือโหมดผสม — ไม้ปกติทุกครั้งที่ย่อ (ป้าย D สีฟ้า) + ไม้พิเศษเมื่อ RSI ต่ำกว่าเกณฑ์ด้วย (ป้ายไฟสีแดง) แยก cooldown สองสาย ปรับตัวคูณไม้พิเศษได้
3) ถัวเฉลี่ยขาลงแบบ Martingale — ไม้ใหญ่ขึ้นตามตัวคูณเมื่อราคาลงต่อ มีเพดานจำนวนไม้และรีเซ็ตเมื่อราคาฟื้น
เงินปันผล — ใช้ประวัติ XD จริงของสินทรัพย์ คิดจากจำนวนหน่วยที่ถือ ณ วัน XD เลือก Gross/Net ได้ (ตลาดที่มีแต่ Gross เช่น SET จะคำนวณ Net จากภาษีหัก ณ ที่จ่ายให้) จุด XD บนชาร์ตแสดง % ปันผลของงวดนั้นเทียบราคาวันนั้น
โซนปันผลคุ้ม — ไฮไลท์พื้นหลังช่วงราคาที่ yield ต่อปีสูงกว่าเกณฑ์ (ค่าเริ่มต้น 8%) เลือกวิธีคิดได้ทั้ง TTM 12 เดือน หรือปีปฏิทินล่าสุด พร้อมตัวกรองตัดปันผลพิเศษที่ทำให้ yield โป่งเกินจริง และเส้นบอกราคาที่ yield เท่าเกณฑ์พอดี
ตารางสรุป — จำนวนไม้ (แยกไม้ปกติ/ผ่าน RSI), เงินต้น, หน่วยที่ถือ, ต้นทุนเฉลี่ย, มูลค่าพอร์ต, กำไร/ขาดทุน, จำนวนครั้ง XD, ปันผลรวมและคิดเป็น % ของเงินต้น, yield ปัจจุบัน, ผลตอบแทนรวมปันผล และบรรทัดตัดสิน DCA ชนะ/แพ้ Lump Sum
Alert — ทุกสัญญาณซื้อยิง alert() เป็น JSON (สัญลักษณ์ โหมด ราคา จำนวนเงิน % ย่อ RSI และสถานะผ่าน RSI) พร้อมต่อ webhook ตั้งด้วย "Any alert() function call" — ยิงเฉพาะสัญญาณที่เกิดหลังตั้ง alert ที่ราคาปิดแท่ง
ข้อจำกัด — จำลองซื้อที่ราคาปิดแท่ง เป็น indicator จึงไม่มีแท็บ Strategy Tester ข้อมูลปันผลอิงฐานข้อมูล TradingView ผลในอดีตไม่ยืนยันอนาคต จัดทำเพื่อการศึกษา ไม่ใช่คำแนะนำการลงทุน Gösterge

KNN Adaptive Cycles█ OVERVIEW
An adaptive Stochastic RSI whose lookback lengths are driven by the market's measured dominant cycle period, further refined in real time by a K-Nearest Neighbors machine learning layer. Rather than accepting a fixed RSI or Stochastic length, the indicator continuously measures the dominant cycle in price using two independent spectral methods, then uses KNN to anticipate where the cycle is heading and to condition the oscillator output against historical outcomes — so the indicator adapts to what the market is actually doing, not what a static setting assumes it should be.
█ CYCLE DETECTION
The indicator measures the dominant cycle period using two independent methods from the digital signal processing work of John Ehlers, who treated price as a waveform and applied engineering filters to extract its underlying structure.
Autocorrelation Periodogram
Computes Pearson correlation across lags from the minimum to maximum period range, identifying the lag at which price most strongly repeats. Returns a correlation coefficient used directly as a confidence score.
Goertzel / DFT Power Spectrum
A frequency-domain scan that computes spectral power at each candidate period and selects the one carrying the most energy. Independent of the autocorrelation method, giving two mathematically distinct perspectives on the same cycle.
Before measurement, price is conditioned with Ehlers' filter set: a Highpass filter to remove the trend component, a Super Smoother for anti-aliasing, and an optional Bandpass pre-filter to isolate the cycle band. In AC + DFT (Confirmed) mode the two estimates are cross-checked, with each method weighted by its agreement strength and the AC correlation coefficient before blending into a single confirmed period. Single-method modes run the selected method at full per-bar resolution.
█ KNN MACHINE LEARNING
Two independent KNN nearest-neighbor routines operate on top of the cycle and signal layers. Both use weighted Euclidean distance across feature vectors, a 1/distance-weighted outcome average across K neighbors, and ALMA smoothing on the output bias.
Period KNN
Searches history for bars whose cycle state most closely resembles the current bar — matching on current period, rate of change, stability streak, confidence score, and volatility regime. Observes what the period actually became Forward Bars later at each neighbor, then blends that prediction into the current period estimate before final smoothing. Helps the indicator anticipate cycle transitions rather than just react to them.
Signal KNN
Searches history for bars whose StochRSI context most closely resembles now — matching on K level, K−D histogram, K slope, volatility regime, OB/OS proximity, and D line. Observes the forward price outcome at each neighbor and blends the resulting bias into the K line before D smoothing, so D inherits the correction naturally.
█ FEATURES
Cycle detection
• Dual spectral cycle detection — AC and DFT run in parallel with a 0–100% confidence score reflecting method agreement
• Confidence-weighted period blending — each method weighted by agreement and correlation strength, smoothed into one adaptive period
• Single-method modes — Optional select Autocorrelation Only or DFT Only run for faster loading
• Optional Performance Throttle — cadence-limited spectral scans for the AC + DFT mode
KNN layer
• Period KNN — anticipates cycle transitions by learning from historical cycle states and their forward outcomes
• Signal KNN — conditions the K line against historically similar StochRSI contexts and their forward price outcomes
• Per-feature importance weights for both KNN routines — tunable to emphasize what matters most on a given instrument
• ALMA-smoothed bias output — configurable length, offset, and sigma Gösterge

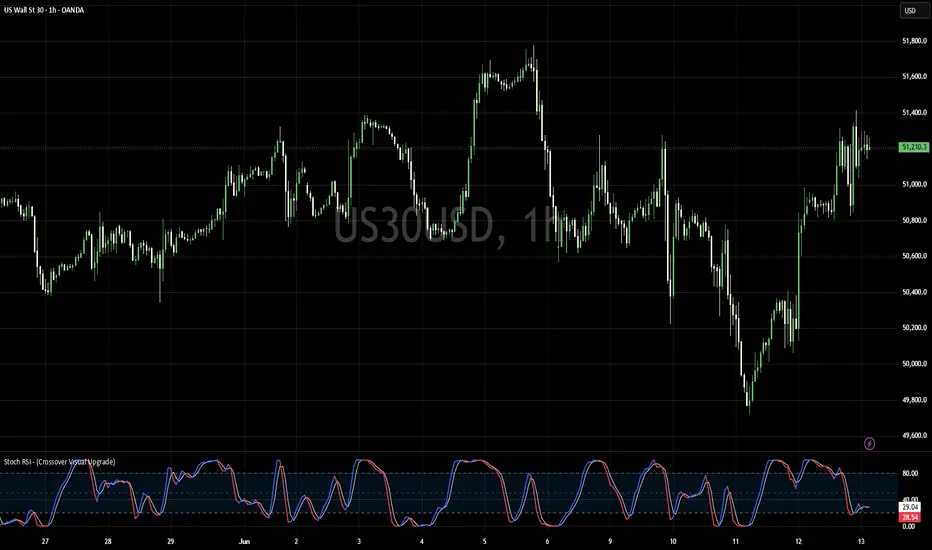
Stochastic + RSI in oneStochastic + RSI Confluence Signal is a combined momentum oscillator that integrates the Stochastic Oscillator and Relative Strength Index (RSI) into one panel.
The indicator is designed to help traders identify potential exhaustion zones and moments when both momentum tools indicate similar market conditions.
Logic:
• Stochastic measures the position of the current closing price relative to the recent high-low range.
• RSI measures the strength and speed of price movements.
The default settings are based on the traditional parameters:
• Stochastic: K Period 5, D Period 3, Slowing 3
• RSI: Period 14
Potential bearish conditions:
• Stochastic reversal from an overbought area
• RSI above the overbought level
Potential bullish conditions:
• Stochastic reversal from an oversold area
• RSI below the oversold level
This indicator is intended as a confirmation tool and should not be used as a standalone trading system. Market context, trend direction, price action, and risk management should always be considered.
Users can adjust all parameters according to their trading style, timeframe, and market conditions.
--------------------------------------------------------------------------------
Stochastic + RSI Confluence Signal to połączony oscylator momentum, który integruje Oscylator Stochastic oraz Relative Strength Index (RSI) w jednym panelu.
Wskaźnik został zaprojektowany, aby pomagać traderom identyfikować potencjalne strefy wyczerpania ruchu oraz momenty, w których oba narzędzia momentum wskazują podobne warunki rynkowe.
Logika działania:
• Stochastic mierzy położenie aktualnego zamknięcia ceny względem ostatniego zakresu pomiędzy najwyższym High i najniższym Low.
• RSI mierzy siłę oraz dynamikę ruchów cenowych.
Domyślne ustawienia wykorzystują klasyczne parametry:
• Stochastic: K Period 5, D Period 3, Slowing 3
• RSI: Period 14
Potencjalne warunki spadkowe:
• Odwrócenie Stochastic ze strefy wykupienia
• RSI powyżej poziomu wykupienia
Potencjalne warunki wzrostowe:
• Odwrócenie Stochastic ze strefy wyprzedania
• RSI poniżej poziomu wyprzedania
Wskaźnik jest przeznaczony jako narzędzie potwierdzające i nie powinien być używany jako samodzielny system transakcyjny. Należy zawsze uwzględniać kontekst rynku, kierunek trendu, zachowanie ceny oraz zarządzanie ryzykiem.
Użytkownik może dostosować wszystkie parametry do własnego stylu handlu, interwału czasowego oraz warunków rynkowych. Gösterge

Gösterge

Smart Swing Trend Stochastic RSI - TPAbsolutely friend. Here is a **TradingView rule-abiding publication description** you can use.
---
## Smart Swing Trend Stochastic RSI
**Smart Swing Trend Stochastic RSI** is a trend-aware Stochastic RSI indicator designed to help traders interpret momentum extremes with better market context.
Traditional Stochastic RSI often treats readings above 80 as “overbought” and readings below 20 as “oversold.” However, in strong trends, these extreme zones can remain extended for a long time. This script adds swing-trend context so the 80/20 zones are interpreted differently depending on whether the market is in a swing uptrend or swing downtrend.
The goal is to help traders avoid automatically fading strong momentum and instead separate trend strength from potential turning points.
---
## Core Concept
This indicator combines:
1. **Stochastic RSI**
2. **Swing-based trend direction**
3. **Trend-aware shaded zones**
4. **Simple table interpretation**
5. **Momentum turn and warning signals**
The script does not treat every overbought or oversold reading as a reversal. Instead, it asks:
> Is this Stoch RSI extreme showing trend power, or is it starting to become a possible pullback/bounce warning?
---
## How the Trend Logic Works
The trend logic is based on swing direction, adapted from the swing logic concept used in Zeiierman’s Dynamic Swing Anchored VWAP.
The script identifies recent swing highs and swing lows using the selected **Swing Period**.
In simple terms:
* **Swing Uptrend** means the current swing structure favors the upside.
* **Swing Downtrend** means the current swing structure favors the downside.
* **Swing Neutral** can appear when the optional neutral mode is enabled after a recent direction change.
This allows the Stochastic RSI to be interpreted based on the current swing environment instead of using a fixed moving average trend filter.
---
## Signal Meanings
### Bullish Turn
A **Bullish Turn** appears when the swing trend is up and Stochastic RSI recently reached the lower zone, then starts turning upward.
This can suggest that short-term momentum may be turning back up after a pullback.
Simple meaning:
> Momentum may be turning up in a swing uptrend.
---
### Bearish Turn
A **Bearish Turn** appears when the swing trend is down and Stochastic RSI recently reached the upper zone, then starts turning downward.
This can suggest that short-term momentum may be turning back down after a bounce.
Simple meaning:
> Momentum may be turning down in a swing downtrend.
---
### Pullback Warning
A **Pullback Warning** appears when the market is in a swing uptrend, Stochastic RSI is in the upper zone, and momentum starts rolling over while price is extended.
This does not automatically mean the trend is over. It is a caution signal.
Simple meaning:
> Price may be stretched in an uptrend. Be careful chasing late.
---
### Bounce Warning
A **Bounce Warning** appears when the market is in a swing downtrend, Stochastic RSI is in the lower zone, and momentum starts turning upward while price is extended.
This does not automatically mean a new uptrend has started. It is a caution signal for shorts.
Simple meaning:
> Price may be stretched in a downtrend. Be careful shorting late.
---
## Shaded Zone Interpretation
The shaded areas are trend-aware:
* **Gray upper zone**: Stoch RSI is above 80, but in an uptrend this can still represent bullish power.
* **Red upper zone**: Momentum may be rolling over and pullback risk may be increasing.
* **Gray lower zone**: Stoch RSI is below 20, but in a downtrend this can still represent bearish power.
* **Green lower zone**: Momentum may be turning up and bounce potential may be increasing.
This helps avoid the common mistake of assuming:
* Above 80 always means sell.
* Below 20 always means buy.
In strong trends, extremes can remain extended.
---
## Read Table
The table provides a simplified summary of the current condition:
* **Trend**: Current swing trend direction.
* **Zone**: Current Stoch RSI zone interpretation.
* **Signal**: Recent valid signal, if one is active.
* **Interpretation**: Simple plain-English read of the current condition.
The signal can be held for a selected number of bars using the **Hold Signal For Bars** setting.
---
## Key Settings
### RSI Length / Stochastic Length
Controls the sensitivity of the Stochastic RSI calculation.
Lower values react faster.
Higher values are smoother but slower.
### Swing Period
Controls how large or small the swing structure should be.
Lower values react faster but can create more noise.
Higher values focus on larger swing moves.
### Price Extension ATR Multiplier
Used to help identify when price may be stretched away from its swing anchor.
### Shaded Zone Transparency
Allows users to adjust the brightness/opacity of the gray, red, and green shaded areas.
### Table Text Size
Allows users to adjust the size of the table text.
---
## How to Use
This indicator is best used as a momentum and timing tool, not as a standalone trading system.
A possible bullish interpretation:
> Swing trend is up, Stoch RSI pulled into the lower zone, then a Bullish Turn appears.
A possible bearish interpretation:
> Swing trend is down, Stoch RSI bounced into the upper zone, then a Bearish Turn appears.
A caution example:
> In an uptrend, Stoch RSI above 80 may remain bullish power. A Pullback Warning only appears when momentum starts rolling over and price is extended.
---
## Important Notes
This indicator is for educational and analytical purposes only.
It does not guarantee future price movement and should not be used as financial advice. Traders should combine it with price structure, volume, support/resistance, risk management, and broader market context.
When the **Confirm Signals On Closed Bar** option is enabled, signals are designed to confirm only after the candle closes. Live candles can still change before closing.
---
## Attribution
Swing-direction trend logic is adapted from the concept used in **Dynamic Swing Anchored VWAP by Zeiierman**.
Original work licensed under Creative Commons Attribution-NonCommercial-ShareAlike 4.0 International:
(creativecommons.org)
Gösterge

Gösterge

Strateji

Multi-Timeframe Trend Table (Weighted)**Multi-Timeframe Trend Table (Weighted) — Market Bias Dashboard**
This indicator is a **multi-timeframe trend analysis system** designed to evaluate overall market direction using a weighted combination of **ATR trend structure, Stochastic RSI momentum, and Moving Averages** across multiple timeframes.
It aggregates data from higher to lower timeframes into a single **bias scoring table**, giving traders a clear, structured view of market sentiment and directional strength.
---
### 🔍 Core Concept
Instead of relying on a single timeframe or indicator, this tool builds a **composite market bias model** by:
* Analysing trend strength across multiple timeframes (Monthly → 1M)
* Applying weighted importance to each timeframe
* Combining three key systems:
* ATR-based trend direction (volatility structure)
* Stochastic RSI momentum shifts
* Moving Average bias filter
---
### 📊 Key Features
• **Multi-Timeframe Structure**
* Monthly, Weekly, Daily, 4H, 1H, 30m, 15m, 1m analysis
* Hierarchical trend evaluation from macro → micro
• **Weighted Bias System**
* Assigns importance to each timeframe (customisable)
* Higher timeframes dominate overall market direction
* Produces a final **bullish / bearish bias score**
• **Triple Indicator Confirmation**
Each timeframe uses:
* ATR trend logic (volatility direction)
* Stochastic RSI (momentum confirmation)
* Moving Average filter (trend bias)
• **No Repainting Logic**
* Uses confirmed higher timeframe closes only
* Prevents false real-time signal shifts
* Ensures stable, reliable bias readings
• **Signal Threshold System**
* Custom X-signal trigger based on bias strength
* Highlights strong directional conviction zones
---
### 📊 How to Use
**Bullish Bias**
* Higher timeframes align bullish
* Weighted score exceeds threshold
→ Market favours long setups
**Bearish Bias**
* Higher timeframes align bearish
* Weighted score exceeds threshold
→ Market favours short setups
**Neutral / Mixed Bias**
* Conflicting multi-timeframe signals
→ Avoid directional trading or wait for alignment
---
### ⚠️ Best Practice
This is a **market context tool**, not a standalone entry system.
For best performance combine with:
* Liquidity zones
* Market structure (BOS / CHoCH)
* Support & resistance levels
* Entry triggers from lower timeframe setups
---
### 🚀 Ideal For
* Swing traders
* Position traders
* Smart money / structure-based trading
* Multi-timeframe confirmation strategies
* Crypto, Forex, indices
---
### 🧠 Trading Philosophy
**Higher timeframes define direction.
Lower timeframes define execution.
This tool bridges both into one bias model.**
---
**Trade with alignment, not randomness.** Gösterge

Gösterge

MTF MA & MACD & StochRSI (pro)Multi-Timeframe MA & MACD & StochRSI (Pro)
The Multi-Timeframe MA & MACD & StochRSI (Pro) is a professional multi-timeframe confluence dashboard built to help traders quickly identify trend direction, momentum strength, and cross-timeframe alignment in one clean visual layout.
This tool combines Moving Averages, MACD logic, and StochRSI cross conditions across multiple timeframes, allowing traders to reduce chart clutter and improve decision-making without constantly switching between charts.
Designed for traders who rely on confluence, top-down analysis, and momentum confirmation.
Core Purpose
This indicator answers one key trading question:
Are my moving averages, momentum, and oscillator signals aligned across multiple timeframes?
By tracking multiple confirmations together, traders can identify stronger trend setups while filtering weaker or conflicting market conditions.
Multi-Timeframe Dashboard
The dashboard scans and displays data across:
1 Minute
5 Minute
15 Minute
1 Hour
4 Hour
1 Day
1 Week
This provides both short-term and higher-timeframe market alignment.
Core Features
1) Multi-Timeframe Moving Average Analysis
The indicator tracks:
20 EMA
50 EMA
For each timeframe it checks whether price is:
Above EMA → Bullish bias
Below EMA → Bearish bias
This gives a quick directional read of market structure.
2) MACD Confirmation Logic (Enhanced)
Unlike a basic MACD crossover, this version uses stricter logic for stronger confirmation.
Buy Condition
Histogram > 0
MACD Line > 0
Signal Line > 0
Sell Condition
Histogram ≤ 0
MACD Line ≤ 0
Signal Line ≤ 0
Neutral
If momentum is mixed, the dashboard displays Neutral.
This helps remove weaker crossover noise and improves momentum quality.
3) StochRSI Cross Confirmation
The dashboard tracks StochRSI cross alignment using:
RSI calculation
Stochastic range
Smoothed %K line
Smoothed %D line
Buy
%K > %D
Sell
%K < %D
Neutral
Flat or undefined conditions
This adds momentum confirmation beyond moving averages.
4) Non-Repainting Multi-Timeframe Logic
The script uses stable request.security() calls with completed timeframe bars to reduce repainting behaviour and improve consistency.
Useful for traders who want cleaner higher-timeframe confirmation.
5) On-Chart Moving Average Overlay
In addition to the dashboard, the indicator plots:
Current timeframe 20 EMA
Current timeframe 50 EMA
These allow traders to visually track trend support/resistance directly on price.
6) Weekly MA Overlay
Optional higher-timeframe moving averages can also be shown directly on the active chart:
Weekly 20 EMA
Weekly 50 EMA
This helps identify:
Macro trend direction
Dynamic support/resistance
Higher timeframe bias
Confluence zones
Can be toggled ON/OFF in settings.
7) Adjustable Table Text Size
The dashboard supports text scaling for cleaner viewing:
Tiny
Small
Normal
Large
Huge
Useful for different monitor sizes and chart layouts.
Colour Logic
Green
Bullish / Buy
Price above EMA
Positive MACD alignment
StochRSI Buy condition
Red
Bearish / Sell
Price below EMA
Negative MACD alignment
StochRSI Sell condition
Grey
Neutral / Mixed
No strong directional bias
This allows fast visual scanning across all timeframes.
Best Used For
This indicator is ideal for:
Multi-timeframe trend analysis
Momentum confirmation
Confluence trading
Swing trading
Intraday trading
Scalping
Breakout confirmation
Trend-following systems
Works well on:
Crypto
Forex
Indices
Stocks
Commodities
How to Use It
Step 1 – Check EMA Alignment
Look for price above or below the 20 and 50 EMA across multiple timeframes.
Step 2 – Confirm MACD Strength
Check whether MACD is fully aligned (not just crossing).
Step 3 – Confirm StochRSI Direction
Look for %K vs %D agreement.
Step 4 – Find Confluence
The strongest setups often occur when:
MA structure aligns
MACD aligns
StochRSI aligns
Higher timeframe bias supports the trade
Trading Framework Example
A strong bullish setup might show:
Price above 20 EMA
Price above 50 EMA
MACD Buy
StochRSI Buy
Weekly MA acting as support
A strong bearish setup may show the inverse.
Summary
Multi-Timeframe MA & MACD & StochRSI (Pro) is a high-confluence dashboard built for traders who want cleaner multi-timeframe trend analysis, stronger momentum confirmation, and faster market alignment in one professional workflow. Gösterge

RSI Divergence (Bull/Bear) RSI Divergence (Bull/Bear) is an advanced momentum analysis indicator that automatically detects bullish and bearish RSI divergence between price action and the Relative Strength Index (RSI). These divergence signals can help traders identify potential market reversals, trend exhaustion, and high-probability trading opportunities across multiple financial markets.
The indicator continuously analyzes swing highs and swing lows in both price and RSI, highlighting areas where momentum no longer confirms the current price movement. These conditions often appear before significant trend reversals or corrective moves.
Features
• Automatic Bullish RSI Divergence Detection
• Automatic Bearish RSI Divergence Detection
• Swing High & Swing Low Analysis
• Visual Buy & Sell Signal Labels
• Divergence Confirmation Zones
• Optional RSI Sensitivity Settings
• Clean & Lightweight Chart Layout
• Multi-Timeframe Compatible
• Non-Repainting Divergence Detection
• Customizable Signal Display
How It Works
The indicator monitors price swings alongside RSI momentum.
When price forms a **Lower Low** while RSI forms a **Higher Low**, a **Bullish Divergence** is detected, suggesting weakening selling pressure and a possible bullish reversal.
When price forms a **Higher High** while RSI forms a **Lower High**, a **Bearish Divergence** is detected, indicating weakening buying momentum and a potential bearish reversal Signals are displayed directly on the chart, allowing traders to quickly identify possible turning points.
Signal Types
🟢 Bullish Divergence
• Price makes a Lower Low
• RSI makes a Higher Low
• Possible bullish reversal
• Momentum strengthening
🔴 Bearish Divergence
• Price makes a Higher High
• RSI makes a Lower High
• Possible bearish reversal
• Momentum weakening
Best Markets
• Forex • Gold (XAUUSD) • Silver (XAGUSD)
• Crypto • Indices • Stocks • Futures
Recommended Timeframes
Scalping • M5 • M15
Intraday • M30 • H1
Swing Trading • H4 • Daily
Indicator Highlights
• Automatic RSI Divergence Detection
• Early Reversal Identification
• Visual Buy & Sell Signals
• High-Probability Momentum Analysis
• Non-Repainting Logic
• Adjustable RSI Parameters
• Beginner Friendly
• Professional Trading Tool
• Works in Trending and Ranging Markets
Suggested Trading Workflow
1. Identify the overall market trend.
2. Wait for a Bullish or Bearish RSI Divergence signal.
3. Confirm the setup using market structure, support/resistance, or candlestick confirmation.
4. Enter the trade with proper risk management and position sizing.
Notes
This indicator is designed to assist traders in identifying potential momentum shifts through RSI divergence analysis. It should be used alongside market structure, price action, and sound risk management principles. Like all technical analysis tools, it does not predict future price movements or guarantee profitable trades. Gösterge

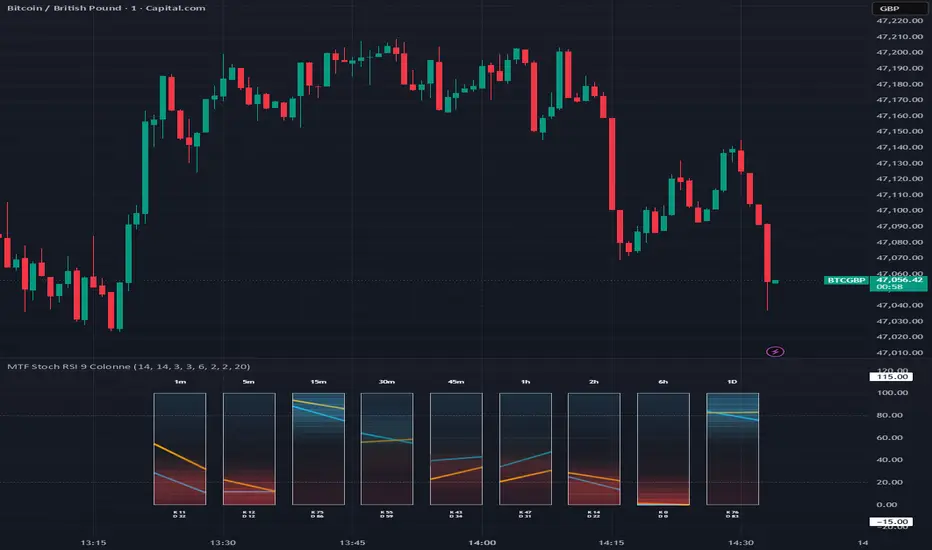
MTF Stoch RSI Snapshot 9 Timeframe OverviewThis indicator provides a compact multi-timeframe view of the Stochastic RSI across 9 different timeframes:
1m, 5m, 15m, 30m, 45m, 1h, 2h, 6h, 1D
Instead of switching between charts, the script displays all selected timeframes side by side in a clean column layout. Each column represents one timeframe and shows the current position of the two Stoch RSI lines, making it easier to quickly understand momentum conditions across multiple market structures.
Main Features
Multi-timeframe Stoch RSI visualization
9 fixed timeframe columns
K and D lines shown inside each column
Gradient background based on oscillator level
Quick visual identification of overbought and oversold areas
20 / 50 / 80 reference levels
Optional numeric K and D values
Compact layout designed for fast market reading
How to Read It
Each column represents a timeframe.
The vertical position of the lines shows where the Stoch RSI currently is:
Near the bottom: oversold / weak momentum area
Around the middle: neutral zone
Near the top: overbought / strong momentum area
The background gradient helps identify the oscillator zone immediately, while the two plotted lines allow you to see the current relationship between K and D.
This is useful when you want to compare short-term and higher-timeframe momentum at a glance.
Typical Use Cases
Scalping confirmation
Multi-timeframe momentum alignment
Spotting overbought / oversold conditions across timeframes
Filtering entries based on higher-timeframe context
Quickly checking whether short-term movement agrees with broader market structure
Notes
This indicator does not generate buy or sell signals by itself.
It is intended as a visual decision-support tool and should be used together with price action, trend analysis, support and resistance, and proper risk management.
Disclaimer
This script is for educational and informational purposes only.
It is not financial advice. Always test any trading approach carefully before using it in live markets. Gösterge

MACD & Stoch RSI Confluence S/RMACD & Stoch RSI Confluence S/R
MACD & Stoch RSI Confluence S/R draws horizontal support and resistance
levels from MACD and Stochastic RSI crossover points, then automatically
merges levels that cluster close together into a single confluence zone.
Instead of treating every crossover as an isolated signal, it highlights
the price areas where two independent momentum oscillators historically
agreed on a turning point.
━━━━━━━━━━━━━━━━━━━━━━━━━━━━━━━━
BACKGROUND — WHY CROSSOVER-BASED LEVELS?
━━━━━━━━━━━━━━━━━━━━━━━━━━━━━━━━
MACD and Stochastic RSI are both momentum oscillators, but they measure
momentum differently — MACD from the relationship between two EMAs,
Stochastic RSI from the position of RSI within its own recent range.
Because of this difference, the two oscillators don't always cross at the
same time or the same price, but when they do cross near the same price
level, it suggests that two independent calculations both detected a
shift in momentum at that point.
Traditional crossover indicators only mark the moment of the crossover
itself and then move on — the price level where it happened is rarely
preserved or revisited. This indicator instead treats every crossover
price as a potential support or resistance level going forward, on the
logic that price has already shown a reaction (a momentum shift) at that
level once, and may do so again if it returns there.
━━━━━━━━━━━━━━━━━━━━━━━━━━━━━━━━
HOW IT WORKS — TECHNICAL DETAIL
━━━━━━━━━━━━━━━━━━━━━━━━━━━━━━━━
CROSSOVER DETECTION
The indicator calculates a standard MACD (fast EMA, slow EMA, signal line)
and a standard Stochastic RSI (RSI smoothed through a Stochastic
calculation, then K/D smoothing) independently. Bullish crossovers occur
when MACD crosses above its signal line, or when Stochastic RSI's K line
crosses above its D line. Bearish crossovers are the inverse.
Each time a valid crossover occurs, the indicator looks back a
user-defined number of bars (How many bars before crossover?) and records
the low of that bar for bullish crossovers, or the high for bearish
crossovers. This offset exists because the actual turning point in price
often occurs slightly before the oscillator confirms it — anchoring the
line to the prior bar's extreme captures the reaction point more
accurately than the bar where the crossover is technically confirmed.
PROXIMITY FILTERING (PER OSCILLATOR)
Before a new level is recorded, it's checked against existing levels from
the same oscillator and same direction using an ATR-based distance
threshold. If a new crossover price falls too close to an already-recorded
level, it's discarded. This prevents a single trending move that triggers
several crossovers in quick succession from flooding the chart with
near-identical lines.
CONFLUENCE MERGING (ACROSS OSCILLATORS)
After proximity filtering, all surviving levels from both oscillators —
MACD support, MACD resistance, Stoch RSI support, Stoch RSI resistance —
are pooled together. Any levels within a percentage threshold of each
other are merged into a single line, positioned at their average price.
The merged line is labeled with the count of crossovers that contributed
to it, so a label showing "⬡3" indicates three separate crossover events —
potentially from different oscillators — all landed within the merge
threshold of one another.
This merge threshold is calculated automatically based on the chart's
timeframe: wider on higher timeframes (where price ranges are naturally
larger) and tighter on lower timeframes. A manual override is available if
you prefer a fixed percentage regardless of timeframe.
DYNAMIC COLORING
Every line — merged or single — is colored based on its position relative
to the current close. A line below price is colored as support; a line
above price is colored as resistance. Because lines extend forward in
time, a single line can change from resistance to support (or vice versa)
as price crosses through it, and the color updates automatically.
━━━━━━━━━━━━━━━━━━━━━━━━━━━━━━━━
INFO TABLE
━━━━━━━━━━━━━━━━━━━━━━━━━━━━━━━━
A table in the corner of your choice displays, for the most recent bar:
— The number of support and resistance lines currently shown for each
oscillator separately
— The nearest support and nearest resistance level to current price,
calculated from the same merged lines drawn on the chart — not a
separate calculation, so the table always matches what you see
— Whether the MACD zero-line filter and Stoch RSI overbought/oversold
filter are currently active
— Whether each oscillator is enabled
— The current merge threshold percentage and whether it was set
automatically or manually
━━━━━━━━━━━━━━━━━━━━━━━━━━━━━━━━
HOW TO USE
━━━━━━━━━━━━━━━━━━━━━━━━━━━━━━━━
1. CHOOSE WHICH OSCILLATORS TO USE
Both MACD and Stochastic RSI are enabled by default. You can disable
either one independently if you only want levels from a single
oscillator, or run both for confluence.
2. SET THE BAR OFFSET
How many bars before crossover? controls how far back from the
confirmed crossover the indicator anchors the level. Start with the
default and increase it if you find levels are consistently anchored
slightly too late relative to the actual price reaction.
3. TUNE THE PROXIMITY FILTER
The ATR Multiplier controls how close a new crossover has to be to an
existing level of the same type before it's discarded. Increase this on
choppy assets to reduce clutter; decrease it if you feel valid levels
are being filtered out.
4. APPLY OPTIONAL FILTERS IF NEEDED
The MACD Zero Line Filter restricts bullish crossovers to above the
zero line and bearish crossovers to below it, filtering out weaker
signals that occur against the broader momentum direction. The Stoch
RSI Overbought/Oversold Filter restricts crossovers to occur only in
oversold or overbought territory, focusing on reversal-type signals
rather than mid-range noise. Both are off by default — enable them if
you want fewer, more selective levels.
5. ADJUST THE MERGE THRESHOLD IF NEEDED
The automatic threshold works well across most timeframes, but if you
trade a single timeframe consistently and want more control, switch to
Manual Threshold and set a fixed percentage that matches your
instrument's typical price behavior.
6. READ THE LABELS
Single-oscillator lines are labeled "M" (MACD) or "S" (Stoch RSI).
Merged lines are labeled with a count (e.g. "⬡2", "⬡3") showing how many
crossovers — and potentially how many different oscillators — agreed on
that level. Higher counts represent stronger confluence.
━━━━━━━━━━━━━━━━━━━━━━━━━━━━━━━━
WHERE TO USE IT
━━━━━━━━━━━━━━━━━━━━━━━━━━━━━━━━
The indicator works on any asset class and any timeframe, since both
oscillators and the merge threshold are calculated directly from the
chart you have open. It's particularly useful for:
— Identifying support/resistance levels that are backed by momentum
shifts rather than purely price-action-based pivots
— Spotting confluence zones where MACD and Stoch RSI crossovers
historically aligned, which may carry more weight than a level
identified by either oscillator alone
— Confirming reactions at prior turning points — if price returns to a
level where a crossover previously occurred, the level provides context
for whether momentum may shift again
— Combining with other structure or volume-based tools as part of a
broader confluence-based approach, rather than as a standalone signal
generator
━━━━━━━━━━━━━━━━━━━━━━━━━━━━━━━━
SETTINGS REFERENCE
━━━━━━━━━━━━━━━━━━━━━━━━━━━━━━━━
MACD: Fast/Slow/Signal EMA lengths, source, bar offset, max support/
resistance lines kept, line width, colors, extend mode, ATR-based
proximity filter, zero-line filter
Stochastic RSI: RSI period, Stochastic period, K/D smoothing, source, and
the same set of line/extend/proximity/zone options as MACD
Merging: enable/disable, automatic or manual threshold, merged line color
and width
Table: show/hide, position
━━━━━━━━━━━━━━━━━━━━━━━━━━━━━━━━
ORIGINALITY
━━━━━━━━━━━━━━━━━━━━━━━━━━━━━━━━
MACD and Stochastic RSI crossovers are both well-established concepts
individually, but this script's specific contribution is treating
crossover prices as persistent support/resistance levels rather than
one-off signals, combined with a cross-oscillator confluence merge that
identifies where two independently-calculated momentum tools agreed on
the same price area. The ATR-based proximity filter and timeframe-adaptive
merge threshold are the author's own approach to keeping this practical
and readable on a live chart rather than producing chart clutter.
━━━━━━━━━━━━━━━━━━━━━━━━━━━━━━━━
DISCLAIMER
━━━━━━━━━━━━━━━━━━━━━━━━━━━━━━━━
This indicator is intended for educational and analytical purposes only.
No indicator can predict future market movements with certainty. Always
use proper risk management and combine multiple forms of analysis before
making trading decisions. Gösterge

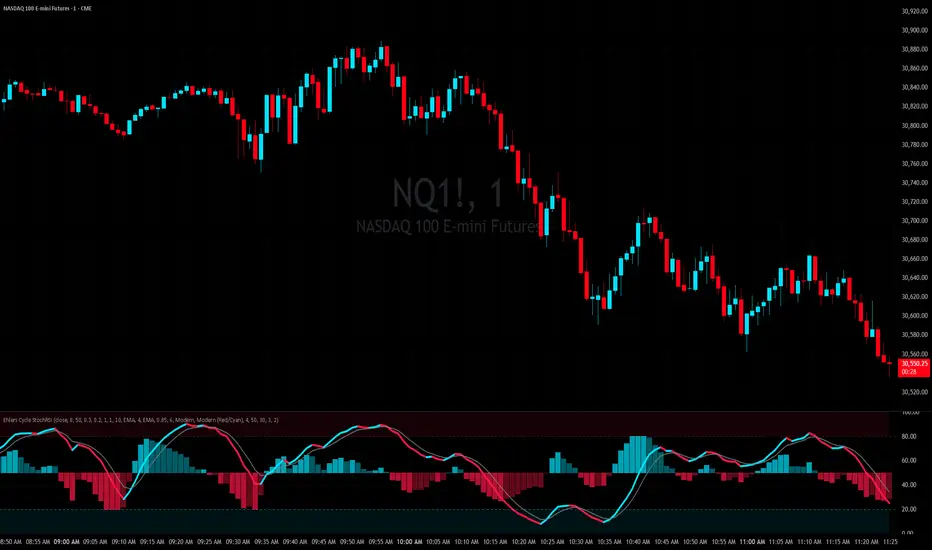
Ehlers Dominant Cycle Stochastic RSI v2Ehlers Dominant Cycle Stochastic RSI
Summary
An adaptive Stochastic RSI whose lengths are set by the market's measured dominant cycle rather than by a fixed input. The indicator continuously estimates the dominant cycle period in price and feeds that period directly into the RSI and Stochastic calculations, so the oscillator's lookback adjusts as the underlying cycle shortens or lengthens across symbols and timeframes.
The Inspiration — John Ehlers
The indicator is built on the digital signal processing work of John Ehlers, who treated price as a waveform and applied engineering filters to extract its underlying cycle. Rather than rely on a single cycle estimate, it runs three independent measurement methods in parallel:
Hilbert Transform homodyne discriminator — Ehlers' classic dominant-cycle estimator
Autocorrelation Periodogram — Pearson correlation across lags to identify the repeating period
Goertzel / DFT power spectrum — a frequency-domain scan for the strongest cycle
Before measurement, price is conditioned with Ehlers' filter set: a Super Smoother filter, a Highpass filter to remove the trend (DC) component, and an optional Bandpass "spectral dilation" pre-filter to isolate the cycle band. The three estimates are then cross-checked. When they agree, their values are blended into a single confirmed period; when they diverge, outliers are down-weighted before the result is smoothed.
Features
Triple cycle detection with confirmation — Hilbert, Autocorrelation, and DFT run together, with a 0–100% confidence score reflecting how closely they agree
Confidence-weighted period blending — each method is weighted by agreement and correlation strength, then smoothed into one cycle period
Adaptive RSI & Stochastic lengths — both derive from the detected cycle, with independent multipliers (e.g. 0.5× for half-cycle, 1.0× for full-cycle)
Spectral dilation pre-filter — optional bandpass with adjustable bandwidth for tighter cycle isolation
Momentum histogram — normalized K−D centered on the midline, with bars that fade as momentum stalls
OB/OS zone shading
Performance controls — recalc interval and DFT window settings to manage the spectral scans
Gösterge

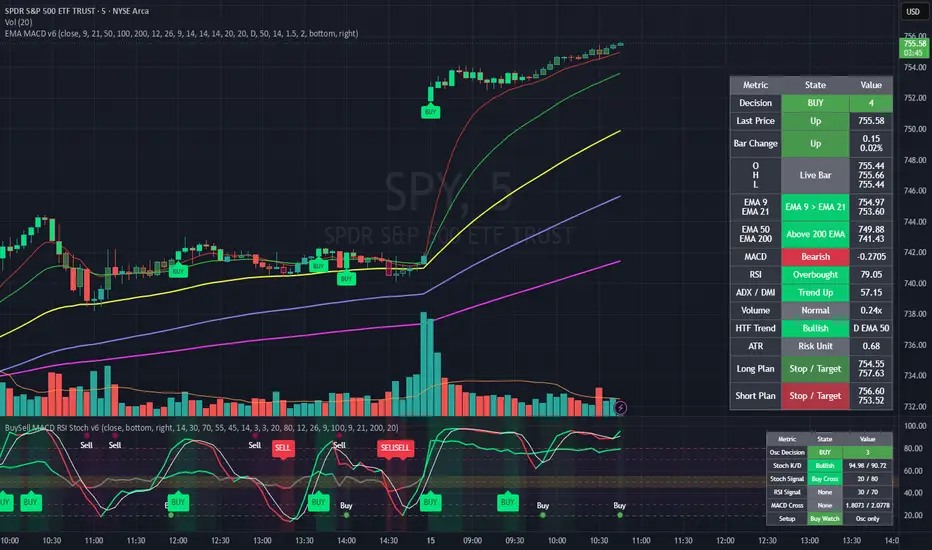
MACD RSI Stochastic Buy/Sell Timing TableBuy/Sell MACD RSI Stochastics v6
This Pine Script v6 oscillator-pane indicator focuses on timing signals using RSI, Stochastic, MACD, optional EMA trend confirmation, and optional volume confirmation.
The script combines RSI levels and threshold crosses, Stochastic %K / %D relationships and crosses, MACD line / signal / histogram logic, buy and sell setup markers, strong buy and strong sell markers, a compact oscillator decision table, alerts, and Data Window values.
It calculates a numeric oscillator score on every bar. Bullish confirmations add points, bearish confirmations subtract points, and the final score is converted into Strong Buy, Buy / Watch Long, Neutral / Wait, Sell / Watch Short, or Strong Sell.
Strong BUY markers appear when the score first reaches Strong Buy territory. Strong SELL markers appear when the score first reaches Strong Sell territory. Smaller Buy and Sell setup markers appear when the score first reaches watch-long or watch-short territory.
This tool is designed for timing context and trade planning. It is not financial advice and does not guarantee trade results.
Scoring Logic
Condition | Score
--- | ---
RSI is at or above the bull bias level | +2
RSI is at or below the bear bias level | -2
RSI crosses above the buy level | +1
RSI crosses below the sell level | -1
Stochastic K is above D and K is above 50 | +2
Stochastic K is below D and K is below 50 | -2
Stochastic K crosses above D before the sell level | +1
Stochastic K crosses below D after the buy level | -1
Stochastic crosses above the buy level | +1
Stochastic crosses below the sell level | -1
MACD is above signal and histogram is above 0 | +2
MACD is below signal and histogram is below 0 | -2
MACD bullish crossover | +1
MACD bearish crossover | -1
EMA trend filter is bullish when enabled | +1
EMA trend filter is bearish when enabled | -1
Volume confirmation is bullish when enabled | +1
Volume confirmation is bearish when enabled | -1
Decision Output
Score Range | Decision | Pane Background | Decision Table Background
--- | --- | --- | ---
>= 6 | Strong Buy | Bright green | Bright lime
3 to 5 | Buy / Watch Long | Light green | Green
-2 to 2 | Neutral / Wait | No background | Gray
-3 to -5 | Sell / Watch Short | Light maroon/red | Maroon
<= -6 | Strong Sell | Bright red | Bright red
The pane background and decision table background use the same oscillator score ranges. The pane background is more transparent so the oscillator lines remain readable.
RSI Logic
RSI Level | Meaning
--- | ---
30 | Buy threshold
45 | Bear bias threshold
55 | Bull bias threshold
70 | Sell threshold
RSI contributes bullish score when it is above the bull bias level and bearish score when it is below the bear bias level.
An RSI cross above the buy level adds a smaller bullish timing point. An RSI cross below the sell level adds a smaller bearish timing point.
Stochastic Logic
Stochastic is bullish when %K is above %D and %K is above 50.
Stochastic is bearish when %K is below %D and %K is below 50.
Stochastic Event | Meaning
--- | ---
%K crosses above %D before the sell level | Bullish timing confirmation
%K crosses below %D after the buy level | Bearish timing confirmation
Stochastic crosses above the buy level | Bullish threshold confirmation
Stochastic crosses below the sell level | Bearish threshold confirmation
MACD Logic
MACD is bullish when the MACD line is above the signal line and the histogram is positive.
MACD is bearish when the MACD line is below the signal line and the histogram is negative.
A MACD line crossover above the signal line adds a bullish timing point. A cross below the signal line adds a bearish timing point.
MACD can be normalized for display so it fits in the same oscillator pane as RSI and Stochastic. The raw MACD values remain available in the Data Window.
EMA Trend Filter Logic
When enabled, the EMA trend filter checks the fast EMA, slow EMA, and long trend EMA.
Filter State | Condition
--- | ---
Bullish | Fast EMA above slow EMA and price above long trend EMA
Bearish | Fast EMA below slow EMA and price below long trend EMA
Disabled | Does not affect the score
Volume Logic
When enabled, volume confirmation compares current volume against average volume.
Volume State | Condition
--- | ---
Bullish confirmation | Above-average volume with a bullish candle
Bearish confirmation | Above-average volume with a bearish candle
No confirmation | Normal or low-volume candle
Disabled | Does not affect the score
Visual Output
The oscillator pane can show RSI, Stochastic %K, Stochastic %D, optional normalized MACD line and signal line, optional normalized MACD histogram, green or red background based on the decision score, Buy / Sell setup markers, and Strong BUY / SELL markers.
Green background means the oscillator score is bullish. Red background means the oscillator score is bearish. Stronger color appears when the score reaches strong buy or strong sell territory.
Decision Table Rows
Row | What It Shows | How To Read It
--- | --- | ---
Osc Decision | Final oscillator decision and oscillator score | Main timing summary. Strong Buy / Buy means momentum confirmations are bullish. Strong Sell / Sell means momentum confirmations are bearish. Neutral means timing is mixed.
Stoch K/D | Current Stochastic %K and %D relationship, plus both values | Bullish means %K is above %D and %K is above 50. Bearish means %K is below %D and %K is below 50. Mixed means the condition is not directional enough.
Stoch Signal | Whether Stochastic created a buy cross, sell cross, or no fresh cross | Buy Cross appears when %K crosses above %D or above the buy level. Sell Cross appears when %K crosses below %D or below the sell level. None means no fresh Stochastic cross is active.
RSI Signal | Whether RSI crossed the configured buy or sell threshold | Buy Cross appears when RSI crosses above the buy level. Sell Cross appears when RSI crosses below the sell level. None means no fresh RSI threshold cross is active.
MACD Cross | Whether MACD crossed its signal line, plus raw MACD and signal values | Bull Cross means MACD crossed above signal. Bear Cross means MACD crossed below signal. None means no fresh MACD crossover is active.
Setup | Trade-watch state produced by the oscillator score | Strong Buy and Strong Sell are the strongest timing states. Buy Watch and Sell Watch are earlier setup states. Wait means there is not enough directional agreement.
Use the table as a timing tool. It is strongest when the oscillator decision agrees with broader chart-level trend context.
Data Window Values
When enabled, the script exposes Decision Score, Decision Code, MACD Raw, MACD Signal Raw, and MACD Histogram Raw.
Code | Meaning
--- | ---
2 | Strong Buy
1 | Buy
0 | Neutral
-1 | Sell
-2 | Strong Sell
Alert Logic
The script includes alerts for Strong Buy Decision, Strong Sell Decision, Buy Setup, Sell Setup, RSI Buy Cross, RSI Sell Cross, Stochastic Buy Cross, Stochastic Sell Cross, MACD Bullish Cross, and MACD Bearish Cross.
Strong decision alerts come from the oscillator score entering strong buy or strong sell territory. Setup alerts come from the score entering watch-long or watch-short territory. Indicator cross alerts are based on their individual RSI, Stochastic, or MACD crossover conditions.
Reading The Output
This script is mainly a timing tool. Bullish output is strongest when RSI, Stochastic, MACD, trend filter, and volume all align. Bearish output is strongest when those same components align to the downside.
When used with the EMA MACD Decision Table script, the chart-level table gives broader trend context and this oscillator gives timing confirmation.
Gösterge

Strateji

Gösterge

Gösterge

Rsi centaurRSI centaur is a visual RSI-based oscillator designed to make momentum extremes, mean reversion zones, midline shifts, and confirmed divergences easier to read on one clean panel.
The indicator uses an adaptive RSI calculation based on Gaussian-weighted price changes. Instead of treating every past bar with the same importance, the RSI core applies a smooth weighting curve to recent gains and losses. This gives the oscillator a slightly different feel from a standard RSI while keeping the logic familiar for traders who already use momentum tools.
A signal line can be enabled to help read short-term smoothing. The panel also includes multiple dashed reference levels at 90, 85, 80, 75, 70, 50, 30, 25, 20, 15, and 10. These levels are not meant to be automatic buy or sell zones by themselves. They are visual areas where momentum may be extended, exhausted, or returning toward balance.
Main features:
- Adaptive Gaussian-weighted RSI oscillator
- Optional RSI-based signal line
- Configurable overbought and oversold guide levels
- Entry circles when RSI enters extreme zones
- Exit circles when RSI leaves extreme zones
- Midline dots when RSI crosses the 50 level
- Confirmed bullish and bearish RSI divergences
- Classic, hidden, and exaggerated divergence modes
- Alerts for entries, exits, midline crosses, divergences, and any signal
How to read it:
When RSI moves above 70, momentum is usually strong on the upside. If it continues into 75, 80, 85, or 90, the market is becoming more extended. A circle appearing when RSI comes back under one of these upper levels can be used as a warning that upside momentum is cooling.
When RSI moves below 30, downside momentum is usually strong. If it continues into 25, 20, 15, or 10, the market is becoming more extended to the downside. A circle appearing when RSI comes back above one of these lower levels can be used as a warning that bearish pressure is weakening.
The 50 line is used as a simple momentum balance level. Crosses above 50 suggest that the oscillator is moving back into bullish momentum territory. Crosses below 50 suggest that the oscillator is moving back into bearish momentum territory.
Beginner example 1:
Price has been falling and the RSI drops below 20. This does not automatically mean the market should be bought. A more conservative read is to wait until RSI crosses back above 20 or 25, then check whether price is also reacting from a support zone, previous low, or other market structure level.
Beginner example 2:
Price makes a new high, but the RSI makes a lower high. If a bearish divergence is confirmed, it can warn that the upward move is losing momentum. This is not a sell signal by itself, but it can help traders become more cautious with long positions or look for confirmation from price action.
Beginner example 3:
RSI crosses above 50 after spending time below it. This can show that momentum is shifting back toward the upside. If price is also above a key moving average or breaking a local structure level, the midline cross may support a bullish scenario.
About divergences:
Divergences are based on confirmed RSI pivots. Because pivots require confirmation, divergence labels appear only after the confirmation bars have closed. This makes them cleaner, but it also means they are not intended to mark the exact top or bottom in real time.
Suggested use:
Centaur RSI is best used as a momentum and context tool. It can help identify overextended conditions, momentum recovery, and possible divergence areas. It should be combined with price structure, trend direction, volume, or support and resistance analysis before making trading decisions.
Limitations:
No RSI tool can predict future price movement. Strong trends can keep RSI overbought or oversold for a long time. Divergences can also fail during high momentum markets. The indicator is designed to provide visual context, not guaranteed entries or exits. Gösterge