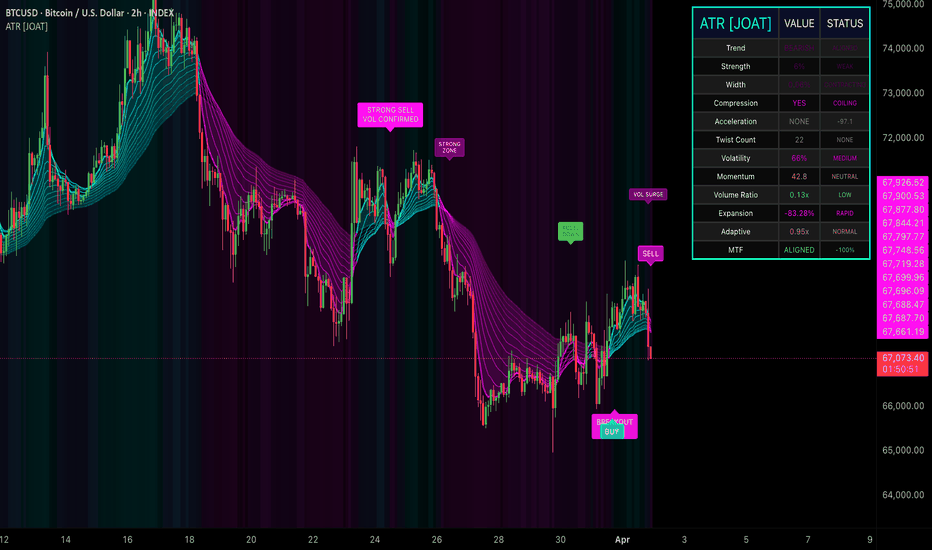
Adaptive Trend Ribbon [JOAT]Adaptive Trend Ribbon
Introduction
The Adaptive Trend Ribbon is an advanced open-source trend-following indicator that combines multi-layer moving average analysis with real-time volatility adaptation, momentum weighting, and volume confirmation. This indicator transforms traditional ribbon systems into an institutional-grade tool by dynamically adjusting to market conditions, providing traders with a comprehensive view of trend strength, direction, and potential reversals across all timeframes.
Unlike static ribbon indicators that use fixed parameters, this system continuously adapts to volatility percentiles, momentum shifts, and volume surges, creating a responsive framework that works equally well in ranging, trending, and explosive market conditions. The indicator is designed for traders who understand that market regimes change and that adaptive systems outperform static ones in real-world trading.
Why This Indicator Exists
This indicator addresses critical limitations in traditional moving average systems by introducing adaptive intelligence that responds to market microstructure. The core innovation lies in combining multiple adaptation mechanisms:
Volatility Adaptation: Ribbon parameters adjust based on ATR percentile ranking, expanding during high volatility and contracting during consolidation
Momentum Adaptation: RSI-based momentum weighting modifies ribbon sensitivity to capture acceleration and deceleration phases
Volume Adaptation: Volume ratio analysis confirms trend validity and filters false signals during low-participation moves
Multi-Timeframe Alignment: Higher timeframe trend confirmation across three customizable periods validates directional conviction
Ribbon Compression Detection: Identifies coiling patterns that precede explosive breakouts with statistical precision
Twist Reversal System: Detects ribbon layer crossovers that signal potential trend exhaustion or reversal
Each adaptation layer provides unique intelligence. Volatility adaptation ensures the ribbon remains relevant across different market regimes, momentum adaptation captures trend acceleration, volume adaptation confirms institutional participation, MTF alignment validates conviction, compression detection anticipates breakouts, and twist detection warns of reversals.
Core Components Explained
1. Adaptive Multiplier System
The indicator calculates three distinct adaptation factors that combine into a unified multiplier:
Volatility Multiplier: Based on ATR percentile ranking over 100 bars, this factor increases ribbon responsiveness during high volatility periods and decreases it during low volatility. The calculation uses percentile ranking rather than raw ATR to normalize across different instruments and timeframes.
Momentum Multiplier: Derived from RSI deviation from the 50 midpoint, this factor amplifies ribbon sensitivity during strong momentum phases and dampens it during consolidation. The normalization ensures the multiplier remains bounded and predictable.
Volume Multiplier: Calculated as the ratio of current volume to 20-period average volume, capped at 2x to prevent extreme distortions. This factor confirms that price movements are supported by genuine participation rather than thin-market noise.
The combined adaptive multiplier averages these three factors, creating a balanced response to multiple market dimensions simultaneously. This multi-factor approach prevents over-optimization to any single market characteristic.
2. Multi-Layer Ribbon Construction
The ribbon consists of 3 to 20 customizable moving average layers (default 12) spanning from a fast length (default 5) to a slow length (default 55). The indicator supports five moving average types:
EMA (Exponential Moving Average): Responsive to recent price action, ideal for trending markets
SMA (Simple Moving Average): Equal weighting, provides stable trend identification
WMA (Weighted Moving Average): Linear weighting favoring recent data
VWMA (Volume-Weighted Moving Average): Incorporates volume into price averaging
HMA (Hull Moving Average): Reduced lag through weighted calculations and square root periods
Each ribbon layer is calculated with evenly distributed periods between fast and slow lengths. The spacing ensures smooth gradient transitions and prevents clustering that can create false signals. The ribbon can optionally use Heikin Ashi candles as the source, providing additional smoothing for noisy instruments.
3. Trend Detection and Classification
The indicator employs multiple trend detection mechanisms:
Ribbon Trend: Determined by comparing the fastest MA to the slowest MA. When fast > slow, the ribbon trend is bullish; when fast < slow, it's bearish.
Price Trend: Determined by comparing current price to the middle ribbon layer. This provides confirmation that price is aligned with the ribbon structure.
Aligned Trend: Occurs when both ribbon trend and price trend agree, indicating high-probability directional moves.
Trend strength is measured using percentile ranking of ribbon width over 50 bars. Higher percentile rankings indicate stronger trends with greater separation between ribbon layers, while lower rankings suggest consolidation or trend exhaustion.
4. Ribbon Metrics and Analysis
The indicator calculates comprehensive ribbon metrics:
Ribbon Width: Absolute distance between fastest and slowest MAs, providing a raw measure of trend strength.
Ribbon Width Percent: Width expressed as a percentage of current price, normalizing across different price levels and instruments.
Ribbon Strength: Percentile ranking of width percent over 50 bars, showing relative strength compared to recent history.
Compression Detection: Identifies when ribbon width falls below its 20-period average, signaling potential energy buildup before breakouts.
Expansion Rate: Measures the rate of change in ribbon width, identifying acceleration or deceleration in trend development.
These metrics work together to provide a complete picture of trend dynamics, from initiation through maturation to exhaustion.
5. Twist Detection System
The twist detection system identifies potential reversals by counting crossovers between adjacent ribbon layers. When multiple layers cross simultaneously (threshold: 50% of total layers), it signals a "twist" - a condition where the ribbon is reorganizing its structure, often preceding significant directional changes.
The system tracks twist count cumulatively, allowing traders to identify instruments or timeframes experiencing frequent regime changes versus those in stable trends. High twist counts suggest choppy, range-bound conditions, while low twist counts indicate clean trending environments.
6. Trend Acceleration Detection
Trend acceleration is measured using rate-of-change calculations on the middle ribbon layer:
Trend Momentum: 5-period rate of change of the mid-ribbon MA
Trend Acceleration: 3-period rate of change of trend momentum (second derivative)
When acceleration exceeds one standard deviation of its 20-period history, the indicator flags accelerating conditions. This early warning system helps traders identify when trends are gaining steam versus when they're losing momentum, even if price continues in the same direction.
7. Multi-Timeframe Alignment
The indicator requests ribbon trend data from three higher timeframes (default: 15m, 60m, 240m) and calculates an alignment score. The score ranges from -1 (all timeframes bearish) to +1 (all timeframes bullish), with values near zero indicating mixed or transitional conditions.
MTF alignment above 0.75 or below -0.75 indicates strong multi-timeframe conviction, suggesting high-probability directional moves. This feature is particularly valuable for swing traders who need confirmation that their trade direction aligns with higher timeframe structure.
Visual Elements
Ribbon Lines: Up to 20 gradient-colored MA lines with transparency increasing from fast to slow, creating a visual "ribbon" effect
Cloud Fill: Filled area between fastest and slowest MAs, colored based on trend direction and strength
Signal Labels: Text-based labels for crossovers, twists, compression breakouts, and extreme conditions
Background Heatmap: Optional gradient background showing ribbon strength intensity
Compression Zones: Subtle background highlighting during ribbon compression periods
MTF Alignment Background: Very subtle background when multi-timeframe alignment is strong
Comprehensive Dashboard: Real-time metrics table showing trend, strength, width, compression status, acceleration, twist count, volatility, momentum, volume ratio, expansion rate, adaptive factor, and MTF alignment
The dashboard displays 12 key metrics with color-coded values and status indicators, providing at-a-glance assessment of all ribbon dimensions simultaneously.
Input Parameters
Core Settings:
Ribbon Count: Number of MA layers (3-20, default 12)
Fast Length: Shortest MA period (2-50, default 5)
Slow Length: Longest MA period (10-200, default 55)
MA Type: EMA, SMA, WMA, VWMA, or HMA (default EMA)
Adaptation Settings:
Adapt to Volatility: Enable/disable ATR-based adaptation (default enabled)
Adapt to Momentum: Enable/disable RSI-based adaptation (default enabled)
Adapt to Volume: Enable/disable volume ratio adaptation (default enabled)
Use Heikin Ashi: Calculate ribbon using HA candles instead of regular OHLC (default disabled)
Display Options:
Show Cloud: Toggle ribbon cloud fill (default enabled)
Show Ribbon Lines: Toggle individual MA lines (default enabled)
Show Signals: Toggle entry/exit signal labels (default enabled)
Show Twists: Toggle twist reversal markers (default enabled)
Show Compression: Toggle compression breakout signals (default enabled)
Show Dashboard: Toggle metrics table (default enabled)
Show Heatmap: Toggle strength-based background gradient (default enabled)
Multi-Timeframe:
Enable MTF: Toggle multi-timeframe analysis (default enabled)
HTF 1/2/3: Three higher timeframe selections (default 15m, 60m, 240m)
Colors:
All colors are fully customizable including bull ribbon (neon cyan), bear ribbon (neon pink), twist (gold), compression (neon purple), and acceleration (neon green).
How to Use This Indicator
Step 1: Assess Ribbon Direction and Alignment
Check the dashboard "Trend" field and observe ribbon color. Bullish ribbon (cyan) indicates uptrend, bearish ribbon (pink) indicates downtrend. Verify that price is aligned with ribbon direction - price above ribbon in uptrends, below in downtrends.
Step 2: Evaluate Trend Strength
Monitor the "Strength" metric in the dashboard. Values above 70 indicate strong trends with high conviction, 40-70 suggests moderate trends, below 40 indicates weak or developing trends. Strong trends typically offer better risk/reward for trend-following entries.
Step 3: Watch for Compression Breakouts
When the dashboard shows "Compression: YES" and "Width" is contracting, prepare for potential breakout. Compression breakout signals appear when ribbon expands after coiling, often marking the start of new trend legs. These setups offer excellent risk/reward as stops can be placed tight to the compression zone.
Step 4: Identify Twist Reversals
Twist signals (gold labels) indicate ribbon layers are crossing, suggesting potential trend exhaustion or reversal. High twist counts in the dashboard suggest choppy conditions where trend-following strategies may underperform. Use twists as warnings to tighten stops or reduce position size.
Step 5: Confirm with Multi-Timeframe Alignment
Check MTF alignment in the dashboard. "ALIGNED" status with high percentage (>75%) confirms that higher timeframes support your trade direction. "MIXED" status suggests caution as higher timeframes may be in conflict with current timeframe trend.
Step 6: Monitor Acceleration Signals
Acceleration labels (neon green) indicate trend momentum is increasing. These often appear early in new trend legs and can signal optimal entry timing. Lack of acceleration in mature trends may warn of impending exhaustion.
Step 7: Use Volume Confirmation
Check "Volume Ratio" in dashboard. Ratios above 1.5x confirm strong participation, while ratios below 0.8x suggest weak participation. Volume-confirmed signals (labeled "STRONG BUY/SELL") offer higher probability than signals on low volume.
Best Practices
Use on liquid instruments with consistent volume patterns for most reliable adaptation
Combine with price action analysis - ribbon shows trend, price action shows entry timing
In ranging markets, reduce ribbon count and increase fast/slow length spread to filter noise
In trending markets, increase ribbon count for finer gradient visualization
Pay attention to compression zones near key support/resistance levels for high-probability breakout setups
Use MTF alignment as a filter - only take trades when alignment exceeds 75% in your direction
Twist signals are most reliable when they occur at extreme ribbon strength levels (>70 or <30)
Monitor adaptive factor in dashboard - values above 1.3 indicate high adaptation, below 0.9 indicate low adaptation
Heikin Ashi mode reduces noise but adds lag - use for very choppy instruments only
Acceleration signals work best in early trend phases, less reliable in mature trends
Volume ratio below 0.5 suggests thin liquidity - avoid new positions during these periods
Ribbon width expansion rate above 5% indicates strong trend acceleration
Indicator Limitations
Moving average-based systems inherently lag price action - ribbon confirms trends but doesn't predict them
Adaptation mechanisms require sufficient historical data - may be less reliable on newly listed instruments
MTF analysis requires data availability on all selected timeframes - some instruments may not support all timeframes
Compression detection can produce false signals in extremely low volatility environments
Twist detection sensitivity depends on ribbon count - too few layers may miss twists, too many may over-signal
Volume adaptation assumes volume data is accurate and representative - some instruments have unreliable volume
Heikin Ashi mode adds significant lag and should be used cautiously
Adaptive multiplier can become extreme during unusual market conditions - monitor dashboard values
The indicator shows what is happening, not why - fundamental catalysts can override technical ribbon signals
Ribbon crossovers can whipsaw in ranging markets - use compression detection to filter range-bound periods
Technical Implementation
Built with Pine Script v6 using:
Custom MA calculation function supporting five MA types with dynamic length parameters
Multi-factor adaptive multiplier combining volatility, momentum, and volume dimensions
Percentile-based strength calculations for normalized cross-instrument comparison
Compression detection using rolling average width comparison
Twist detection via adjacent layer crossover counting
Multi-timeframe security requests with proper lookahead settings to prevent future data leakage
Trend acceleration using rate-of-change and second derivative calculations
Dynamic color gradients based on strength percentile ranking
Comprehensive dashboard with 12 real-time metrics and color-coded status indicators
Persistent label system to prevent label proliferation and maintain chart clarity
The code is fully open-source and extensively commented for educational purposes and customization.
Originality Statement
This indicator is original in its comprehensive adaptive approach to ribbon analysis. While moving average ribbons are an established concept, this indicator is justified because:
It introduces multi-factor adaptation (volatility + momentum + volume) not found in standard ribbon indicators
The compression detection system provides statistical breakout anticipation beyond simple width measurement
Twist detection quantifies ribbon reorganization to identify reversal conditions systematically
Multi-timeframe alignment scoring provides conviction measurement across temporal dimensions
Trend acceleration tracking using second derivatives offers early momentum shift detection
The adaptive multiplier system creates a self-adjusting framework that works across all market regimes
Integration of five MA types with Heikin Ashi option provides unprecedented flexibility
The comprehensive dashboard synthesizes 12 distinct metrics into a unified intelligence panel
Persistent label system prevents chart clutter while maintaining signal visibility
Volume confirmation layer filters false signals during low-participation moves
Each component contributes unique intelligence: adaptation ensures relevance across regimes, compression detects energy buildup, twists warn of reversals, MTF alignment validates conviction, acceleration identifies momentum shifts, and the dashboard synthesizes everything into actionable intelligence. The indicator's value lies in combining these complementary perspectives into a cohesive, adaptive trend-following system.
Disclaimer
This indicator is provided for educational and informational purposes only. It is not financial advice or a recommendation to buy or sell any financial instrument. Trading involves substantial risk of loss and is not suitable for all investors.
Moving average-based systems are lagging indicators that confirm trends rather than predict them. Strong ribbon signals do not guarantee profitable trades. Past ribbon performance does not guarantee future ribbon performance. Market conditions change, and strategies that worked historically may not work in the future.
The metrics displayed are mathematical calculations based on current market data, not predictions of future price movement. Ribbon alignment, compression breakouts, and twist signals do not guarantee profitable trades. Users must conduct their own analysis and risk assessment before making trading decisions.
Always use proper risk management, including stop losses and position sizing appropriate for your account size and risk tolerance. Never risk more than you can afford to lose. Consider consulting with a qualified financial advisor before making investment decisions.
The author is not responsible for any losses incurred from using this indicator. Users assume full responsibility for all trading decisions made using this tool.
-Made with passion by officialjackofalltrades Gösterge
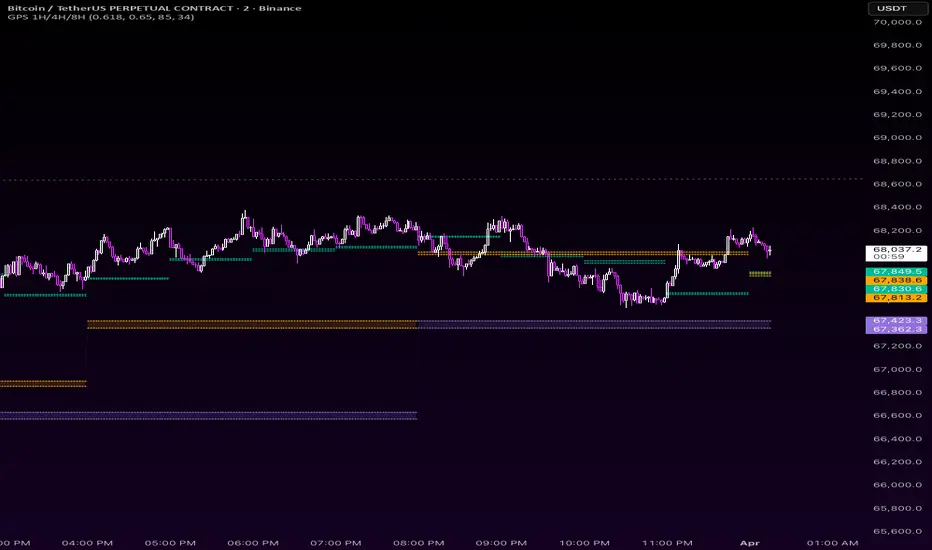
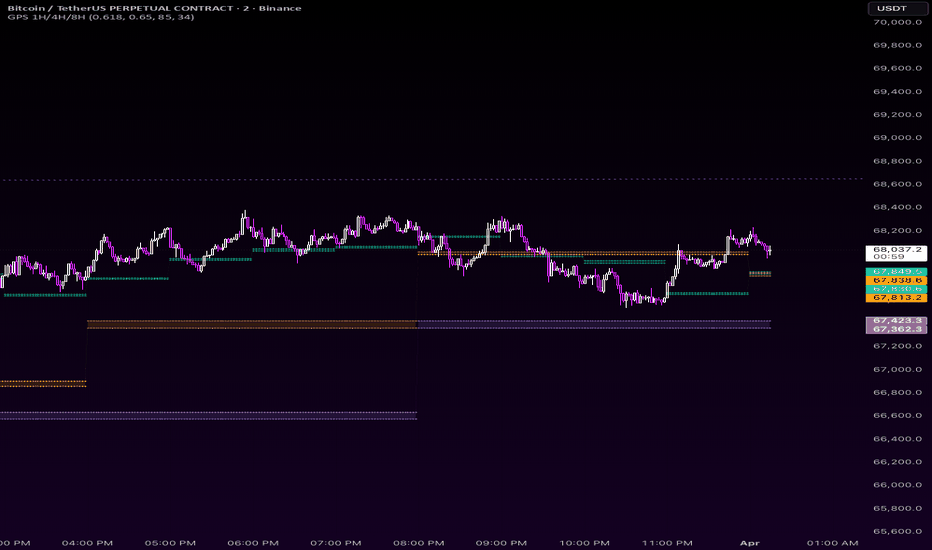
Golden Pocket Syndicate Mini (GPSM)This indicator is an overlay toolkit that combines multi-timeframe Golden Pocket-style zones (Fibonacci-derived ranges between user-defined high/low ratios), optional GP-anchored VWAPs that reset when price interacts with the matching zone, and a confluence framework with optional visuals (signals, divergences, order-block-style markers, sweeps, trails). It is intended to help traders see where higher-timeframe ranges and optional filters overlap on the chart—not to automate trading or promise outcomes.
What it does
Pulls prior completed higher-timeframe highs/lows via request.security() and derives upper/lower pocket levels from your fib inputs.
Plots pocket bands (and fills where used) for the timeframes you enable.
Optionally plots volume-weighted averages anchored to touches of the corresponding pocket.
Combines user-toggled filters into a confluence score and optional bull/bear markers; all signal logic can be turned off in settings.
How to use
Open settings, enable only the pocket timeframes and visuals you need. Adjust fib inputs, touch tolerance, and filter groups to match your process. If you use alerts, treat them as notifications only—confirm every trade in your own plan.
Important limitations
This is not financial, investment, or tax advice. Markets involve risk; past or hypothetical chart behavior does not guarantee future results.
Higher-timeframe data and request.security() behavior depend on symbol, session, and chart timeframe. Validate outputs on your instruments before relying on them.
Scripts cannot execute orders; you are responsible for compliance, sizing, and risk.
Companion
For separate 1H / 4H / 8H pocket bands (to reduce plot limits when combined with heavy scripts), use the author’s “Golden Pocket Syndicate mini” (GPSM) publication if offered.
Golden Pocket Syndicate mini (GPSM) — public description
Use this in the publication description field (English first).
GPSM is a lightweight companion overlay focused on 1-hour, 4-hour, and 8-hour Golden Pocket-style zones: two fib ratios applied to the prior completed bar’s range on each timeframe, with optional filled bands and optional GP-anchored VWAPs (off by default) that reset when price touches the matching pocket. The 1-hour band can optionally switch color using a simple prior closed 1H close vs EMA rule so you can see a regime-style split at a glance.
What it does
Uses request.security() on "60", "240", and "480" minute timeframes with the same prior-bar anchoring idea as the author’s main GPS Pro script.
Keeps the script small so it can run alongside heavier indicators without hitting Pine’s plot limits as quickly.
How to use
Add it to your chart, toggle 1H/4H/8H zones and fills, then optionally enable individual VWAPs. Match fib settings to your main workflow if you use GPS Pro on the same chart.
Important limitations
Not financial advice. No performance or profitability claims. Past chart behavior does not predict future prices.
HTF behavior varies by symbol and session (especially 8H). Confirm levels on your market.
You are solely responsible for trading decisions and risk.
Relationship to GPS Pro
GPSM does not duplicate the full confluence, SMC filters, or alerts stack from GPS Pro; it is meant as a focused HTF pocket + optional VWAP add-on. Gösterge
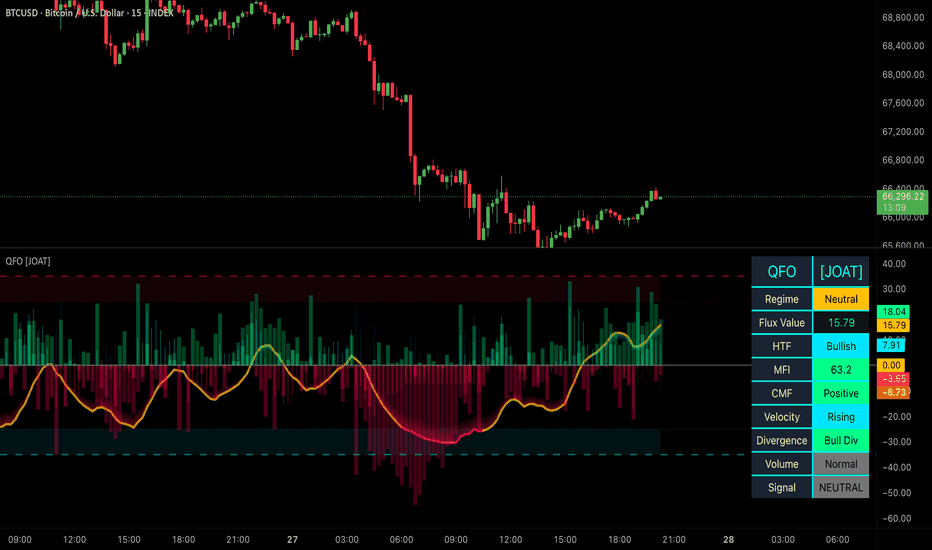
Quantum Flux Oscillator [JOAT]Quantum Flux Oscillator
Introduction
The Quantum Flux Oscillator is an advanced open-source momentum detection system that synthesizes six distinct analytical methodologies into a unified institutional-grade oscillator. This indicator combines Volume Flux Indicator (VFI), Laguerre RSI, Fisher Transform, True Strength Index (TSI), Money Flow Index (MFI), and On-Balance Volume (OBV) with Accumulation/Distribution analysis to create a comprehensive momentum engine that reveals institutional positioning and market regime shifts.
Unlike traditional single-dimension oscillators, the Quantum Flux Oscillator provides multi-layered momentum intelligence through weighted composite calculations, regime classification, velocity tracking, and divergence detection. The indicator is designed for traders who understand that momentum precedes price and that institutional footprints can be detected through systematic multi-indicator confluence.
Why This Indicator Exists
This indicator addresses a critical gap in momentum analysis: the ability to detect institutional momentum shifts before they become obvious to retail traders. By combining multiple momentum methodologies with volume-weighted analysis, this indicator reveals:
Volume Flux Intelligence: Detects unusual volume-price relationships that signal institutional activity
Laguerre RSI: Zero-centered adaptive RSI that responds faster to price changes while filtering noise
Fisher Transform: Converts momentum into a Gaussian normal distribution for clearer extreme identification
True Strength Index: Double-smoothed momentum that separates genuine trends from noise
Money Flow Analysis: Tracks buying and selling pressure through volume-weighted price movements
Volume Confirmation: Integrates OBV and A/D Line to confirm momentum with volume flow
Regime Classification: Categorizes market conditions as Extreme Bull, Bullish, Neutral, Bearish, or Extreme Bear
Multi-Timeframe Alignment: Confirms momentum across higher timeframes for conviction measurement
Each component provides a different perspective on momentum. VFI shows volume-driven momentum, Laguerre RSI shows adaptive momentum, Fisher Transform shows statistical extremes, TSI shows smoothed directional momentum, MFI shows money flow momentum, and OBV/A/D show cumulative volume momentum. Together, they create a comprehensive view of institutional momentum positioning.
Core Components Explained
1. Volume Flux Indicator (VFI)
VFI measures the relationship between price movement and volume to identify institutional accumulation or distribution. The calculation uses logarithmic price changes and volume cutoffs to filter significant moves:
The indicator classifies volume-price relationships by comparing actual volume against average volume with a cutoff threshold. When price moves significantly with volume above the cutoff, it signals institutional participation. VFI is scaled and smoothed to create a momentum baseline that responds to volume-confirmed price movements.
2. Laguerre RSI (Zero-Centered)
Laguerre RSI applies a four-stage Laguerre filter to price data, creating an adaptive RSI that responds faster to recent price changes while maintaining smoothness. The zero-centered output ranges from -50 to +50, making it easier to identify bullish and bearish momentum:
The Laguerre filter uses a gamma parameter (default 0.4) to control responsiveness. Lower gamma values create faster response, while higher values create smoother output. The zero-centered format allows direct comparison with other momentum components.
3. Fisher Transform
The Fisher Transform converts the composite momentum into a Gaussian normal distribution, making extreme values more identifiable. This transformation compresses the middle range and expands the tails, creating clearer overbought and oversold signals:
The Fisher Transform output oscillates around zero with extreme values typically beyond +2 and -2. These extremes often precede reversals as momentum reaches unsustainable levels.
4. True Strength Index (TSI)
TSI applies double exponential smoothing to price momentum, creating a smooth oscillator that filters out short-term noise while preserving trend direction. The calculation uses two EMA periods (default 25 and 13) to separate signal from noise:
TSI values above zero indicate bullish momentum, while values below zero indicate bearish momentum. The double smoothing reduces whipsaws while maintaining responsiveness to genuine momentum shifts.
5. Money Flow Index (MFI)
MFI is a volume-weighted RSI that measures buying and selling pressure. It calculates the ratio of positive money flow (volume on up days) to negative money flow (volume on down days):
MFI values above 80 indicate overbought conditions with high volume, while values below 20 indicate oversold conditions with high volume. The indicator normalizes MFI to a zero-centered scale for integration with other components.
6. On-Balance Volume (OBV) and Accumulation/Distribution (A/D)
OBV and A/D track cumulative volume flow to confirm momentum direction. OBV adds volume on up days and subtracts on down days, while A/D weights volume by the close's position within the day's range:
Both indicators are normalized to a 0-100 scale and then zero-centered for composite integration. Rising OBV/A/D with rising momentum confirms institutional accumulation, while falling OBV/A/D with rising price warns of distribution.
Quantum Flux Core Calculation
The Quantum Flux Core combines all components using weighted averaging:
Quantum Flux = (VFI × 0.20) + (Laguerre RSI × 0.20) + (Fisher × 0.15) + (TSI × 0.15) + (MFI × 0.10) + (OBV × 0.10) + (A/D × 0.05) + (CMF × 0.05)
This weighted approach emphasizes volume-driven components (VFI, Laguerre) while incorporating smoothed momentum (Fisher, TSI) and volume confirmation (MFI, OBV, A/D, CMF). The result is smoothed with an EMA to create the final Quantum Flux line.
Regime Classification System
The indicator classifies market conditions into five regimes based on Quantum Flux levels:
Extreme Bull (QF > 35): Institutional buying pressure at extreme levels, potential exhaustion
Bullish (QF > 25): Strong bullish momentum with institutional participation
Neutral (-25 < QF < 25): Balanced conditions, no clear institutional bias
Bearish (QF < -25): Strong bearish momentum with institutional selling
Extreme Bear (QF < -35): Institutional selling pressure at extreme levels, potential capitulation
Regime shifts often precede significant price moves as institutional positioning changes. The indicator tracks regime changes and generates signals when momentum confirms directional bias.
Multi-Timeframe Alignment
The indicator requests Quantum Flux data from three customizable higher timeframes (default: 5m, 15m, 60m) and calculates alignment:
Strong Aligned (3/3): All timeframes show bullish/bearish momentum - high conviction
Aligned (2/3): Majority timeframes confirm - moderate conviction
Weak (1/3): Only one timeframe confirms - low conviction
No Alignment (0/3): No timeframe confirmation - conflicting signals
Strong alignment across multiple timeframes indicates institutional participation at scale, as large orders are often split across timeframes to minimize market impact.
Velocity and Acceleration Tracking
The indicator calculates momentum velocity (rate of change) and acceleration (change in velocity):
Velocity: Current Quantum Flux minus previous bar's value
Acceleration: Current velocity minus previous velocity (second derivative)
Accelerating momentum often precedes breakouts as institutional orders hit the market. Decelerating momentum warns of potential reversals or consolidation.
Visual Elements
Quantum Flux Line: Main oscillator with regime-based color coding (cyan = extreme bull, aqua = bullish, yellow = neutral, red = bearish, magenta = extreme bear)
Threshold Lines: Horizontal lines at +35 (extreme overbought), +25 (overbought), 0 (zero line), -25 (oversold), -35 (extreme oversold)
Velocity Histogram: Shows momentum velocity with color-coded bars (green = rising, red = falling)
Acceleration Columns: Displays momentum acceleration to identify momentum shifts early
Regime Strength Bars: Visual regime indicator showing current market condition strength
Gradient Glow Effect: Multiple layered fills create a glowing effect that emphasizes momentum intensity
Information Dashboard: Comprehensive table displaying all metrics in real-time with color-coded cells
The dashboard displays 10 key metrics: Regime, Flux Value, HTF Confirmation, MFI, CMF, Velocity, Divergence, Volume, and Signal status.
Signal Generation
The indicator generates two types of signals:
Primary Reversal Signals:
Bullish Reversal: Quantum Flux in extreme oversold (< -35), rising momentum, positive velocity acceleration, and HTF confirmation
Bearish Reversal: Quantum Flux in extreme overbought (> 35), falling momentum, negative velocity acceleration, and HTF confirmation
Momentum Crossover Signals:
Bullish Momentum: Quantum Flux crosses above -25 (oversold threshold) with positive velocity and volume confirmation
Bearish Momentum: Quantum Flux crosses below +25 (overbought threshold) with negative velocity and volume confirmation
Signals include anti-overlap logic to prevent signal clustering and ensure clean chart presentation.
Divergence Detection
The indicator detects both regular and hidden divergences between price and Quantum Flux:
Regular Bullish Divergence: Price makes lower low, Quantum Flux makes higher low (potential reversal up)
Regular Bearish Divergence: Price makes higher high, Quantum Flux makes lower high (potential reversal down)
Hidden Bullish Divergence: Price makes higher low, Quantum Flux makes lower low (trend continuation up)
Hidden Bearish Divergence: Price makes lower high, Quantum Flux makes higher high (trend continuation down)
Divergences are drawn with clean lines (solid for regular, dashed for hidden) without text clutter.
How to Use This Indicator
Step 1: Monitor Regime Classification
Watch for regime shifts between Extreme Bear, Bearish, Neutral, Bullish, and Extreme Bull. Regime changes often precede significant price moves.
Step 2: Check Multi-Timeframe Alignment
Strong alignment (3/3) across timeframes confirms institutional conviction. Weak or no alignment suggests retail-driven moves that may lack follow-through.
Step 3: Analyze Velocity and Acceleration
Accelerating momentum (positive acceleration) often precedes breakouts. Decelerating momentum (negative acceleration) warns of potential reversals.
Step 4: Look for Divergences
Regular divergences at extreme levels (QF > 35 or < -35) often signal reversals. Hidden divergences confirm trend continuation.
Step 5: Confirm with Volume Metrics
Check MFI, CMF, OBV, and A/D for confirmation. Rising volume metrics with rising Quantum Flux confirms institutional accumulation.
Step 6: Wait for Signal Confirmation
Primary reversal signals at extreme levels with HTF confirmation provide highest probability setups. Momentum crossover signals work best in trending markets.
Best Practices
Use on liquid instruments (major forex pairs, large-cap stocks, major crypto) for most reliable signals
Combine with price action analysis - momentum shows intent, price shows result
Pay attention to extreme levels (QF > 35 or < -35) as these often precede reversals
MTF alignment is most reliable in trending markets, less reliable in choppy conditions
Extreme momentum can persist longer than expected during strong trends - use stops
Look for momentum divergences at key support/resistance levels for highest probability setups
Monitor velocity and acceleration for early warning signs of momentum shifts
Use the dashboard to quickly assess overall market condition and signal status
Indicator Limitations
Momentum analysis works best on liquid instruments with consistent volume patterns
Low-volume instruments or off-market hours can produce unreliable readings
MTF alignment requires sufficient data on all timeframes - may not work on newly listed instruments
Momentum precedes price but doesn't guarantee direction - high momentum can occur on both breakouts and fakeouts
Extreme momentum levels can persist longer than expected during major news events or market dislocations
The indicator shows what is happening, not why - fundamental catalysts can override technical momentum patterns
Divergences are more reliable at extreme levels than in neutral zones
Multiple components mean the indicator can be slower to respond than single-component oscillators
Input Parameters
Core Engine:
Primary Length: Period for momentum calculations (default: 14)
Smoothing Period: EMA smoothing for final output (default: 7)
Sensitivity Factor: Multiplier for Fisher Transform input (default: 1.5)
Volume Flux Engine:
VFI Coefficient: Cutoff multiplier for significant moves (default: 0.2)
Volume Cutoff: Maximum volume multiplier (default: 2.5)
Scale Multiplier: VFI output scaling (default: 4.0)
Laguerre Transform:
Gamma: Responsiveness parameter (default: 0.4, lower = faster)
Threshold Zones:
Extreme Overbought: Upper extreme threshold (default: 35)
Overbought: Upper threshold (default: 25)
Oversold: Lower threshold (default: -25)
Extreme Oversold: Lower extreme threshold (default: -35)
Money Flow & Volume:
MFI Length: Period for Money Flow Index (default: 14)
OBV Smoothing: Smoothing period for OBV (default: 14)
A/D Smoothing: Smoothing period for A/D Line (default: 14)
Multi-Timeframe Analysis:
Enable Higher Timeframe: Toggle MTF calculations (default: enabled)
HTF Timeframe 1/2/3: Customizable timeframes (default: 5m, 15m, 60m)
Visual Configuration:
Color Theme: Choose from Gradient Glow, Professional Dark, Neon Spectrum, or Institutional Grey
Bullish/Bearish Spectrum: Customizable colors for momentum direction
Glow Layers: Number of gradient layers for glow effect (default: 20)
Show Divergence: Toggle divergence detection (default: enabled)
Show Volume Profile: Toggle volume profile histogram (default: enabled)
Technical Implementation
Built with Pine Script v6 using:
Custom VFI calculations with logarithmic price changes and volume cutoffs
Four-stage Laguerre filter for adaptive RSI
Fisher Transform for Gaussian distribution conversion
Double-smoothed TSI for noise filtering
Volume-weighted MFI calculations
Normalized OBV and A/D Line integration
Multi-timeframe security requests with proper lookahead settings
Velocity and acceleration calculations for momentum derivatives
Real-time regime classification system
Dynamic dashboard with 10 metrics and color-coded cells
Gradient glow effect with multiple layered fills
Divergence detection with pivot analysis
The code is fully open-source and can be modified to suit individual trading styles and preferences.
Originality Statement
This indicator is original in its comprehensive integration approach. While individual components (VFI, Laguerre RSI, Fisher Transform, TSI, MFI, OBV, A/D) are established concepts, this indicator is justified because:
It synthesizes six distinct momentum methodologies into a unified weighted composite system
The regime classification provides institutional momentum measurement not available in standard oscillators
Multi-timeframe alignment detection measures institutional conviction across timeframes
Velocity and acceleration calculations provide early warning of momentum shifts
The gradient glow visualization creates intuitive momentum intensity display
Integration of volume-weighted components (VFI, MFI) with smoothed momentum (Fisher, TSI) and cumulative volume (OBV, A/D) creates layered confirmation
The comprehensive dashboard presents 10 metrics simultaneously for holistic momentum analysis
Each component contributes unique information: VFI shows volume-driven momentum, Laguerre RSI shows adaptive momentum, Fisher Transform shows statistical extremes, TSI shows smoothed momentum, MFI shows money flow, OBV shows cumulative volume, and A/D shows distribution. The indicator's value lies in presenting these complementary perspectives simultaneously with a unified regime classification system.
Disclaimer
This indicator is provided for educational and informational purposes only. It is not financial advice or a recommendation to buy or sell any financial instrument. Trading involves substantial risk of loss and is not suitable for all investors.
Momentum analysis is a tool for understanding market dynamics, not a crystal ball for predicting future price movement. High momentum does not guarantee profitable trades. Past momentum patterns do not guarantee future momentum patterns. Market conditions change, and strategies that worked historically may not work in the future.
The metrics displayed are mathematical calculations based on current market data, not predictions of future price movement. Extreme momentum levels, regime classifications, and signal generation do not guarantee profitable trades. Users must conduct their own analysis and risk assessment before making trading decisions.
Always use proper risk management, including stop losses and position sizing appropriate for your account size and risk tolerance. Never risk more than you can afford to lose. Consider consulting with a qualified financial advisor before making investment decisions.
The author is not responsible for any losses incurred from using this indicator. Users assume full responsibility for all trading decisions made using this tool.
-Made with passion by officialjackofalltrades Gösterge
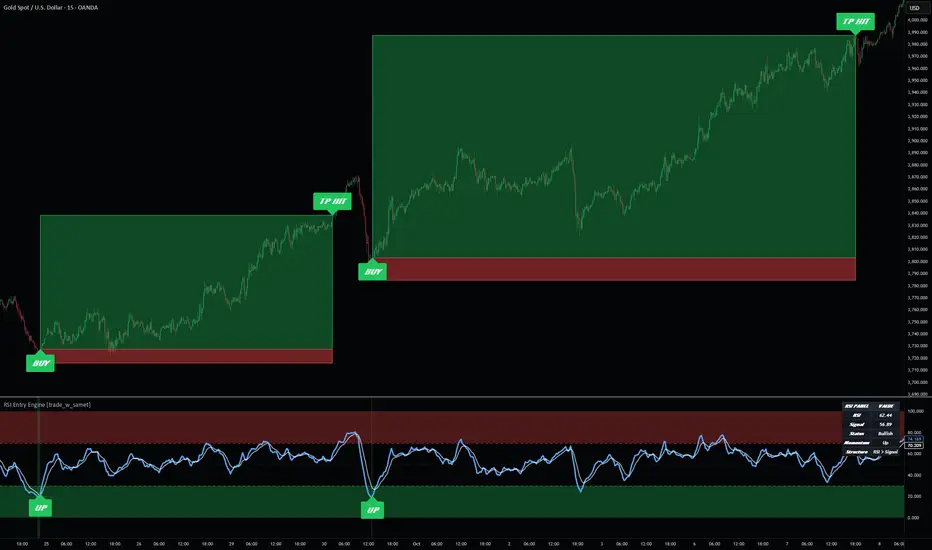
RSI Entry EngineRSI Entry Engine
RSI Entry Engine is an open-source RSI-based entry framework built around one specific analytical idea:
when a smoothed RSI leaves an extreme condition and reclaims back through a defined threshold, that reclaim can be treated as a structured entry event rather than as a generic oscillator fluctuation.
This script is not designed to mark every RSI movement, and it is not intended to behave like a generic “overbought / oversold indicator” that treats all oscillator readings the same way. Its purpose is to smooth RSI behavior, define a hierarchy of RSI states, detect reclaim-style transitions out of extreme zones, and optionally map those reclaim events into a projected risk framework directly on the price chart.
The script also includes a compact status panel and an alert structure so users can monitor RSI condition, internal signal state, and projected trade behavior in a more organized way. These features are included to support analysis and review, not to imply future performance.
OPEN-SOURCE NOTE
This script is published open-source so users can inspect the logic directly, verify what the script is doing, and adapt parts of the workflow for their own research if they wish.
Even though the code is open, this description is intentionally detailed because many TradingView users do not read Pine Script. The goal is for a user to understand what the script does, how it works, why its parts belong together, and how it may be used in practice without having to study the code line by line.
OVERVIEW
At a high level, the script does seven things:
1. It calculates a base RSI from a selected source and length.
2. It optionally smooths that RSI and also derives a separate signal line from the smoothed RSI.
3. It organizes RSI values into multiple zones such as overbought, oversold, extreme high, extreme low, bullish, bearish, and neutral.
4. It detects reclaim-style entry signals when the smoothed RSI exits an extreme condition by crossing back through the selected extreme boundary.
5. It can project entry, stop loss, and take profit structure onto the main chart.
6. It can maintain a compact status panel summarizing RSI state, momentum, and structure.
7. It provides alert conditions for RSI / signal crosses, reclaim events, centerline transitions, and optional trade outcomes.
The script is therefore meant to function as a complete RSI reclaim-entry and review framework rather than as a single-purpose oscillator plot.
CORE IDEA
Many RSI tools are used in one of two broad ways:
- as a visual overbought / oversold reference,
- or as a simple cross-based signal tool.
This script takes a narrower and more structured approach.
Its main idea is that a reclaim out of an extreme zone may be more useful than the extreme reading by itself.
In other words, the script does not assume that simply being overbought or oversold is enough. Instead, it focuses on the transition that occurs when smoothed RSI moves out of a more extreme condition and crosses back through a defined reclaim threshold.
That is the reason the main signal model is based on:
- reclaim above the extreme-low boundary for a bullish entry event,
- reclaim below the extreme-high boundary for a bearish entry event.
This means the script is not centered on “RSI is high” or “RSI is low” alone. It is centered on the moment when a smoothed oscillator moves from extreme positioning into a reclaim state that can be interpreted as a structured shift in short-term momentum.
WHY THIS SCRIPT IS NOT A SIMPLE MASHUP
This script combines several components, but they are not included simply to add more features to one publication.
Each part has a specific role inside the same analytical workflow:
- The RSI engine defines the core oscillator state.
- The smoothing layer reduces noise and makes reclaim logic less reactive to small fluctuations.
- The signal line provides a secondary internal reference for oscillator structure.
- The zone system divides RSI behavior into interpretable states such as neutral, bullish, bearish, oversold, overbought, and extreme conditions.
- The reclaim logic defines the actual entry event.
- The trade projection layer maps that event onto the price chart using entry, stop, and target logic.
- The panel and alerts organize the resulting information for monitoring and review.
These parts are interdependent.
Without RSI calculation, there is no oscillator framework.
Without smoothing, reclaim logic becomes more sensitive to noise.
Without the level structure, reclaim events lose contextual meaning.
Without the reclaim rule, the script becomes a more generic RSI plot.
Without trade projection, the user still has to manually draw entry, stop, and target after each signal.
Without the panel and alerts, the script offers less structure for monitoring and review.
For that reason, the script is intended as a single RSI reclaim-entry framework, not as a random collection of unrelated features.
WHAT THE SCRIPT DOES
The script calculates RSI from a selected source and length, then optionally smooths it using one of several averaging methods.
It also creates a signal line from the smoothed RSI.
Once those two internal series exist, the script can:
- classify RSI state using multiple threshold levels,
- highlight extreme conditions visually,
- detect reclaim signals out of extreme zones,
- plot labels on the RSI pane,
- project BUY / SELL trade structures on the main price chart,
- update TP / SL boxes over time,
- show a compact state panel,
- create alerts for multiple RSI-related events.
This means the script is not just an oscillator display. It is an oscillator-driven entry framework with optional on-chart trade projection.
HOW THE SCRIPT WORKS
1) RSI ENGINE
The script begins with a standard RSI calculation based on a user-selected source and length.
That raw RSI can then be smoothed using one of several methods:
- None,
- EMA,
- SMA,
- RMA.
The smoothed RSI is the main series used for interpretation and signaling.
A second line called the signal line is then derived from the smoothed RSI using its own smoothing method and length.
This creates two internal oscillator references:
- the smoothed RSI itself,
- and a signal line built from that smoothed RSI.
The spread between those two series is also used in the panel to describe whether RSI is currently above or below its signal structure.
2) RSI STATE MODEL
The script does not treat RSI as a single binary oscillator. It organizes RSI values into multiple states:
- Extreme High,
- Overbought,
- Bullish,
- Neutral,
- Bearish,
- Oversold,
- Extreme Low.
These states are determined by the user-defined threshold levels:
- Overbought,
- Oversold,
- Extreme High,
- Extreme Low,
- and the centerline area around 50.
This state model is important because it gives the reclaim signals context. A reclaim signal is not interpreted in isolation; it is interpreted relative to where the smoothed RSI has been and which region it is leaving.
3) LEVEL STRUCTURE
The script plots:
- 0,
- 100,
- 50 centerline,
- Overbought,
- Oversold,
- Extreme High,
- Extreme Low.
It also fills the overbought and oversold regions for easier visual reading, and can optionally highlight the background when RSI is in an extreme condition.
This visual structure is not only cosmetic. It helps the user see why the script treats certain transitions differently from ordinary oscillator movement.
4) PRIMARY ENTRY SIGNAL MODEL
The main entry logic is reclaim-based.
Bullish entry event:
- the smoothed RSI crosses upward through the Extreme Low level,
- and the bar must be confirmed on close.
Bearish entry event:
- the smoothed RSI crosses downward through the Extreme High level,
- and the bar must be confirmed on close.
This means the script does not trigger merely because RSI becomes extreme. Instead, it waits for RSI to transition back through the selected extreme boundary.
That distinction is important.
A low RSI reading alone can persist for multiple bars.
A reclaim above the extreme-low threshold is a different event.
Likewise, a high RSI reading alone can persist,
but a reclaim downward through the extreme-high threshold is a different event.
The script is built around that reclaim event rather than around static RSI position alone.
5) BAR-CLOSE CONFIRMATION
Signals are confirmed only on bar close.
This is an important implementation detail because RSI can move intrabar and then reverse before the bar closes. By requiring confirmation on the close, the script avoids treating temporary intrabar movement as a completed reclaim signal.
This makes the signal model more conservative and more stable.
6) OPTIONAL TRADE PROJECTION
When a valid bullish or bearish reclaim signal appears, the script can optionally project a trade framework onto the main price chart.
This is done even though the script itself is plotted in a separate RSI pane.
Depending on settings, the projection includes:
- entry reference,
- stop-loss calculation,
- take-profit projection,
- TP box,
- SL box,
- entry line,
- BUY or SELL label.
The user can choose the entry reference method:
- Close,
- Open,
- HLC3.
The user can also choose the stop-loss mode:
- Signal Candle,
- ATR,
- Percent.
This means the script separates signal generation from risk projection. The reclaim event comes from RSI behavior, but the projected stop logic can be adapted to different preferences.
7) STOP-LOSS MODES
The script supports three stop-loss methods:
Signal Candle:
The stop is based on the high or low of the signal candle, depending on trade direction.
ATR:
The stop is based on ATR distance from the projected entry.
Percent:
The stop is based on a percentage distance from entry.
This allows the same reclaim signal model to be projected using different risk frameworks without changing the core RSI logic.
8) TAKE-PROFIT PROJECTION
Take profit is projected using a risk/reward multiple applied to the chosen stop distance.
This means the target is not arbitrary. It is derived from the actual stop distance created by the selected stop-loss mode and then multiplied by the chosen RR value.
This makes the trade projection internally consistent:
signal
→ entry method
→ stop-loss method
→ risk distance
→ take-profit distance.
9) SAME-BAR TP / SL PRIORITY
The script includes an explicit rule for bars where both TP and SL appear to be touched after entry.
The user can choose whether the same-bar priority should be:
- SL,
- or TP.
This is an important implementation detail because it affects projected review behavior. Without an explicit priority rule, same-bar ambiguity can produce inconsistent outcome interpretation.
10) TRADE BOX MAINTENANCE
The script stores projected trades internally and extends TP / SL boxes and entry lines forward as long as the trade remains active.
It also limits how many historical projected trades remain visible by using a maximum stored trade setting. This keeps the chart more manageable and prevents the projection layer from expanding indefinitely.
11) STATUS PANEL
The script includes a compact panel that can display:
- the current RSI value,
- the signal-line value,
- the current RSI state,
- short-term momentum direction based on RSI change,
- whether RSI is above or below its signal line.
This panel is designed to summarize the oscillator’s state without requiring the user to read every value directly from the plot.
12) ALERT STRUCTURE
The script can generate alerts for several types of events:
- RSI crossing above its signal line,
- RSI crossing below its signal line,
- RSI reclaiming above oversold,
- RSI rejecting below overbought,
- RSI crossing above the centerline,
- RSI crossing below the centerline,
- bullish reclaim entry signal,
- bearish reclaim entry signal,
- projected TP hit,
- projected SL hit.
This allows the script to be used either visually or as an alert-based monitoring tool.
WHAT MAKES THIS SCRIPT ORIGINAL
This script uses familiar technical-analysis building blocks such as:
- RSI,
- smoothing methods,
- threshold zones,
- ATR-based risk projection,
- percentage-based stops,
- RR-based targets,
- on-chart annotation.
Those building blocks are not original by themselves.
The originality of this script is not in inventing a completely new oscillator primitive. The originality lies in how those familiar elements are arranged into one structured RSI reclaim workflow:
RSI calculation
→ smoothing
→ signal-line derivation
→ multi-zone RSI state model
→ reclaim detection out of extreme conditions
→ optional on-chart trade projection
→ panel-based monitoring
→ alert and review behavior
That full sequence is the main reason this script exists as its own publication.
It is not intended to be simply another RSI plot, another overbought / oversold overlay, another signal-line cross tool, or another TP / SL box script. It is specifically an RSI reclaim-entry framework that combines oscillator conditioning, reclaim detection, projection, and monitoring in one workflow.
WHAT APPEARS ON THE CHART
Depending on settings, the script may display in the RSI pane:
- smoothed RSI,
- the signal line,
- 0 / 100 bounds,
- centerline,
- overbought and oversold levels,
- extreme-high and extreme-low levels,
- overbought / oversold zone fill,
- optional extreme background highlights,
- UP / DOWN labels,
- a status panel.
On the main price chart, it may also display:
- BUY / SELL labels,
- entry line,
- TP box,
- SL box,
- TP hit labels,
- SL hit labels.
This split design is intentional. RSI analysis remains in the oscillator pane, while projected execution structure appears on the price chart.
HOW TO USE THE SCRIPT
A practical workflow is:
1. Add the script to a chart and choose the RSI source and RSI length.
2. Select whether the RSI should remain raw or be smoothed.
3. Configure the signal line used for internal oscillator structure.
4. Set the overbought, oversold, extreme-high, and extreme-low thresholds.
5. Decide whether you want trade projection on the main chart.
6. Choose entry mode, stop-loss mode, and risk/reward multiple.
7. Wait for a bullish or bearish reclaim signal to be confirmed on bar close.
8. Use the projected trade structure as an analysis framework rather than as a blind instruction.
9. Use the panel and alerts to monitor RSI state and signal transitions.
10. Adjust settings only after reviewing how the same logic behaves across the symbols and timeframes you actually use.
This script is best understood as a structured decision-support and review tool, not as a self-sufficient automated trading system.
SETTINGS REFERENCE
RSI Engine
- RSI Source: input source used for RSI calculation.
- RSI Length: length of the base RSI.
- RSI Smoothing: smoothing method applied to raw RSI.
- Smoothing Length: length of the first smoothing stage.
- Signal Length: length of the signal line.
- Signal Smoothing: smoothing method used for the signal line.
Zones
- Overbought: upper reference threshold.
- Oversold: lower reference threshold.
- Extreme High: upper extreme reclaim boundary.
- Extreme Low: lower extreme reclaim boundary.
Visuals
- Highlight Extreme Background: highlights the panel background during extreme conditions.
- Show Status Panel: enables or disables the panel.
- Panel Position: controls panel location.
- Panel Text Size: controls panel text size.
Trade Engine
- Show TP / SL Boxes On Main Chart: enables or disables price-chart projection.
- Entry Price: selects the projected entry reference.
- Stop Loss Mode: selects how stop loss is calculated.
- Risk Reward: sets the take-profit multiple.
- ATR Length: ATR length used when ATR stop mode is selected.
- ATR Multiplier: ATR multiplier used for ATR stop mode.
- Percent Stop Loss: percentage stop value used in Percent mode.
- Same Bar TP/SL Priority: defines which outcome wins when both are touched on one bar.
- Max Stored Trade Boxes: limits how many projected historical trades remain visible.
Alerts
- Enable RSI / Signal Cross Alerts: alerts for oscillator / signal crosses.
- Enable OB / OS Reclaim Alerts: alerts for reclaim behavior around overbought / oversold.
- Enable Centerline Alerts: alerts for 50-line crosses.
- Enable Entry Signal Alerts: alerts for bullish and bearish reclaim entries.
- Enable TP / SL Hit Alerts: alerts for projected trade outcomes.
IMPORTANT PRACTICAL NOTES
This script depends heavily on the chosen RSI thresholds.
If thresholds are too wide, signals may become very rare.
If thresholds are too narrow, signals may become too frequent.
Signal quality and frequency will also change depending on:
- RSI length,
- smoothing method,
- signal-line length,
- timeframe,
- symbol volatility,
- stop-loss mode.
Because trade projection is built from RSI events rather than from direct price-structure analysis, the projected boxes should be understood as a standardized review layer, not as proof that the market itself respects those projected levels.
LIMITATIONS AND SHORTCOMINGS
This script has important limitations:
- It is an oscillator-based reclaim model, not a full market-structure system.
- It does not identify support and resistance or discretionary chart structure.
- It does not claim that all extreme RSI conditions will reverse.
- It does not use volume profile, order flow, or trend structure beyond the oscillator model itself.
- Its signals depend on smoothing choices and threshold definitions.
- Projected TP / SL outcomes depend on the chosen entry and stop-loss method.
- Same-bar ambiguity is handled by a rule, not by true intrabar reconstruction.
- Historical projected trade behavior should not be interpreted as guaranteed live performance.
- No RSI-based reclaim model can remove all false signals or all regime-dependent behavior.
For those reasons, the script should be used as a structured analysis and review framework, not as a promise of future profitability.
WHO THIS SCRIPT MAY BE USEFUL FOR
This script may be useful for traders who:
- use RSI as a state and transition tool rather than as a static threshold indicator,
- care about reclaim behavior out of extreme zones,
- want optional projected risk structure on the price chart,
- want a compact RSI-state panel,
- want alert-based monitoring of oscillator events.
It may be less suitable for traders who:
- want a pure trend-following tool,
- want structural support / resistance logic,
- want a complete strategy with no need for outside confirmation,
- want projected trade statistics to be treated as live-execution evidence.
DISCLAIMER
This script is provided for educational and informational purposes only.
It does not constitute financial, investment, or trading advice.
Market conditions change, historical behavior does not guarantee future results, and users should perform their own analysis, validation, and risk management before using the script in live decision-making. Gösterge

Blanco V3 (PRO MTF System)**Blanco V3 – Advanced Precision Trading System**
Blanco V3 is the next evolution of the Blanco series, designed to deliver **precision entries, stronger confirmations, and cleaner decision-making**. It builds on the foundation of Blanco V1 and V2 by enhancing timing, filtering noise, and introducing smarter multi-timeframe alignment.
At its core, Blanco V3 uses a **Zero Lag EMA (ZLEMA)** to reduce delay and detect trend direction faster than traditional indicators. Combined with advanced filters, it helps traders enter earlier while avoiding weak or late setups.
---
### ⚙️ Intelligent Trading Modes
Blanco V3 features three adaptive modes that dynamically adjust strictness:
* **Aggressive Mode**
Faster signals with more entries. Ideal for scalping and lower timeframes.
* **Balanced Mode (Recommended)**
Optimized for consistency. Balances signal quality and frequency.
* **Conservative Mode**
Focuses only on the strongest setups. Best for swing trading and higher timeframes.
Each mode automatically adjusts:
* Trend strength thresholds (ADX)
* Momentum requirements (RSI)
* Entry precision (pullback sensitivity)
---
### 📊 Signal System
Blanco V3 delivers a refined 3-layer signal structure:
#### 🔺 Entry Signals (Precision Arrows)
Small arrows mark optimized entry points using:
* Pullbacks toward the ZLEMA
* Momentum confirmation (RSI alignment)
* Strong trend validation (ADX filter)
* Candle strength (price action confirmation)
These signals are designed to **improve timing and avoid chasing price**.
---
#### 🟢 BUY / 🔴 SELL Labels (Trend Confirmation)
Larger labels appear when the overall trend shifts direction, helping traders identify:
* Swing entries
* Trend reversals
* Continuation opportunities
---
#### ❗ Elite Signals (Full Alignment)
Blanco V3 introduces enhanced **Elite Signals**, which appear only when:
* A valid entry signal is triggered
* AND all monitored timeframes are aligned
These signals represent the **highest-probability setups**, combining trend, momentum, and full market agreement.
---
### 🧠 Multi-Timeframe Intelligence
Blanco V3 includes a bright, easy-to-read dashboard showing trend direction across:
* 5-minute
* 15-minute
* 30-minute
* 1-hour
* 2-hour
* 4-hour
Each timeframe is color-coded:
* 🟢 Green = Bullish
* 🔴 Red = Bearish
---
### 🔍 Smart Confirmation Logic (NEW)
Blanco V3 improves flexibility and accuracy with:
* **Partial Alignment (4/6 or more)**
Allows earlier entries while maintaining quality
* **Full Alignment (6/6)**
Triggers ❗ Elite Signals for maximum confidence
* **Noise Reduction Filters**
Avoids sideways markets and weak momentum conditions
---
### 🎯 Strategy Philosophy
Blanco V3 is designed around one key principle:
> **Trade with the trend, enter on pullbacks, and confirm with alignment.**
It focuses on:
* Entering **after retracements**, not breakouts
* Trading only in **strong market conditions**
* Aligning with **higher timeframe direction**
---
### ⚠️ Best Use
* Best on **1H and 4H charts**
* Works best in **trending markets**
* Combine with:
* Risk management
* Support & resistance
* Market structure
---
### 📌 Quick Guide
* 🔺 Arrows = precise entries
* 🟢 BUY / 🔴 SELL = trend shifts
* ❗ = elite high-probability trades
* 📊 Dashboard = multi-timeframe confirmation
---
**Blanco V3 is built for traders who want cleaner charts, smarter entries, and higher-quality signals — all in one system.**
Gösterge

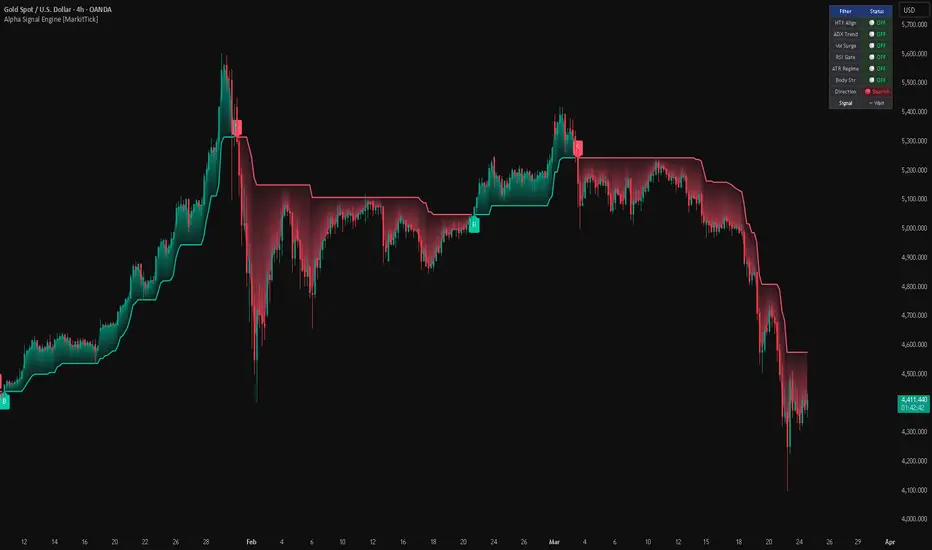
Alpha Signal Engine [MarkitTick]💡 The Alpha Signal Engine is an advanced, multi-dimensional trend-following system designed to provide traders with highly filtered, high-probability market signals. At its core, it dynamically calculates a volatility-adjusted trailing band to determine the primary market direction. However, unlike traditional trend indicators that rely on a single data point, this engine passes every potential trend reversal through a rigorous, six-layer filtering mechanism. By requiring confluence across higher timeframe trends, momentum, volume, volatility regimes, and price action strength, it drastically reduces the noise and false signals inherent in choppy markets. It also features a built-in heads-up dashboard and fully formatted JSON webhook capabilities for automated trading integration.
✨ Originality and Utility
● A Dynamic, Adaptive Baseline
Standard trailing stop or trend indicators, such as the classic Supertrend, typically use a static multiplier against the Average True Range (ATR). The Alpha Signal Engine innovates by introducing a "Dynamic Factor." This factor continuously adapts the band's distance from price by factoring in the current baseline multiplier, the relative volatility (ATR normalized by price), and the immediate price change momentum. This allows the bands to tighten during periods of strong, directional momentum and widen during erratic volatility, providing a more responsive and intelligent trailing mechanism.
● The Six-Pillar Filtering Gateway
The true utility of this indicator lies in its modular filtering engine. Traders often have to clutter their charts with half a dozen indicators to confirm a setup. This script centralizes that logic. Users can selectively enable or disable filters based on their specific asset and trading style, turning the indicator into a customizable algorithmic engine. Whether you need volume confirmation, ADX trend strength, or simple RSI momentum, the script handles the complex boolean logic internally and only outputs a signal when your precise market conditions are met.
🔬 Methodology and Concepts
● Dynamic Factor Calculation
The indicator establishes its baseline trend using an upper and lower band. The distance of these bands from the median price is dictated by a dynamically calculated factor. This factor is the sum of a base value, a volatility component (ATR divided by Close, scaled by a user weight), and a price movement component (percentage change of the close, scaled by a user weight). This raw factor is then smoothed using a Simple Moving Average (SMA) to prevent erratic band shifts.
● Trend Determination
The trend direction flips when the closing price crosses the active dynamic band. If the price closes above the upper band, the trend shifts bullish, and the lower band becomes the active support. Conversely, closing below the lower band shifts the trend bearish, making the upper band the active resistance.
● The Filter Matrix
A signal is only generated when a trend flip aligns with all activated filters:
HTF Alignment: Uses the request context to pull the trend direction from a higher timeframe, ensuring you are not trading against the macro trend.
ADX Trending: Measures the Average Directional Index to ensure the market is in an active trending phase (above a defined threshold) rather than a sideways chop.
Volume Surge: Compares current volume against a Volume SMA. The current bar must exhibit a volume spike greater than the defined multiplier to confirm institutional participation.
RSI Momentum: A simple but effective gatekeeper requiring the Relative Strength Index to be above 50 for longs and below 50 for shorts.
ATR Volatility Regime: Compares the current ATR against a 50-period SMA of the ATR. It ensures the market is operating within a "normal" volatility ratio, preventing entries during extreme, unpredictable volatility spikes or dead, illiquid periods.
Candle Body Strength: Calculates the absolute size of the candle body (Open to Close) and mandates it must be larger than a specific fraction of the ATR, ensuring the signal candle has true directional conviction.
🎨 Visual Guide
● Chart Elements
Up Trend Line: Displayed as a solid, teal-colored line trailing below the price action during a bullish phase. It acts as dynamic support.
Down Trend Line: Displayed as a solid, bright pink/red line trailing above the price action during a bearish phase. It acts as dynamic resistance.
Trend Cloud (Fill): A colored gradient fill exists between the median price and the active trend line. A teal cloud visually represents bullish dominance, while a pink/red cloud represents bearish dominance.
Buy Signals: Indicated by small, teal "B" labels positioned below the signal candle.
Sell Signals: Indicated by small, pink/red "S" labels positioned above the signal candle.
● Filter Dashboard
Located in the top right corner of the chart, this HUD (Heads-Up Display) provides a real-time status check of your system.
The left column lists the available filters (HTF Align, ADX Trend, Vol Surge, RSI Gate, ATR Regime, Body Str).
The right column displays the current status of each filter.
A gray "OFF" indicator means the user has disabled the filter in the settings.
A green "ON" or "Aligned" text indicates the condition is currently met.
A red "Opposed" or unlit indicator means the condition is active but currently failing to meet the required criteria.
The bottom rows clearly state the current overarching trend direction and whether a signal is pending or waiting.
📖 How to Use
• Interpreting the System
To effectively use the Alpha Signal Engine, begin by observing the main trend lines and the color of the cloud. This provides your baseline bias. Do not take trades purely on the band flipping. Instead, rely on the explicit "B" and "S" labels.
• Signal Execution
When a "B" (Buy) or "S" (Sell) label appears, it means the price has successfully flipped the trend AND all user-activated filters in the dashboard are glowing green. This is your entry trigger. The active trend line (the teal line for longs, the pink line for shorts) serves as an ideal, dynamic stop-loss placement.
• Customizing the Engine
The system is designed to be tuned. If you are trading a highly liquid asset like major forex pairs, you may want to enable the ADX and HTF filters to catch long, sustained moves. If you are trading volatile crypto assets, enabling the Volume Surge and Candle Body filters can help you avoid fake-outs and trap wicks. Monitor the on-chart dashboard to see which filters are keeping you out of bad trades and adjust your settings accordingly.
⚙️ Inputs and Settings
• Supertrend Settings
ATR Length: The lookback period for calculating the Average True Range.
Base Factor: The starting multiplier for the dynamic bands.
Volatility & Price Change Weights: Determines how aggressively the bands react to sudden spikes in relative volatility and price momentum.
Factor Smoothing: Applies an SMA to the final dynamic multiplier to keep the bands stable.
• Filter Settings
Enable HTF Alignment: Toggle and define the higher timeframe (e.g., Daily) to align with.
ADX Settings: Toggle the filter, define the lookback length, and set the minimum trend strength threshold (default is 20).
Volume Settings: Toggle the filter, define the Volume MA length, and set the multiplier required to classify as a "surge."
RSI Settings: Toggle the filter and set the RSI lookback length.
ATR Regime Settings: Define the minimum and maximum acceptable ratios of current ATR versus historical ATR.
Candle Body Settings: Define the minimum required size of the candle body as a fraction of the current ATR.
• Webhook Action Names
These text inputs allow you to define specific payload strings (e.g., "long", "closeshort") that the indicator will output via JSON alerts, perfectly formatting the data for third-party automation services like 3Commas or PineConnector.
🔍 Deconstruction of the Underlying Scientific and Academic Framework
The Alpha Signal Engine is grounded in several well-documented tenets of quantitative financial analysis and statistical market theory.
● Volatility-Adjusted Trailing Stops
The foundation of the indicator relies on the Average True Range (ATR), introduced by J. Welles Wilder Jr. The ATR is a measure of the degree of price volatility. By tying the trailing stop (the dynamic band) to the ATR, the system acknowledges the statistical reality of market variance. The innovation here is the dynamic multiplier. By adjusting the distance based on the normalized rate of change (momentum), the script attempts to solve the lagging nature of fixed-multiplier trailing stops, utilizing principles found in adaptive moving averages (like Kaufman's AMA), where sensitivity increases alongside directional conviction.
● Multi-Dimensional Confluence Theory
The filtering engine operates on the academic principle of conditional probability and confluence. In market microstructure, no single indicator holds a permanent statistical edge.
The HTF filter is rooted in Dow Theory, prioritizing the primary trend over secondary reactions.
The ADX filter utilizes Wilder's Directional Movement Index to mathematically separate trending environments from mean-reverting environments, applying a statistical threshold to directional strength.
The Volume Surge filter relies on the Volume Price Trend concepts, positing that significant price movements must be sponsored by outsized volume to validate institutional participation and avoid anomalous low-liquidity spikes.
The ATR Regime filter applies mean-reverting principles to volatility itself (volatility clustering), ensuring that entries are only taken when the variance of the asset is within historically "normal" parameters, avoiding the fat tails of extreme market shocks.
By chaining these disparate mathematical models (trend, momentum, volume, volatility) via Boolean logic, the system mathematically reduces the frequency of trades while theoretically increasing the probability of the remaining sample size.
⚠️ Disclaimer
All provided scripts and indicators are strictly for educational exploration and must not be interpreted as financial advice or a recommendation to execute trades. I expressly disclaim all liability for any financial losses or damages that may result, directly or indirectly, from the reliance on or application of these tools. Market participation carries inherent risk where past performance never guarantees future returns, leaving all investment decisions and due diligence solely at your own discretion. Gösterge

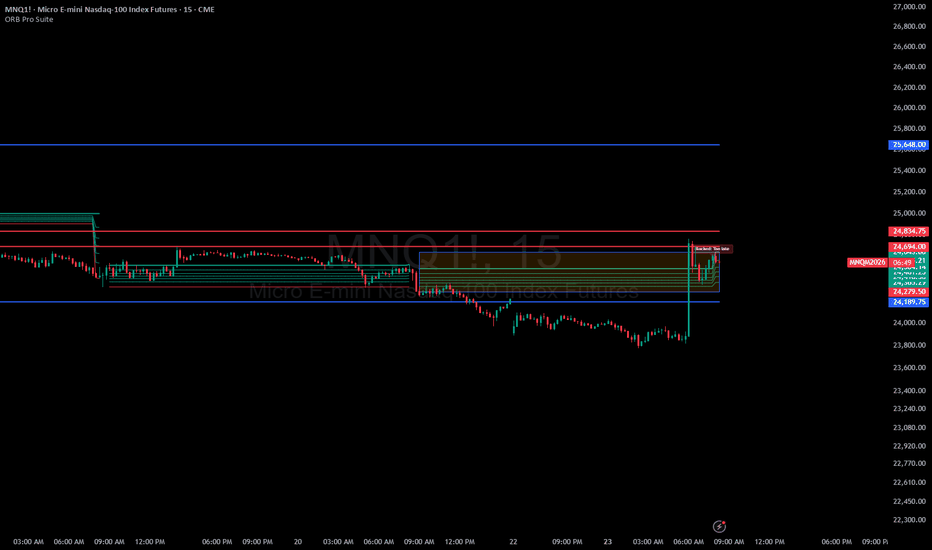
ORB Pro Suite v6ORB Pro Suite v6 — Multi-Session + HTF ORB Build
ORB Pro Suite v6 is an advanced Opening Range Breakout (ORB) tool designed for traders who want clarity, structure, and adaptability across NY, London, and Asia sessions — without changing the core ORB logic that works.
This update expands the original ORB Pro Suite to support overnight markets and multi-timeframe workflows, while keeping the strategy behavior consistent and familiar.
✅ Multi-Session Presets
Choose from built-in session presets:
NY AM (RTH) — original behavior (unchanged)
London
Asia
Custom
Each preset aligns the ORB window with the selected session and pairs seamlessly with session-appropriate filters.
✅ ORB Build Mode
You now have two ways to build your ORB:
1️⃣ Time Window (Classic ORB)
Uses session start/end times
Identical to previous versions
2️⃣ HTF Candle Count (Advanced)
Build the ORB from 5m / 15m / 30m / 60m candles
Works on any chart timeframe
Ideal for traders who want ORB consistency across TFs
Example:
Build a 15-minute ORB from 1× 15m candle, even while trading on a 5m chart.
✅ Session Profile Defaults
ORB Pro Suite introduces Session Profiles that automatically tune filters for different market conditions — without changing the strategy logic.
Profiles include:
NY (Default)
London (Breakout)
Asia (Slow Session)
Custom
You can toggle Profile Defaults ON or OFF at any time.
🧠 Core ORB Logic (Unchanged)
Original ORB framework:
Opening range high/low
Breakout confirmation
Optional retest logic
Golden Pocket (0.5–0.618) validation
Local + higher-timeframe trend filters
Cooldown protection
Visual risk/reward mapping
If you traded NY with earlier versions, nothing has changed.
⚙️ Recommended Starting Settings
For most users:
ORB Build Mode: Time Window
Session Profile: Auto
Strictness: Balanced
Advanced users:
Enable HTF Candle Count
Select desired ORB TF (5m–60m)
Adjust candle count to match your style
All inputs remain fully customizable.
📊 Designed For
Futures (ES, NQ, YM, RTY)
Forex pairs
Gold & major indices
Intraday price-action traders
Session-based trading workflows
⚠️ Disclaimer
This indicator is for educational and informational purposes only.
It does not constitute financial advice or trade recommendations.
Trading involves risk. Always manage risk appropriately and trade responsibly. Gösterge
Gold Priceaction V2.001. Introduction
Welcome to Gold Priceaction V2.00, an incredibly powerful, all-in-one custom indicator built on Pine Script v5 specifically for TradingView. Unlike traditional lagging indicators that rely on past moving averages, this tool reads the raw footprint of the market. It is engineered to automatically map out institutional price action, dynamic support and resistance, exact trendlines, and high-probability entry zones in real-time.
Whether you are a scalper, day trader, or swing trader, Gold Priceaction V2.00 gives you an objective, crystal-clear view of market direction—removing emotion and guesswork from your trading routine.
2. Why it Works Exceptionally Well for Gold (XAUUSD)
The Gold (XAUUSD) market is notoriously volatile and highly manipulated by large institutional players (banks and hedge funds). Gold charts frequently experience "liquidity grabs"—sudden spikes that hunt retail traders' stop losses before reversing into the true trend direction.
Gold Priceaction V2.00 is tailored exactly for this environment. Instead of blindly following a breakout, this indicator mathematically calculates true swing points to identify areas where the market is most likely to reverse (Support/Resistance) or continue (Target Breakouts). By highlighting premium and discount zones alongside equal highs/lows (liquidity pools), it allows you to trade with the "Smart Money" rather than becoming their exit liquidity.
3. Core Features & Functions (What’s Inside & How It Works)
📈 Dynamic Trendlines: Forget drawing subjective lines manually. The indicator uses a complex algorithmic loop to find the sharpest, most accurate Ascending (Bullish) and Descending (Bearish) trendlines in real-time. It projects these lines forward, giving you dynamic, diagonal support and resistance levels.
🛑 Real-Time Support & Resistance: The script constantly analyzes market data to find minor and major pivot points.
• Strong Highs/Lows: Act as massive, rigid Support and Resistance boundaries.
• Weak Highs/Lows: Act as magnets. The indicator anticipates that these weak points will be broken, turning them into your primary Take Profit (Target) levels.
🎯 Clean Future Target Projection: Most indicators clutter your screen with dozens of old, useless lines. Gold Priceaction V2.00 features an advanced auto-cleanup system. It automatically deletes past targets that have already been hit and only projects a single, bold horizontal line deep into the future. This shows you exactly where the price is magnetically drawn to next.
📦 Institutional Zones (Order Blocks & FVGs): The indicator automatically highlights the hidden footprint of big banks:
• Order Blocks (Supply/Demand Zones): Identifies the last bearish candle before a strong bullish move (and vice versa). These colored boxes act as high-probability entry zones for reversals or continuations.
• Fair Value Gaps (FVG): Spots sudden imbalances in price where the market moved too fast, leaving a "gap." Price almost always returns to rebalance these zones.
🕰️ Multi-Timeframe Context (PDH/PDL): Context is everything. You can enable higher timeframe levels directly on your lower timeframe chart (e.g., 5-minute chart).
• PDH / PDL: Previous Daily High and Low.
• PWH / PWL: Previous Weekly High and Low.
• PMH / PML: Previous Monthly High and Low.
These act as massive macro support/resistance areas where major reversals frequently happen.
4. How to Use It in Live Trading (The 4-Step Playbook)
Step 1: Determine the Trend
Look at the real-time Dashboard on your screen. If the "Market Trend" says BULLISH, you only look for BUY setups. If it says BEARISH, you only look for SELL setups.
Step 2: Wait for Price to Reach an Entry Zone
Do not buy at the top! Let the price retrace (pullback) down into a Discount Zone, a Bullish Order Block, or touch the Ascending Trendline.
Step 3: Look for Confirmation
Wait for a minor trend shift on a lower timeframe. If you are in a Bullish zone, wait for the indicator to print a "Support Hold" or a lower-timeframe "Resistance Break" to prove buyers are stepping in.
Step 4: Execute & Manage Risk
• Entry: Enter the market when the setup is confirmed.
• Stop Loss (SL): Look at the Dashboard. It dynamically calculates the safest, tightest Stop Loss based on the "Immediate Swing Level" to minimize your risk.
• Take Profit (TP): Ride the trade directly to the "🎯 Future Target" line projected on your chart.
5. Recommended Timeframes
• Scalping (Quick Trades): 1-Minute (1m) or 3-Minute (3m) charts.
• Intraday (Day Trading): 5-Minute (5m) and 15-Minute (15m) charts. (Highly Recommended for Gold).
• Swing Trading (Holding for days): 1-Hour (1H) or 4-Hour (4H) charts.
6. The Interactive Dashboard & Customization
The indicator includes a completely clean, user-friendly settings menu. We have hidden all the messy background code values so your chart title remains pristine.
Dashboard Customization:
• Positioning: Using the settings menu (gear icon), you can move the dashboard anywhere on your screen (Top Right, Bottom Center, Right Center, Left Center, etc.) so it never blocks your price action.
• Target Probability Score: A built-in logic metric reading from 0% to 100%. It calculates the trend bias, verifies if the price is safely holding above support, and checks RSI confluence (Overbought/Oversold levels) to give you a live win-rate probability color-coded in Red, Yellow, or Green.
• Styling: You can fully customize the colors of your candles, Order Blocks, and zones to perfectly match TradingView's Light or Dark modes.
❓ Frequently Asked Questions (FAQ)
Q1: Does this indicator repaint?
A: No. The historical Support/Resistance lines and Order Blocks are drawn based on confirmed closed candles. Once a swing point is confirmed mathematically, it does not repaint or shift backward.
Q2: Is this only for Gold?
A: While it is highly optimized for the volatility and structure of XAUUSD, the pure price action mathematics behind it work excellently on Forex pairs (EURUSD, GBPUSD), Crypto (BTC, ETH), and Indices (US30, NAS100).
Q3: Why are my old Target lines disappearing?
A: That is by design! To keep your chart clean and easy to read, the indicator deletes old, irrelevant "past" targets and only shows you the "Future Target" that matters right now.
Q4: How do I get rid of all the text on my indicator title bar?
A: You don't have to! In Gold Priceaction V2.00, all input variables have been explicitly hidden (display.none). The indicator name on your chart will stay clean and professional without long strings of text.
Q5: What does "Premium" and "Discount" mean?
A: Think of it like shopping. The indicator draws a grid between the highest and lowest points of the current trend.
• Premium Level (Red): The price is too high/expensive. (Best place to SELL).
• Discount Level (Green): The price is cheap/on sale. (Best place to BUY).
Gösterge

Breakout Trend Bar AlertsEvery trend has a starting point. It's rarely a gradual drift — it's one massive, decisive candle that breaks the market out of consolidation and kicks off a sustained move. Breakout Bar Alerts is built to catch that exact moment.
The indicator monitors price action in real time and identifies when a bar forms that dwarfs everything around it — the largest high-to-low range of any candle in the last 250 bars. These are the bars where conviction enters the market, weak hands get flushed, and a new trend begins. When one appears, you get an instant alert so you're never late to the move.
Why these bars matter:
Big range bars represent a sudden surge of momentum and volume-backed commitment from one side of the market. Bulls or bears have taken control decisively. What follows is often the beginning of a trend leg — not a random spike.
Built to filter out the noise:
The opening bar of every session is excluded entirely. That first chaotic candle never skews your data or triggers a false signal.
Only bars within your active session window are counted. Off-hours price action is completely ignored, so your benchmark is always built from real, tradeable market conditions.
Three alert conditions — Bull Breakout Bar, Bear Breakout Bar, or Both — so you only get notified for the setups you actually trade.
Inputs:
Lookback Period — how many bars back to measure the largest range (default: 250)
Enable Time Filter — restricts detection and calculations to your active trading session
Active Session — define your session window in exchange time
Bull / Bear colors — fully customizable
Best used on intraday timeframes (1m – 15m) on futures, forex, or high-volume equities. When this fires, pay attention — the trend may already be starting. Gösterge

Elite Session Volume Distribution Engine [JOAT]Elite Session Volume Distribution Engine
Introduction
The Elite Session Volume Distribution Engine is an open-source indicator that combines session-based analysis (London, New York, Asian sessions) with volume distribution profiling, VWAP analysis, volume-weighted momentum indicators, and session high/low tracking. This mashup creates a comprehensive session and volume analysis system designed to identify when institutional volume enters the market during specific trading sessions and how that volume is distributed across price levels.
The indicator addresses a critical market reality: different trading sessions have distinct volume characteristics and institutional participation levels. London and New York sessions typically have highest volume and volatility, while Asian session is quieter. By tracking volume distribution, momentum, and key levels within each session, this tool helps traders identify optimal trading windows and understand how institutional volume shapes price action during different global market hours.
Chart showing session boxes, volume distribution, and VWAP on 45M timeframe
Why This Mashup Exists
This indicator combines five analytical frameworks that address different aspects of session-based trading:
Session Identification: Tracks London, New York, and Asian trading sessions
Volume Distribution: Analyzes how volume is distributed across price levels within sessions
VWAP Analysis: Calculates session-specific Volume Weighted Average Price
Volume Momentum: Tracks volume trends and climax conditions
Session High/Low: Identifies key levels established during each session
Each component serves a specific purpose: Session identification shows when institutional traders are active, Volume Distribution reveals where volume concentrates (value areas), VWAP shows institutional average price, Volume Momentum identifies accumulation/distribution phases, and Session High/Low marks key reference levels. Together, they create a complete picture of how institutional volume flows through different trading sessions.
The mashup is justified because these components work together in session-based trading: institutions enter during specific sessions (London/NY), create volume distribution patterns at key levels, establish VWAP as benchmark, show momentum through volume trends, and set session highs/lows that become support/resistance. Tracking all simultaneously reveals the complete session-based institutional flow.
Core Components Explained
1. Session Identification System
The indicator identifies three major trading sessions:
// London Session (03:00-12:00 GMT)
londonSession = input.session("0300-1200", "London Session")
inLondonSession = not na(time(timeframe.period, londonSession))
// New York Session (08:30-17:00 EST)
nySession = input.session("0830-1700", "NY Session")
inNYSession = not na(time(timeframe.period, nySession))
// Asian Session (00:00-09:00 GMT)
asianSession = input.session("0000-0900", "Asian Session")
inAsianSession = not na(time(timeframe.period, asianSession))
// Session overlap (London + NY)
sessionOverlap = inLondonSession and inNYSession
Session characteristics:
London Session: High volume, major currency pairs active, trend establishment
NY Session: Highest volume, US markets active, major moves occur
Asian Session: Lower volume, range-bound often, JPY pairs active
London/NY Overlap: Highest volume period, most volatile, best liquidity
The indicator can optionally display session boxes as background colors (disabled by default to reduce clutter).
2. Volume Distribution Analysis
Volume distribution shows where volume concentrates within price ranges:
// Calculate volume at different price levels
volumeAtPrice = array.new_float()
// For each price level in session range
for i = sessionLow to sessionHigh by tickSize
volumeAtLevel = sum of volume where price traded at level i
array.push(volumeAtPrice, volumeAtLevel)
// Identify Point of Control (POC) - price level with most volume
poc = price level with maximum volume
// Identify Value Area (VA) - price range containing 70% of volume
valueAreaHigh = upper bound of 70% volume
valueAreaLow = lower bound of 70% volume
Volume Distribution concepts:
Point of Control (POC): Price level with highest volume - strong support/resistance
Value Area High (VAH): Upper bound of 70% volume distribution
Value Area Low (VAL): Lower bound of 70% volume distribution
High Volume Nodes: Price levels with significant volume - support/resistance zones
Low Volume Nodes: Price levels with little volume - price moves through quickly
The indicator plots volume distribution as a histogram or profile showing where institutional volume concentrated during the session.
3. Session-Specific VWAP
VWAP resets at the start of each session:
// Session VWAP calculation
var float sessionVWAP = na
var float cumulativeTPV = 0.0 // Typical Price * Volume
var float cumulativeVol = 0.0
if session_start
cumulativeTPV := 0.0
cumulativeVol := 0.0
typicalPrice = (high + low + close) / 3
cumulativeTPV := cumulativeTPV + (typicalPrice * volume)
cumulativeVol := cumulativeVol + volume
sessionVWAP = cumulativeTPV / cumulativeVol
Session VWAP significance:
Institutional traders use VWAP as execution benchmark
Price above session VWAP = buyers in control during session
Price below session VWAP = sellers in control during session
VWAP acts as dynamic support/resistance within session
Distance from VWAP indicates overextension
The indicator plots session VWAP with dynamic coloring based on price position.
4. Volume Momentum Analysis
Volume momentum tracks institutional accumulation/distribution:
// Volume moving average
volumeMA = ta.sma(volume, 20)
// Volume classification
highVolume = volume > volumeMA * 1.5
veryHighVolume = volume > volumeMA * 2.0
climaxVolume = volume > volumeMA * 3.0
// Volume trend
volumeRising = volume > volume and volume > volume
volumeFalling = volume < volume and volume < volume
// Accumulation/Distribution
accumulation = close > open and highVolume and volumeRising
distribution = close < open and highVolume and volumeRising
// Volume momentum indicator
volumeMomentum = (volume - volumeMA) / volumeMA * 100
Volume Momentum signals:
Rising Volume + Up Close: Accumulation - bullish
Rising Volume + Down Close: Distribution - bearish
Climax Volume: Potential exhaustion or strong institutional move
Declining Volume: Lack of institutional interest
Volume Momentum > 50%: Very strong institutional participation
The indicator plots volume bars with color coding based on momentum and direction.
5. Session High/Low Tracking
Session highs and lows become important reference levels:
// Track current session high/low
var float currentSessionHigh = na
var float currentSessionLow = na
if session_start
currentSessionHigh := high
currentSessionLow := low
else
currentSessionHigh := math.max(currentSessionHigh, high)
currentSessionLow := math.min(currentSessionLow, low)
// Previous session levels
prevSessionHigh = currentSessionHigh
prevSessionLow = currentSessionLow
Session High/Low significance:
Current session high/low show intraday range
Previous session levels act as support/resistance
Breaks above previous session high = bullish continuation
Breaks below previous session low = bearish continuation
Session range size indicates volatility and institutional activity
The indicator plots only CURRENT session high/low (2 lines instead of 6) to keep chart clean. Previous session levels can be toggled on if needed.
Example showing session VWAP, volume distribution, and session high/low levels
Volume Distribution Dashboard
The dashboard (bottom-right position) displays:
Current Session: London/NY/Asian/Overlap
Session VWAP: Current VWAP value
Price vs VWAP: Distance from VWAP in %
POC: Point of Control price level
Value Area: VAH and VAL levels
Volume Status: High/Normal/Low relative to average
Volume Momentum: Rising/Falling/Climax
Session Range: High - Low distance
Accumulation/Distribution: Current phase
Visual Elements
Session Boxes: Optional background colors for each session (default: OFF)
Session VWAP: Dynamic line with color based on price position
Session High/Low: Horizontal lines for current session (2 lines only)
Volume Bars: Color-coded based on momentum and direction
Volume Distribution Profile: Histogram showing volume at price levels
POC Line: Horizontal line at Point of Control
Value Area: Shaded zone between VAH and VAL
Accumulation/Distribution Markers: Labels for strong volume phases
Dashboard: Bottom-right table with session and volume metrics
Chart demonstrating session VWAP, volume bars, and dashboard
How Components Work Together
The mashup reveals session-based institutional flow:
Session Trading Sequence:
1. Session Opens: New session begins (London/NY/Asian)
2. VWAP Establishes: Session VWAP forms as volume enters
3. Volume Distribution: Institutions create volume at key levels (POC, Value Area)
4. Session Range: High and low established through institutional activity
5. Volume Momentum: Accumulation or distribution phase identified
6. Session Close: Levels become reference for next session
Example: London session opens, price trades above session VWAP with rising volume (accumulation). Volume distribution shows POC forming at 1.2500 level. Session high reaches 1.2550. NY session opens, price respects London session high and VWAP, continues higher with climax volume. Dashboard shows strong accumulation with volume momentum +75%.
Input Parameters
Session Settings:
London Session: Time range (default: 0300-1200)
NY Session: Time range (default: 0830-1700)
Asian Session: Time range (default: 0000-0900)
Show Session Boxes: Toggle background colors (default: OFF)
Highlight Overlap: Emphasize London/NY overlap (default: enabled)
VWAP Settings:
Show Session VWAP: Toggle VWAP line (default: enabled)
VWAP Reset: Session, Daily, Weekly (default: Session)
VWAP Bands: Optional standard deviation bands (default: disabled)
Distance Alert: Alert when price moves X% from VWAP (default: 2%)
Volume Settings:
Volume MA Length: Period for volume average (default: 20)
High Volume Threshold: Multiplier for high volume (default: 1.5x)
Climax Volume Threshold: Multiplier for climax (default: 3.0x)
Show Volume Bars: Color-coded volume bars (default: enabled)
Show Distribution Profile: Volume at price histogram (default: enabled)
Session Levels:
Show Current Session H/L: Toggle current session levels (default: enabled)
Show Previous Session H/L: Toggle previous session levels (default: disabled)
Show POC: Toggle Point of Control line (default: enabled)
Show Value Area: Toggle VAH/VAL zone (default: enabled)
Display Options:
Show Dashboard: Toggle metrics table (default: enabled)
Dashboard Position: Bottom-right, top-right, etc. (default: bottom-right)
Color Theme: Choose color scheme
Transparency: Adjust visual element transparency
How to Use This Indicator
Step 1: Identify Active Session
Check dashboard to see which session is active. Focus trading during London and NY sessions for highest volume and best opportunities.
Step 2: Monitor Session VWAP
Use session VWAP as directional bias. Price above VWAP = bullish bias, below = bearish bias. VWAP often acts as support/resistance.
Step 3: Check Volume Distribution
Identify POC and Value Area. These levels often provide strong support/resistance. Price tends to return to POC (fair value).
Step 4: Assess Volume Momentum
Check if volume is rising (accumulation/distribution) or falling (lack of interest). Climax volume often marks important turning points.
Step 5: Use Session High/Low
Current session high/low define intraday range. Breaks above/below these levels signal potential breakout moves.
Step 6: Watch for Session Transitions
Session opens and closes often bring volatility. London open and NY open are particularly important for major moves.
Best Practices
Use on 5-minute to 1-hour timeframes for optimal session analysis
London/NY overlap (08:30-12:00 EST) offers highest volume and best opportunities
Session VWAP acts as magnet - price often returns to it
POC from previous session often becomes support/resistance in current session
Climax volume at session high/low often marks reversal points
Accumulation during Asian session often leads to breakout during London open
Value Area breaks signal strong directional moves
Previous session high/low become key levels for current session
Combine session analysis with other technical tools for best results
Indicator Limitations
Session times are fixed and may not account for daylight saving time changes
Volume distribution requires sufficient data within session to be meaningful
VWAP can be less relevant in very volatile or trending markets
Session high/low can be broken multiple times in volatile conditions
Lower timeframes may show choppy session transitions
Volume data quality varies across different markets and brokers
Asian session analysis less reliable due to lower volume
Requires understanding of session-based trading concepts
Visual elements can clutter chart if all options enabled
Technical Implementation
Built with Pine Script v6 using:
Session detection using time() function with session strings
Session-specific VWAP calculation with reset logic
Volume distribution profiling with POC and Value Area calculation
Volume momentum tracking with MA comparison
Session high/low tracking with persistent variables
Accumulation/distribution detection using volume and price
Dynamic dashboard with real-time session metrics
Optional session boxes with transparency control
Color-coded volume bars based on momentum
The code is fully open-source and can be modified to adjust session times, volume thresholds, and visual preferences.
Originality Statement
This indicator is original in its comprehensive session and volume integration approach. While individual components (session identification, VWAP, volume distribution, volume momentum, session high/low) are established concepts, this mashup is justified because:
It combines session-based analysis with volume distribution profiling
Session-specific VWAP provides more relevant institutional benchmark than daily VWAP
Integration of volume momentum with session context reveals accumulation/distribution phases
Simplified visual presentation (current session H/L only) reduces clutter
Dashboard presents complex session and volume data clearly
Focus on institutional trading sessions (London/NY) aligns with volume reality
Each component contributes unique information: Session identification shows when institutions are active, Volume Distribution reveals where they're trading, VWAP shows their average price, Volume Momentum shows their intent, and Session High/Low marks their range. The mashup's value lies in presenting these complementary session-based perspectives simultaneously, allowing traders to understand how institutional volume flows through different global trading sessions.
Disclaimer
This indicator is provided for educational and informational purposes only. It is not financial advice or a recommendation to buy or sell any financial instrument. Trading involves substantial risk of loss and is not suitable for all investors.
Session-based analysis and volume distribution are analytical tools that analyze past data. They do not predict future price movement or guarantee that institutional traders are active at identified levels. Market conditions change, and session patterns that worked historically may not work in the future.
VWAP and volume distribution levels can fail to provide support/resistance. Session highs and lows can be broken without leading to sustained moves. Volume momentum can change rapidly. Past session behavior does not guarantee future session behavior.
Always use proper risk management, including stop losses and position sizing appropriate for your account size and risk tolerance. Never risk more than you can afford to lose. Consider consulting with a qualified financial advisor before making investment decisions.
The author is not responsible for any losses incurred from using this indicator. Users assume full responsibility for all trading decisions made using this tool.
-Made with passion by officialjackofalltrades Gösterge

Rolling Trendline [LuxAlgo]The Rolling Trendline indicator provides a dynamic, self-adjusting trendline that tracks price action using linear regression slope projections and automatically resets when price deviates beyond a specific threshold.
🔶 USAGE
The indicator is designed to provide a continuous trend bias without the "lag" often associated with static linear regression lines. It projects a line forward based on a calculated slope and only shifts its trajectory when the market demonstrates a significant change in momentum.
The addition of ATR-based volatility zones allows traders to visualize a range of expected price action around the projected trend, providing a buffer that accounts for market volatility at the time of each trend reset.
🔹 Interpreting the Line and Zones
Bullish Phase (Green): Indicates an upward-sloping trajectory. The trendline and its surrounding ATR zones will be colored green, suggesting a bullish bias.
Bearish Phase (Red): Indicates a downward-sloping trajectory. The trendline and its surrounding ATR zones will be colored red, suggesting a bearish bias.
ATR Zones: These shaded areas represent a volatility-adjusted range. As long as price remains within the deviation threshold, the zones follow the trendline's trajectory.
Reset Points: Visualized by a small circle and a break in the line, these occur when price moves too far from the projection. At this moment, the indicator re-anchors to the current price and recalculates both the slope and the ATR zone width.
🔶 DETAILS
The indicator follows a specific logic flow to maintain its "Rolling" characteristic:
1. Slope Calculation: It calculates the Linear Regression slope over a user-defined lookback period. This slope represents the average rate of change in price.
2. Projection: On every new bar, the indicator projects the next value of the trendline by adding the active slope to the previous trendline value.
3. Deviation Check: The indicator calculates a Standard Deviation threshold. If the distance between the current price and the projected trendline value exceeds this threshold, a reset is triggered.
4. Re-Anchoring: Upon a reset, the trendline "rolls" to the current price and adopts the most recent linear regression slope. Simultaneously, it captures the current ATR to set the width of the new trend zones.
🔶 SETTINGS
🔹 Trend Settings
Slope Lookback: The period used to calculate the linear regression slope. Higher values result in a slope that considers more historical data.
Deviation Multiplier: Determines how far price can deviate from the trendline before a reset occurs.
Slope Divisor: This setting allows you to tame the trajectory of the line. Higher values divide the captured slope, resulting in flatter trendlines.
Source: The price data used for all calculations (default is Close).
🔹 ATR Zones
ATR Length: The lookback period used for the Average True Range calculation, which determines the width of the volatility bands.
ATR Multiplier: Controls the width of the shaded zones around the trendline.
🔹 Visuals
Bullish/Bearish Trend Colors: Customizes the colors for the trendline and zones based on the slope direction.
Zone Color: Sets the base color for the ATR area fills.
Line Width: Adjusts the thickness of the primary rolling trendline.
Gösterge

Gösterge

Automatic Trendline [Metrify]Metrify Automatic Trendlines is an auto-drawing support/resistance channel built around pivot clustering + scoring, not “connect two perfect points”. The script continuously collects swing pivots (high/low) over a configurable lookback window, then searches for the best single support line and the best single resistance line that behave like a human-drawn trendline: multiple interactions, controlled slope, limited break-throughs, and (most importantly) still relevant to the current price. (configurable in "Max Relevance Distance" input)
The fundamental problem with algorithmic trendlines is subjectivity. To solve this mathematically, we treat trendlines as a statistical regression problem with specific constraints. We do not use linear regression on all candles, instead, we use a brute-force iterative approach on specific "Pivot Points."
The logic operates on a simple premise: Generate every possible line between past swing points, validate them against price history, score them based on fit, and render only the winner.
The Calculation Engine (f_find_best_line)
This function contains the primary computational load. It performs a nested loop operation:
Outer Loop (newer): Iterates through recent pivots.
Inner Loop (older): Iterates through older pivots to form a candidate line segment.
For every pair of pivots (P1,P2), we calculate the slope (m) and the y-intercept concept. This gives us a tentative trendline equation:
y=mx+c
The Scoring Matrix
We assign a score to each candidate line based on weighted heuristics:
Touch Count (touches * 2.8): The primary driver. More touches = higher statistical significance.
Recency (recency * 1.2): Lines originating closer to the current price action are weighted higher.
Tightness (avgErr): We calculate the average distance of all touches from the line. A "tighter" fit (lower error) increases the score.
Penalties:
violations * 2.2: False breaks heavily penalize the score.
barBreakRatio * 2.0: If the line cuts through candle bodies (even if pivots are fine).
The line with the highest localBest score is returned as the dominant trendline.
What you can use it for?
This is a structure visualizer that tries to keep a clean, current S/R channel on screen with volatility-aware rules. It’s not a signal generator, it doesn’t predict breakouts, and it won’t always draw something, if the market is messy and no line survives the filters, it will show none instead of hallucinating geometry. If you need more lines (multiple concurrent channels), that’s a different design tradeoff (and usually becomes clutter + false confidence fast). Gösterge

Session Auction State Engine (SASE) Summary in one paragraph
Session Auction State Engine (SASE) is a session context indicator for liquid futures, FX, equities, and crypto on intraday to daily timeframes. It classifies the current session into one of four auction regimes, Balanced, Early trend, Trend continuation, or Failed auction, so you act only when multiple acceptance and expansion conditions align. It is original because it outputs a single interpretable auction state, not buy and sell signals, by combining time acceptance, range expansion, and return to value logic into a compact dashboard. Add it to a clean chart, read the table for Action and permissions, and use the optional markers and bands for quick visual context. Shapes can move while the bar is open and settle on close, for conservative workflows use alerts on bar close.
Scope and intent
• Markets. Major index futures, major FX pairs, large cap equities, liquid crypto
• Timeframes. 1 minute to daily
• Default demo used in the publication. ES1! on 5 minute
• Purpose. Prevent premature directional decisions by forcing regime confirmation before direction is considered actionable
• Limits. Indicator only. No backtest, no execution, no performance claims
Originality and usefulness
This is not a mashup of common indicators. It is a session auction classifier with an explicit decision hierarchy.
• Unique concept or fusion. A regime engine that gates trading by session auction state using Initial Balance, value acceptance, expansion, and return to value confirmation
• What failure mode it addresses. False starts in chop, early breakouts that never gain acceptance, and trend chasing inside balanced sessions
• Testability. Inputs expose each component and the table shows the state, direction, and pass or fail checklist so users can verify why a state appears and tune thresholds
• Portable yardstick. Expansion is normalized by an expected range unit (ATR based), so thresholds scale across symbols with different point values
Method overview in plain language
SASE runs inside a user defined session window. It builds an Initial Balance (IB), then evaluates whether the market is accepting prices outside value and outside IB, whether the session is expanding beyond IB, and whether price returns to value after a failed excursion.
Base measures
• Range basis. Value width is ATR of the chart timeframe over the Width ATR length, multiplied by Width ATR multiplier
• Normalization basis. Expected range is ATR, either daily or intraday based on Expected range mode, used to normalize session extension
Components
• Initial Balance (IB). High and low during the first IB minutes of the session. IB defines the first acceptance boundary
• Value anchor. A session anchored VWAP or TWAP (or auto) used as a value center
• Value width. ATR based band around value used to measure inside value and outside value
• Acceptance. Two acceptance channels are tracked, closes outside value in the breakout direction and closes outside IB in the breakout direction. An EMA plus a short streak score turns this into an acceptance strength metric
• Extension. Maximum distance beyond IB, normalized by expected range, measures range expansion
• Balance. An EMA of time spent inside the value band measures how rotational versus directional the session is
• Failed auction. Requires a real excursion outside value first, then a sustained return inside value, plus an acceptance collapse and a rebalance increase, optionally requiring price to be back inside IB
Fusion rule
SASE outputs exactly one state per bar inside the session.
• Balanced. No confirmed breakout from IB, or conditions indicate rotational trade, high balance, low acceptance, low extension
• Early trend. Breakout exists, but trend continuation checklist is not complete yet
• Trend continuation. All trend gates pass at once: enough time since breakout, acceptance above threshold, extension above threshold, and balance below threshold
• Failed auction. After an excursion outside value, price returns and holds inside value while acceptance collapses and balance rises, optionally requiring price back inside IB
Signal rule
This script does not issue trade signals. It outputs context.
• Direction is shown only when state is not Balanced
• The dashboard shows a Trend checklist (T, A, E). Trend continuation requires T pass, A pass, and E pass
• Early trend indicates direction may be forming but confirmation is incomplete
• Failed auction indicates the prior directional attempt was rejected and mean reversion conditions are stronger
What you will see on the chart
• Optional markers. Key markers appear on state transitions, typically when Trend continuation or Failed auction begins, depending on the Markers setting
• Optional reference levels. IB high and IB low lines, and value center plus value bands
• Optional background and bar color. Off by default for chart cleanliness
• Compact dashboard. A table showing state, direction, Action, permissions, IB progress, checklist, and component gauges
Table fields and quick reading guide
• State badge. Current auction state
• Direction. Up or Down when state is not Balanced, otherwise None
• Action. Plain language instruction for the current state
• Use. Two permissions, Trend and MeanRev, shown as ON or OFF
• IB. Progress and status, Wait until Complete
• Trend. Ready percent plus checklist T, A, E
• Accept. Acceptance strength and whether it meets the trend threshold
• Extend. Extension strength and whether it meets the trend threshold
• Balance. Balance score and whether it is low enough for trend continuation
• Fail. Excursion and return to value progress when relevant
Reading tip. Trend continuation is only intended when T, A, and E are all passing. If Balanced, do not force direction.
Inputs with guidance
Setup
• Session. Defines when the engine is active. Verify timezone and hours when changing symbol or venue
• Session timezone. Exchange or a named timezone
• Show last session snapshot when closed. When enabled, the table displays the last in session state after the session ends
Logic
• IB minutes. Typical 30 to 90. Higher reduces noise but delays classification
• Value anchor. Auto is recommended. VWAP requires reliable volume, TWAP is volume agnostic
• Value reference. Freeze at IB reduces value drift and makes acceptance and failed auction logic more stable
• Width ATR length. Typical 14 to 30. Higher smooths value width
• Width ATR multiplier. Typical 0.5 to 1.2. Higher widens value and increases Balanced time
• Breakout buffer as width fraction. Typical 0.1 to 0.4. Higher requires cleaner breakouts
• Acceptance EMA length. Typical 20 to 60. Higher reduces flicker
• Acceptance streak bars. Typical 4 to 10. Higher requires sustained acceptance
• Early trend acceptance threshold. Typical 0.25 to 0.45
• Trend continuation acceptance threshold. Typical 0.45 to 0.70
• Balance EMA length. Typical 30 to 80
• Trend continuation max balance. Typical 0.30 to 0.55. Lower makes trend continuation stricter
• Balanced min balance. Typical 0.55 to 0.80
• Trend continuation min bars since breakout. Typical 10 to 30
• Extension thresholds. Early 0.10 to 0.25, Trend 0.20 to 0.50, in expected range units
• Failed auction window bars. Typical 15 to 40. Larger windows require more sustained rejection
• Failed auction thresholds. Acceptance max 0.10 to 0.30, Balance min 0.55 to 0.80
• State change confirm bars. Typical 1 to 4
• Return to Balanced confirm bars. Typical 4 to 12
• Minimum bars to keep non Balanced state. Typical 6 to 20, increases stability
UI
• Theme. Dark or Light
• Dashboard position. Corner selection
• Markers. Off, Key only, or All changes
• Background tint and bar color. Off by default to keep charts readable
• Show IB lines and Show value bands. Off by default, enable for learning or debugging
Usage recipes
Intraday trend focus
• IB minutes 60
• Value reference Freeze at IB
• Breakout buffer 0.25
• Trend confirm bars 18
• Accept trend threshold 0.55
• Extend trend threshold 0.30
• Trend max balance 0.40
Goal. Trade only when Trend continuation is active and checklist is fully passing
Intraday mean reversion focus
• IB minutes 30 to 60
• Value reference Freeze at IB
• Wider value width, raise Width ATR multiplier to 0.9 to 1.2
• Raise Balanced min balance to 0.70
• Keep Markers on Key only
Goal. Focus on Balanced and Failed auction states, avoid early trend and trend continuation trades
Swing continuation
• Use 60 minute or 240 minute chart
• Expected range mode Daily ATR
• Trend confirm bars 12 to 30 depending on timeframe
• Raise Width ATR length to 30
Goal. Use Trend continuation as a higher level regime gate, then use your own entry timing tool inside that regime
Realism and responsible publication
• No performance claims. Past results never guarantee future outcomes
• Intrabar motion reminder. Shapes and table values can update while a bar forms and settle on close
• Session windows use the chart exchange time unless you override timezone. Verify hours when changing symbol or venue
Honest limitations and failure modes
• News releases and liquidity gaps can break normal auction behavior and can trigger rapid state transitions
• Symbols with unreliable volume may work better using TWAP or Auto rather than VWAP only
• Very quiet regimes can reduce contrast between Balanced and Early trend, consider longer windows or higher thresholds
• Non standard chart types can distort session and IB calculations, use standard candles for evaluation
Open source reuse and credits
None
Legal
Education and research only. Not investment advice. You are responsible for your decisions. Test on historical data and in simulation before any live use. Use realistic costs in any external testing workflow. Gösterge
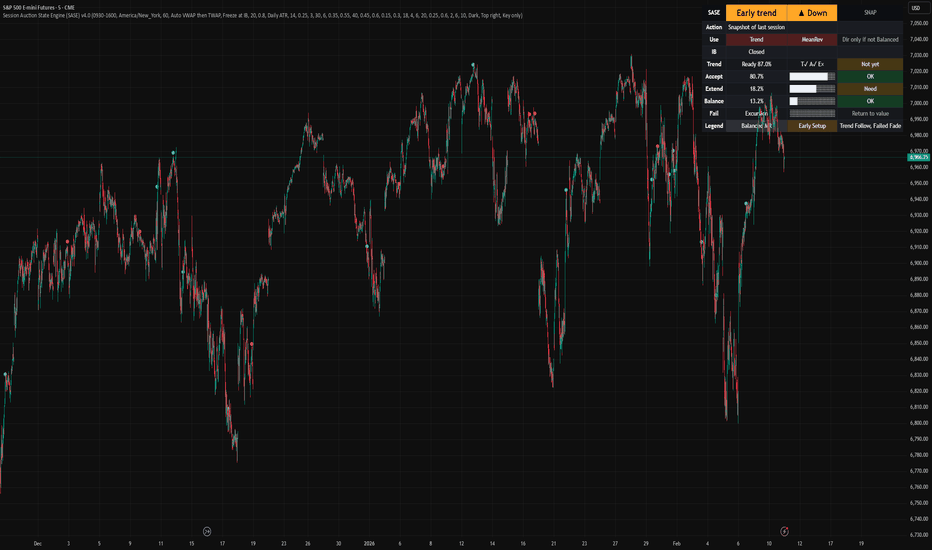
Luminous Market Flux [Pineify]Luminous Market Flux - Dynamic Volatility Channel with Breakout Detection
The Luminous Market Flux indicator is a sophisticated volatility-based trading tool that combines dynamic channel analysis with breakout detection and squeeze identification. This indicator helps traders visualize market conditions by creating an adaptive envelope around price action, highlighting periods of compression (low volatility) and expansion (high volatility) while generating actionable buy and sell signals at key breakout moments.
Key Features
Dynamic volatility channel that adapts to changing market conditions using ATR-based calculations
Visual squeeze detection system that warns traders when volatility is contracting
Automatic breakout signal generation for both bullish and bearish scenarios
Luminous gradient fill that provides instant visual feedback on price position within the channel
Bar coloring feature that highlights strong volatility breakouts
Built-in alert conditions for automated trading notifications
How It Works
The indicator operates on three core calculation layers:
1. Baseline Calculation (Central Tendency)
The foundation uses a Running Moving Average (RMA) of the closing price over the specified Flux Length period. RMA was specifically chosen over SMA or EMA because it provides smoother trend detection similar to how RSI and ATR calculations work, reducing noise while maintaining responsiveness to genuine price movements.
2. Volatility Measurement
The channel width is determined by the Average True Range (ATR) multiplied by the Flux Expansion Factor. ATR captures the true volatility of the market by accounting for gaps and limit moves, making the channel responsive to actual market conditions rather than just closing price variations.
3. Squeeze Detection Logic
The indicator compares the current channel width against a 100-period simple moving average of historical channel widths. When the current range falls below 80% of this average, a squeeze condition is identified, signaling that volatility is compressing and a significant move may be imminent.
Trading Ideas and Insights
Breakout Trading: Enter long positions when price breaks above the upper flux channel with a BUY signal, and short positions when price breaks below the lower channel with a SELL signal. These breakouts indicate strong momentum in the direction of the move.
Squeeze Anticipation: When squeeze circles appear at the top of the chart, prepare for a potential explosive move. Squeezes often precede significant breakouts as the market coils before releasing energy in one direction.
Trend Confirmation: Use the bar coloring feature to confirm trend strength. Colored bars indicate that price is trading outside the volatility envelope, suggesting strong directional momentum.
Mean Reversion: When price is within the channel (no bar coloring), the gradient fill helps identify whether price is closer to the upper or lower boundary, potentially useful for mean-reversion strategies.
How Multiple Indicators Work Together
This indicator integrates several technical concepts into a cohesive system:
The RMA baseline provides the trend anchor, while the ATR-based envelope adapts to volatility conditions. These two components work together to create a channel that expands during volatile periods and contracts during quiet markets. The squeeze detection layer adds a third dimension by comparing current volatility to historical norms, alerting traders when the market is unusually quiet.
The visual elements reinforce this analysis: the gradient fill shows price position within the channel at a glance, bar coloring confirms breakout strength, and shape markers provide discrete entry signals. This multi-layered approach ensures traders receive consistent information across different visualization methods.
Unique Aspects
The "Luminous" visual design uses color gradients that dynamically shift based on price position, creating an intuitive heat-map effect within the channel
Unlike traditional Bollinger Bands that use standard deviation, this indicator uses ATR for volatility measurement, making it more responsive to actual price range movements
The squeeze detection compares current volatility to a longer-term average (100 periods), providing context-aware compression signals rather than arbitrary thresholds
Signal generation uses proper state tracking to ensure breakout signals only fire on the initial breakout, not on every bar during an extended move
How to Use
Add the indicator to your chart. It will overlay directly on price with the volatility channel visible.
Watch for BUY labels appearing below bars when price breaks above the upper channel - these indicate bullish breakout opportunities.
Watch for SELL labels appearing above bars when price breaks below the lower channel - these indicate bearish breakout opportunities.
Monitor for small circles at the top of the chart indicating squeeze conditions - prepare for potential breakouts when these appear.
Use the colored bars as confirmation of breakout strength - green bars confirm bullish momentum, red bars confirm bearish momentum.
Set up alerts using the built-in alert conditions to receive notifications for buy signals, sell signals, and squeeze warnings.
Customization
Flux Length (default: 20): Controls the lookback period for both the baseline and ATR calculations. Lower values create more responsive but noisier channels; higher values create smoother but slower-reacting channels.
Flux Expansion Factor (default: 2.0): Multiplier for the ATR value that determines channel width. Higher values create wider channels with fewer signals; lower values create tighter channels with more frequent signals.
Smooth Signal : Toggle for signal smoothing preference.
Bullish Energy : Customize the color for bullish breakouts and upper channel highlights.
Bearish Energy : Customize the color for bearish breakouts and lower channel highlights.
Compression/Neutral : Customize the color for squeeze indicators and neutral channel states.
Conclusion
The Luminous Market Flux indicator provides traders with a comprehensive volatility analysis tool that combines channel-based trend detection, squeeze identification, and breakout signaling into a single, visually intuitive package. By using ATR-based volatility measurement and RMA smoothing, the indicator adapts to changing market conditions while filtering out noise. Whether you are a breakout trader looking for momentum entries or a swing trader waiting for volatility expansion after compression periods, this indicator offers the visual clarity and signal precision needed to make informed trading decisions.
Gösterge
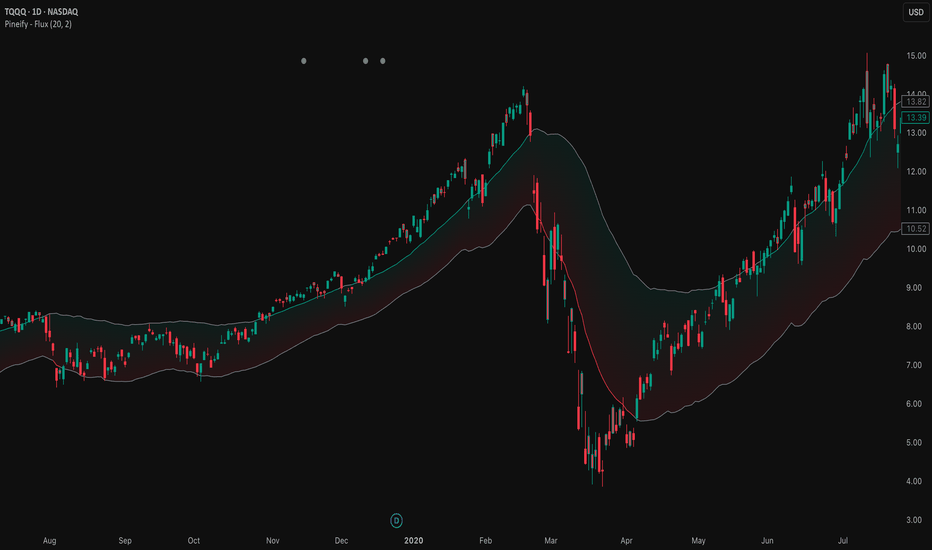
Gösterge

Gösterge

Blockcircle FTR - Follow Through ReversalWHAT THIS INDICATOR DOES
Blockcircle FTR identifies failed directional moves followed by quality reversals. The indicator tracks structural pivot levels, monitors price interactions with those levels, and validates reversal sequences against a configurable threshold.
A trend filter provides macro context so you can evaluate whether signals align with or oppose the broader direction.
KEY FEATURES
Reversal quality filtering via delivery threshold requirement
Sweep confirmation when reversals follow liquidity grabs at structural levels
ATR-adaptive origin zones marking reversal starting points
Trend alignment indicator comparing signal bias to moving average direction
Volume validation filter for participation confirmation
Real-time dashboard with signal statistics and alignment status
DETAILED BREAKDOWN
Structural Level Tracking
The indicator identifies pivot highs and lows based on the Structure Lookback parameter. These pivots serve as reference levels where liquidity typically accumulates. Levels remain active until price interacts with them or they exceed the Level Lifespan setting.
When the price reaches a structural level, this interaction is logged. If a reversal then forms in the opposite direction within the Sweep Window, the signal qualifies as sweep-confirmed, indicating that stops were likely triggered before the move reversed.
FTR Detection Logic
The core detection looks for a specific sequence: a directional attempt that fails to follow through, followed by a counter-move that meets the Delivery Threshold ratio. This ratio measures the quality of the reversal relative to the failed move's structure.
Higher threshold values (closer to 1.0) require cleaner, more convincing reversals. Lower values (closer to 0.1) allow weaker setups through. The default of 0.7 provides reasonable filtering without being overly restrictive.
Trend Context Filter
A moving average (EMA or SMA, configurable period) provides simple trend context. The dashboard displays three related metrics:
Trend: Current price position relative to the MA (Bullish/Bearish)
FTR Bias: Direction of the most recent confirmed signal (Long/Short)
Aligned: Whether these two readings match (Yes/No)
This helps identify situations where the FTR bias has become stale or is positioned against the prevailing trend.
Signal Classification
Standard signals appear as small triangles and represent FTR patterns that passed the delivery threshold and any active filters.
Sweep-confirmed signals appear with an "S" label and represent the subset of signals where price swept a structural level shortly before the reversal formed. These carry higher conviction due to the additional liquidity context.
Dashboard Metrics
The information panel provides:
Current trend direction and FTR bias
Alignment status between the two
Bars elapsed since the last signal
Running totals for long and short signals
Sweep-confirmed counts in parentheses
Volume filter status
Configuration Parameters
Structure Lookback: Bars used for pivot detection. Higher values capture more significant swings.
Delivery Threshold: Minimum ratio for valid reversals. Range 0.1 to 1.0.
Level Lifespan: The maximum bars a structural level remains active.
Sweep Window: Lookback period for sweep confirmation.
Trend MA Period: Moving average length for trend context.
Volume Spike Multiple: Required volume ratio when volume filter is active.
Zone Depth: Origin zone width as ATR multiple.
Practical Application
Sweep-confirmed signals with trend alignment represent the highest-conviction setups. These combine a quality reversal pattern, liquidity sweep context, and trend support.
Standard signals without sweep confirmation remain valid FTR patterns but warrant additional discretion.
Counter-trend signals (Aligned showing NO) can still produce valid moves, but historically carry lower probability. Consider position sizing adjustments accordingly.
Origin zones serve as potential support/resistance areas for subsequent price returns.
Important Limitations
The indicator may remain biased in the wrong direction during extended trends if no qualifying reversal pattern forms. The trend filter helps identify these situations, but does not automatically override the FTR bias.
Signal counts are calculated on visible chart history and will vary based on the loaded timeframe and bar count.
As with any technical tool, signals should be evaluated within the broader market context rather than traded mechanically.
Hope you find it useful! If you have any questions, please don't hesitate to ask them! Gösterge
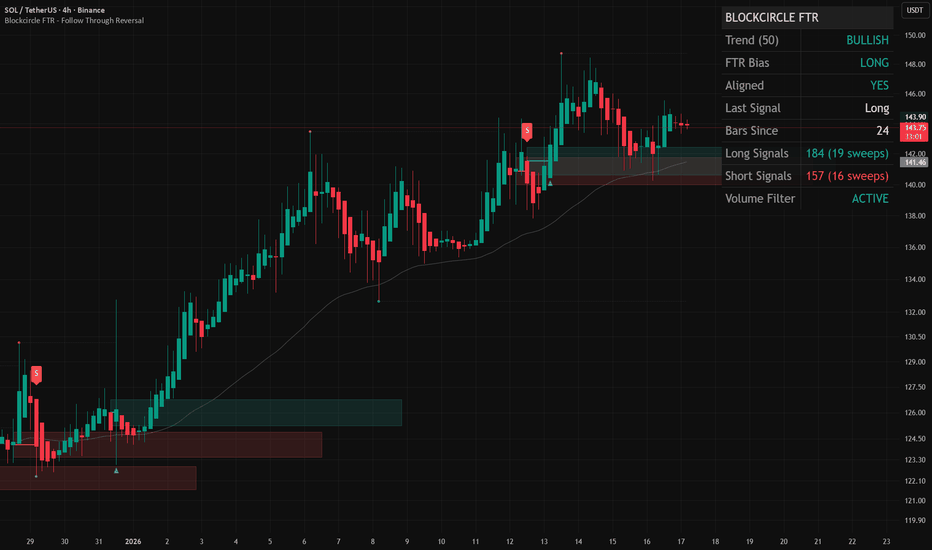
Gösterge

Gösterge

Trend Break Targets [MarkitTick]Trend Break Targets
Trend Break Targets is a technical analysis tool designed to assist traders in identifying trendline breakouts and projecting potential price targets based on market geometry. Unlike fully automated indicators that guess trendlines, this tool provides you with precise control by allowing you to manually Pivot Point the trendline to specific points in time, while automating the complex math of target projection and structure mapping.
Theoretical Basis & Concepts
This indicator is grounded in classic technical analysis principles found in foundational trading literature. It automates the following methodology:
Drawing a trend line between two key points to represent dynamic support or resistance.
Identifying a breakout when the price closes above or below this line, potentially signaling a change in trend.
Calculating a price target by measuring the vertical distance between the breakout line and the last high/low (pivot), then projecting that same distance in the direction of the breakout.
This concept is based on methods and "Measured Move" theories explained in classic books such as "Technical Analysis of Stock Trends" by Edwards & Magee, "Technical Analysis of the Financial Markets" by John Murphy, and in Thomas Bulkowski's Price Pattern Studies.
How It Works
Pivot Pointed Trendline Construction The script draws a trendline between two user-defined points in time (Start Date and End Date). It calculates the slope between these points and extends the line infinitely to the right, allowing you to define the exact structure (e.g., a resistance trendline on a wedge).
Breakout Detection The script monitors the "Price Source" (High, Low, or Close) relative to the extended trendline.
A Bullish Breakout (BC) occurs when the Close crosses above a bearish trendline.
A Bearish Breakout (BC) occurs when the Close crosses below a bullish trendline.
Dynamic Target Projection (The Math) Upon a confirmed breakout, the script automatically calculates three distinct targets by identifying the most significant "Swing Point" (Pivot) prior to the breakout.
Distance (D): The vertical distance between the Trendline and the Pivot Price at the specific bar where the pivot occurred.
Target 1 (T1): The Breakout Price +/- (Distance × 1.0). This represents a classic 1:1 measured move.
Target 2 (T2): The Breakout Price +/- (Distance × 1.618). Based on the Golden Ratio extension.
Target 3 (T3): The Breakout Price +/- (Distance × 2.618).
Market Structure (CHOCH) The script includes an optional Change of Character (CHOCH) module. This runs independently of the trendline logic, identifying local Swing Highs and Swing Lows based on the "Swing Detection Length." It plots dashed lines and labels to visualize immediate shifts in market structure.
How to Use This Tool
This is an interactive tool that requires user input to define the setup.
Identify a Setup: Locate a clear trend, wedge, or flag pattern on your chart.
Set Pivot Points: Go to the Indicator Settings. Input the exact Start Date and End Date corresponding to the two main touches of your trendline.
Monitor for Breakout: The script will extend the line. Wait for a "BC" label to appear.
Trade Management: Once "BC" prints, the T1, T2, and T3 lines will instantly render. These can be used as potential take-profit zones or areas to tighten stop-losses.
Settings & Configuration
Indicator Settings
Start/End Date: The timestamp Pivot Points for your trendline.
Price Source: Determines what price (High or Low) Pivot Points the line and triggers the breakout.
Pivot Left/Right: Adjusts the sensitivity for finding the "Pivot Before Break" used for target calculations.
Extend Target Line: How far forward the target lines are drawn.
Visual Style
Colors: Fully customizable colors for the Trendline, Breakout Labels, and each Target level (T1, T2, T3).
Gold Bullish Reversal
This analysis dissects a confirmed bullish reversal on Gold using a custom Trend Break system. The setup identifies a transition from a bearish corrective phase to bullish momentum, validated by a structural break and a geometric target projection.
Trend Identification (The Pivot Points) The descending white trendline serves as the primary dynamic resistance, defining the bearish correction.
Pivot Points: The line is drawn connecting two significant swing highs, marked by Label 1 and Label 2.
Logic: These points represent the "lower highs" characteristic of the previous downtrend. As long as price remained below this trajectory, the bearish bias was intact.
The Trigger: Breakout & Confirmation The transition occurs at the candle marked BC (Breakout Candle).
Breakout Criteria: The indicator logic dictates that a signal is only valid when the bar closes above the trendline. This filters out intraday wicks and ensures genuine buyer commitment.
CHOCH Confluence: Immediately following the breakout, a CHOCH (Change of Character) label appears. This signals a shift in market structure, indicating that the internal lower-high/lower-low sequence has been violated, adding probability to the reversal.
Target Projection: The Measured Move The vertical green lines (T1, T2) represent profit objectives derived from the depth of the prior move. The logic calculates the distance between the breakout line and the lowest pivot prior to the break.
T1 (Standard Target): This is a 1:1 projection of the pre-breakout volatility. We see price action initially stalling near this level, confirming it as a zone of interest.
T2 (Golden Ratio Extension): The second target is calculated as the initial distance multiplied by 1.618 (Fibonacci Golden Ratio). The chart shows the price rallying aggressively through T1 to tap the T2 zone, often considered an exhaustion or major take-profit level in harmonic extensions.
Conclusion Gold has successfully invalidated the 4-hour bearish trendline. The confluence of a confirmed close above resistance (BC) and a structural shift (CHOCH) provided a high-probability long setup. The price has now fulfilled the T2 (1.618) extension, suggesting traders should watch for consolidation or a reaction at this key Fibonacci resistance level.
Bearish Trendline Breakdown
The image displays a Bearish Trendline Breakdown on the Gold (XAUUSD) 4-hour chart. The indicator is actually functioning in "Low" mode here (connecting swing lows to form support), which triggers the bearish logic found in the code. Here is the step-by-step breakdown:
The Setup: Pivot Points & Trendline
Visual: The Blue Labels "1" and "2" connected by a white diagonal line.
Code Logic: These are the user-defined start and end points.
Pivot Point 1 (startDate): The starting pivot of the trendline.
Pivot Point 2 (endDate): The ending pivot.
Trendline: The code draws a line between these two points and extends it to the right (extend.right). In this specific image, the line acts as a Support Trendline.
The Trigger: Break Candle (BC)
Visual: The Red Label "BC" appearing just below the white trendline.
Code Logic: This is the execution signal. The code detects a "Down Break" (dnBreak) because the Price Source was likely set to "Low" and the candle's Close was lower than the Trendline Price at that specific bar (close < currLinePrice). This confirms the support level has been breached.
The Projection: Targets (T1 & T2)
Visual: The Green Labels "T1" and "T2" with dotted horizontal lines projected downward.
Code Logic: These are profit targets based on a "Measured Move."
Pivot Calculation: The script looks back for a recent "Pivot High" (the peak before the crash) to calculate the volatility/distance (dist) between that peak and the trendline.
T1 (Conservative): The price is projected downward by 1x that distance (currLinePrice - dist).
T2 (Extended): The price is projected downward by 1.618x that distance (Golden Ratio extension).
Market Context: CHOCH
Visual: The small Red/Orange "CHOCH" labels appearing above the price action.
Code Logic: This is a secondary confirmation system running independently of the trendline. It detects a Change of Character (structural shift). The red labels indicate a "Bearish CHOCH," meaning the price broke below a significant prior swing low (last_swing_low). This supports the bearish bias of the trendline break.
Disclaimer This tool is for educational and technical analysis purposes only. Breakouts can fail (fake-outs), and past geometric patterns do not guarantee future price action. Always manage risk and use this tool in conjunction with other forms of analysis. Gösterge

Trend detection zero lag Trend Detection Zero-Lag (v6)
Trend Detection Zero-Lag is a high-performance trend identification indicator designed for intraday traders, scalpers, and swing traders who require fast trend recognition with minimal lag. It combines a zero-lag Hull Moving Average, slope analysis, swing structure logic, and adaptive volatility sensitivity to deliver early yet stable trend signals.
This indicator is optimized for real-time decision-making, particularly in fast markets where traditional moving averages react too slowly.
Core Features
🔹 Zero-Lag Trend Engine
Uses a Zero-Lag Hull Moving Average (HMA) to reduce lag by approximately 40–60% versus standard moving averages.
Provides earlier trend shifts while maintaining smoothness.
🔹 Multi-Factor Trend Detection
Trend direction is determined using a hybrid engine:
HMA slope (momentum direction)
Rising / falling confirmation
Swing structure detection (HH/HL vs LH/LL)
ATR-adjusted dynamic sensitivity
This approach allows fast flips when conditions change, without excessive noise.
Adaptive Volatility Sensitivity
Sensitivity dynamically adjusts based on ATR relative to price
In high volatility: faster reaction
In low volatility: smoother, more stable trend state
This ensures the indicator adapts across:
Trend days
Range days
Volatility expansion or contraction
Trend Duration Intelligence
The indicator tracks historical trend durations and maintains a rolling memory of recent bullish and bearish phases.
From this, it calculates:
Current trend duration
Average historical duration for the active trend direction
This helps traders gauge:
Whether a trend is early, mature, or extended
Probability of continuation vs exhaustion
Strength Scoring
A normalized Trend Strength Score (0–100) is calculated using:
Zero-lag slope magnitude
ATR normalization
This provides a quick read on:
Weak / choppy trends
Healthy trend continuation
Overextended momentum
Visual Design
Color-coded Zero-Lag HMA
Bullish trend → user-defined bullish color
Bearish trend → user-defined bearish color
Designed for dark mode / neon-style charts
Clean overlay with no clutter
Trend Detection Zero-Lag is built for traders who need:
Faster trend recognition
Adaptive behavior across market regimes
Structural confirmation beyond simple moving averages
Clear, actionable visual signals Gösterge

Trend Vector Pro v2.0Trend Vector Pro v2.0
👨💻 Developed by: Mohammed Bedaiwi
💡 Strategy Overview & Coherence
Trend Vector Pro (TVPro) is a momentum-based trend & reversal strategy that uses a custom smoothed oscillator, an optional ADX filter, and classic Pivot Points to create a single, coherent trading framework.
Instead of stacking random indicators, TVPro is built around these integrated components:
A custom momentum engine (signal generation)
An optional ADX filter (trend quality control)
Daily Pivot Points (context, targets & S/R)
Swing-based “Golden Bar” trailing stops (trade management)
Optional extended bar detection (overextension alerts)
All parts are designed to work together and are documented below to address originality & usefulness requirements.
🔍 Core Components & Justification
1. Custom Momentum Engine (Main Signal Source)
TVPro’s engine is a custom oscillator derived from the bar midpoint ( hl2 ), similar in spirit to the Awesome Oscillator but adapted and fully integrated into the strategy. It measures velocity and acceleration of price, letting the script distinguish between strong impulses, weakening trends, and pure noise.
2. ADX Filter (Trend Strength Validation – Optional)
Uses Average Directional Index (ADX) as a gatekeeper.
Why this matters: This prevents the strategy from firing signals in choppy, non-trending environments (when ADX is below the threshold) and keeps trades focused on periods of clear directional strength.
3. Classic Pivot Points (Context & Targets)
Calculates Daily Pivot Points ( PP, R1-R3, S1-S3 ) via request.security() using prior session data.
Why this matters: Momentum gives the signal, ADX validates the environment, and Pivots add external structure for risk and target planning. This is a designed interaction, not a random mashup.
🧭 Trend State Logic (5-State Bar Coloring)
The strategy uses the momentum's value + slope to define five states, turning the chart into a visual momentum map:
🟢 STRONG BULL (Bright Green): Momentum accelerating UP. → Strong upside impulse.
🌲 WEAK BULL (Dark Green): Momentum decelerating DOWN (while positive). → Pullback/pause zone.
🔴 STRONG BEAR (Bright Red): Momentum accelerating DOWN. → Strong downside impulse.
🍷 WEAK BEAR (Dark Red): Momentum decelerating UP (while negative). → Rally/short-covering zone.
🔵 NEUTRAL / CHOP (Cyan): Momentum is near zero (based on noise threshold). → Consolidation / low volatility.
🎯 Signal Logic Modes
TVPro provides two selectable entry styles, controlled by input:
Reversals Only (Cleaner Mode – Default): Targets trend flips. Entry triggers when the current state is Bullish (or Bearish) and the previous state was not. This reduces noise and over-trading.
All Strong Pulses (Aggressive Mode): Targets acceleration phases. Entry triggers when the bar turns to STRONG BULL or STRONG BEAR after any other state. This mode produces more trades.
📌 Risk Management Tools
🟡 Golden Bars – Trailing Stops: Yellow “Trail” Arrows mark confirmed Swing Highs/Lows. These are used as logical trailing stop levels based on market structure.
Extended Bars: Detects when price closes outside a 2-standard-deviation channel, flagging overextension where a pullback is more likely.
Pivot Points: Used as external targets for Take Profit and structural stop placement.
⚙️ Strategy Defaults (Crucial for Publication Compliance)
To keep backtest results realistic and in line with House Rules, TVPro is published with the following fixed default settings:
Order Size: 5% of equity per trade ( default_qty_value = 5 )
Commission: 0.04% per order ( commission_value = 0.04 )
Slippage: 2 ticks ( slippage = 2 )
Initial Capital: 10,000
📘 How to Trade with Trend Vector Pro
Entry: Take Long when a Long signal appears and confirm the bar is Green (Bull state). Short for Red (Bear state).
Stop Loss: Place the initial SL near the latest swing High/Low, or near a relevant Pivot level.
Trade Management: Follow Golden (Trail) Arrows to trail your stop behind structure.
Exits: Exit when: the trailing stop is hit, Price reaches a major Pivot level, or an opposite signal prints.
🛑 Disclaimer
This script is for educational purposes only and does not constitute financial advice. Past performance does not guarantee future results. Always forward-test and use proper risk management before applying any strategy to live trading.
Strateji