Gösterge

Thrax - Intraday Market Pressure ZonesTHRAX - INTRADAY MARKET PRESSURE ZONES
This indicator identifies potential support and resistance zones based on areas of significant market pressure. It dynamically plots these zones and adjusts their visibility based on real-time price action and user-defined thresholds. The indicator is useful for traders seeking to understand intraday market pressure, visualize zones of potential price reversals, and analyze volume imbalances at critical levels.
1. Support/Resistance Zones: Wherever the price retraces significantly from its high a support zone is drawn and when it retraces significantly from it low a resistance zone is drawn. The significant retracing is measured by the wick threshold percentage. For instance, if set to 75%, it implies price retracement of 75% either from high or from low for a particular candel
Volume delat: Displays volume delta information where the zones are formed. This can be used by trader to consider only those zones where delta is significant.
2. Breakout Detection: Monitors for price breakouts beyond established zones, deleting zones that are invalidated by price movement. when the price breaks a given zone with the threshold, it is considered to be mitigated and chances of trend continuation is decent.
Candle Coloring: Uses color codes (green, red, and yellow) to represent bullish, bearish, and indecisive (doji) candles, aiding quick visual assessment.
INPUTS
1. Wick Threshold (%) : Sets the minimum wick percentage required for a candle to be considered a support or resistance candidate.
2. Breakout Threshold (%) : Determines the percentage above or below a support or resistance zone that defines a breakout condition. if breaks a zone with the set threshold then the zone will be considered mititgated.
3. Max Number of Support/Resistance Zones : Limits the maximum number of support/resistance zones displayed on the chart, ranging from 1 to 5.
4. Show Wick Percentage Labels : Toggles the display of percentage values for upper and lower wicks on each candle.
TRADE SETUP
Identifying Entry Points: Look for the formation of support or resistance zones. Wait for price to retrace to these zones. if you are willing to take risk, you can consider even zones with low delta. If you want to be more cautious you should consider zones with high delta.
Volume Confirmation: Use the volume information to confirm the strength of the zone. Strong volume differences (displayed as labels) can indicate significant market pressure at these levels.
Breakout Trades: If price breaks through a support/resistance zone by more than the breakout threshold, consider this a signal for a potential trend continuation in the breakout direction.
Risk Management: Set stop-loss levels slightly outside of the identified zones to minimize risk in case of false breakouts. This can be set in input setting for breakout threshold.
Bonus Tip : Mark your significant highs and lows from where prices have retraced multiple times in the near past and if the zone is near these levels it can serve s a strong candidate of support or resistance
Therefore, in conclusion monitor the zones, based on delta and volume presence filter out the zone, wait for price retracement to the zone, intiate the trade with stop loss below zone with a set percentage.
Gösterge

MM Relative Volume (RVOL)What this script does:
This script shows you the "Relative Volume" (RVOL) value up to the current minute. RVOL is the volume from market open up to the current minute today, compared to the average of the same over the last n (30 by default) days.
How this script works:
There are a lot of indicators out there for RVOL, but they all take shortcuts that result in sub-par data. This indicator goes the distance to store data for every minute for the last n days for the current chart, then in sums the volume up to the current minute today along with the average of the same up-to-the-minute data from the prior n days to calculate the relative volume of the stock. It's super important to get this data up to the current minute, because most traders use this information primarily during the first 90 minutes of trading, and need to know if this value is going up or down.
How to use this script:
Relative volume can be used to gauge how "In Play" a stock is. If RVOL is less than 1 it is not "In Play" on this trading day and you might not want to trade it. If RVOL is above 2, it is "In Play" and you may want to trade it. When stocks are very "In Play", you can see an RVOL of 5 and above. The higher the RVOL the more "In Play" the stock is. You can also used RVOL for position sizing. If RVOL is <1 you may decide not to take a large position in the name. If RVOL is >3, this may give you more confidence to take a larger position as more reward and more liquidity should be present.
What makes this script original:
This particular implementation of RVOL has never been done before on TradingView to my knowledge. Most other indicators use a rolling average of the prior 30 days which is much easier to do, but this doesn't actually work properly because instead of getting large volume spikes from prior days filtered out correctly, it takes a LOT longer for those to even out as the rolling average eventually smooths down. Instead, with this indicator, any large/small volume days will truly drop off after the moving average length and the calculated average daily volume (ADV) will be accurate up to the minute. For more details on the original concept behind this indicator, check out the blog linked on my profile. Gösterge

Decoding the Volume of candlesThe indicator is designed for traders who are more interested in market structures and price action using volumes. Volume analysis can help traders build a clearer understanding of zones of buyer and seller interest, as well as liquidity gathering points (traders' stop levels).
Key Features:
The indicator visualizes on the chart the volumes selected according to the trader's chosen settings.
The indicator highlights candle volumes in selected colors, where the volume is greater individually than the volumes of the trader's chosen number of preceding candles. Or the volume that is greater than the sum of volumes of the trader's chosen number of preceding candles.
The indicator mark selected volumes on the chart based on the type of candle. The candle type (1, 2, or 3) is determined by its result (close) relative to other candles.
Volume marked for a type 3 candle draws the trader’s attention to the lack of results from the applied volume compared to the previous candle, indicating potential weakness of the candle’s owner. This is especially important in buyer or seller context areas.
Volume marked for a type 2 candle highlights the presence of results from the applied volume but only relative to the previous candle. In buyer or seller context areas, this can signal weakness of the candle’s owner.
Volume marked for a type 1 candle signals a strong result from the applied volume, indicating potential strength of the candle’s owner.
The marking of volumes can be displayed either on the main chart or on the volume chart, depending on the trader's preference. Colors and symbols for marking can be customized on the Style tab.
Volumes can be filtered on both the volume chart and the main chart according to their marking. This feature can be useful, for example, for traders who don’t work with signs of buyer or seller weakness. In such cases, they can filter out volumes only for type 1 candles.
Good luck exploring the impact of volumes on price behavior!
Gösterge

Gösterge
VWAP Periodic Close [LuxAlgo]The VWAP Periodic Close script offers an advanced tool for analyzing the Volume Weighted Average Price (VWAP) across various timeframes.
This tool enables traders to visualize VWAP close levels for daily, weekly, monthly, quarterly, and yearly periods, offering a comprehensive view of price behavior across different time frames. It helps in identifying key levels where the VWAP closes at the end of each specified period.
🔶 USAGE
This script is designed to enhance your trading strategy by plotting VWAP close levels on your chart for different time periods. This helps traders easily identify historical VWAP levels and analyze price action relative to these levels, particularly useful for identifying key support and resistance levels providing insights into potential future price behavior.
Supports VWAP closes for multiple timeframes, including historical periods (e.g., 3 months back, 3 quarters back, 3 years back). The labels provide context and detailed information about the VWAP close at a specific point in time and enhance the clarity and usefulness of the VWAP data presented on the chart.
Users can toggle the display of VWAP lines for different periods and customize the colors for each timeframe (e.g., distinct colors for monthly, quarterly, and yearly closes).
🔶 SETTINGS
The script offers a range of customizable settings to tailor the analysis to your trading needs.
🔹 Volume Weighted Average Price (VWAP)
VWAP Close Level: Toggle the display of VWAP levels at the end of each period (daily, weekly, monthly, quarterly, yearly).
VWAP Origin: Toggle the display of the VWAP line for each period.
VWAP Source: Choose the data source for VWAP calculations (default is HLC3).
Historical Closes: Define the number of historical VWAP levels to plot.
Line/Label Offset: Adjust the offset for positioning lines and labels on the chart.
🔹 Themes
Theme Selection: Choose between "Day," "Night," or "Custom" themes to adjust the color scheme of VWAP lines and labels.
Gösterge

Support Resistance UltimateThe "Support Resistance ULTIMATE" indicator is a comprehensive tool for traders on the TradingView platform, designed to identify key support and resistance levels using two primary techniques: pivot points and volume data. This indicator provides flexibility and customization, allowing traders to adapt it to their specific trading strategies.
KEY FEATURES
Pivot-Based Levels:
This feature calculates support and resistance levels using pivot points, which are derived from the high, low, and close prices of previous trading periods. Pivot points are crucial for forecasting potential market turning points.
Users can customize the pivot calculation by selecting the source type (either 'Close' or 'High/Low') and adjusting the lookback periods for both the left and right sides of the pivot calculation. This flexibility allows traders to adapt the indicator to different market conditions and timeframes.
Volume-Based Levels:
This option focuses on identifying support and resistance levels based on volume data, specifically the Point of Control (POC). The POC represents the price level with the highest traded volume during a specific time period, reflecting a consensus value among market participants.
The indicator includes a rolling POC calculation, allowing traders to dynamically assess areas of significant trading interest that may serve as support or resistance zones.
ADVANTAGES
Customization and Flexibility:
Traders can choose between pivot-based and volume-based levels or use both simultaneously, depending on their analysis needs. This dual approach provides a comprehensive view of market dynamics, accommodating various trading styles.
The indicator offers customizable color settings for support and resistance lines, enhancing chart readability and allowing traders to personalize their visual analysis.
Enhanced Market Insights:
By utilizing pivot points, traders can identify potential reversal or consolidation points, aiding in the prediction of market trends and the establishment of strategic entry and exit points.
Volume-based levels provide insights into market sentiment and participation, highlighting areas of strong support or resistance based on trading volume. This can improve risk management and trade execution by identifying high-probability trading zones.
Importance Scoring:
The indicator calculates the importance of each level based on the number of touches and the duration it holds. This scoring system helps traders assess the strength of support and resistance levels, with thicker lines indicating more significant levels.
This indicator is intended for educational and informational purposes only and should not be considered financial advice. Trading involves significant risk, and you should consult with a financial advisor before making any trading decisions. The performance of this indicator is not guaranteed, and past results do not predict future performance. Use at your own risk. Gösterge

Pressure Zones with MA [SYNC & TRADE]Description:
The "Pressure Zones with MA " indicator is designed to analyze the pressure of buyers and sellers on the market, as well as to identify areas of increased activity. When designing it, the main task was to see manipulations on the market, when the power of sellers or the power of buyers is in a sideways trend or falling, and the opposite is growing.
Here is a good example. The power of sellers is in a narrow sideways trend, and sales are increasing very aggressively. The power of buyers is in a gray block with the inscription "range". Then we see the fading of the power of sellers and buyers furiously pounce on the asset that has fallen in price.
Here are the main aspects of its operation and use:
First, turn off the moving averages in the indicator settings, on the "style" tab. Choose your favorite asset, which you understand well and know all its ups and downs. I want you to see a clean chart, so that you can be imbued with a new idea, you need to watch it. This is a proprietary indicator and I understand that it does not have the inscription “buy” / “sell”, but believe me, if you pay attention, you will see its strength. I usually add functionality later, but the light code and visualization remain preferable in the first version.
Purpose:
The indicator helps to determine the strength of buyers and sellers in the market.
It visualizes zones where the pressure of buyers or sellers prevails.
Additionally displays moving averages (MA) for data smoothing.
Main components:
Buyer strength chart (blue line)
Seller strength chart (red line)
Moving averages for buyer and seller strength
Threshold line for defining zones
Indicator settings:
Period: defines the base period for calculations (default 89)
Threshold: sets the level for defining pressure zones (from 0 to 2, default 0.8)
MA type for purchases and sales: select the type of moving average (SMA, EMA, RMA, WMA, VWMA, HMA)
MA length for purchases and sales: period for calculating moving averages
Colors for uptrends and downtrends of MA
Moving averages:
Help smooth out data and identify trends
The direction of the MA (up or down) further confirms the current trend
The color of the MA changes depending on the direction (blue for up, red for down)
Now you can turn them on and see how they help in understanding where one or another force is weakening. It is in this case that we see the intersection of forces and the sellers' force is moving aggressively upward. Also, according to the moving average, we see the weakening of the sellers' force. The buyers' force was in the sideways range and then switched on to buy out and also according to the moving average, it is clear where the main interest in purchases disappeared.
Use:
Observe the strength of buyers and sellers relative to each other. They can move simultaneously in one direction, this is regarded as balance
can move in different directions and this will strengthen the upward force of sellers or buyers
You may also notice that the movement of one of the forces will be in a narrow range and the second will grow strongly - this is manipulation or trading without resistance.
You can also play with the threshold line, but it is not the main thing here. I disabled this function in the code.
// Display zones
//bgcolor(buy_zone ? color.new(color.blue, 90) : na)
//bgcolor(sell_zone ? color.new(color.red, 90) : na)
If you want to enable it, copy it instead
// Display zones
bgcolor(buy_zone ? color.new(color.blue, 90) : na)
bgcolor(sell_zone ? color.new(color.red, 90) : na)
Pay attention to the intersection of forces.
Use crossovers of force lines and their moving averages as potential signals
Combine the indicator signals with other technical analysis tools for confirmation
Limitations:
Requires customization of parameters for a specific trading instrument and timeframe
The indicator should not be used as the only tool for making trading decisions
Remember that this indicator provides additional information for market analysis, but is not a guarantee of successful trades. Always combine it with other analysis methods and follow risk management rules.
Описание:
Индикатор "Pressure Zones with MA " предназначен для анализа давления покупателей и продавцов на рынке, а также для определения зон повышенной активности. При его проектировании основная задача была увидеть манипуляции на рынке, когда сила продавцов или сила покупателей стоит в боковике или падает, а противоположная растет.
Вот хороший пример. Сила продавцов стоит в узком боковике, а продажи очень агрессивно усиливаются. Сила покупателей в сером блоке с надписью “range”. Потом мы видим затухание силы продавцов и покупателей яростно накидываются на подешевевший актив.
Вот основные аспекты его работы и использования:
Для начала отключите средние скользящие в настройках индикатора, на закладке “стиль”. Выберите свой любимый актив, в котором вы хорошо разбираетесь и знаете его все взлеты и падения. Я хочу чтобы вы увидели чистый график, для того чтобы вы могли проникнутся новой идеей нужно понаблюдать за ним. Это авторский индикатор и я понимаю что на нем нет надписи “купить” / “продать”, но поверьте уделив свое внимание вы увидите его силу. Я обычно потом добавляю функционал но легкий код и визуализация, в первом варианте остается предпочтительней.
Назначение:
Индикатор помогает определить силу покупателей и продавцов на рынке.
Он визуализирует зоны, где преобладает давление покупателей или продавцов.
Дополнительно отображает скользящие средние (MA) для сглаживания данных.
Основные компоненты:
График силы покупателей (синяя линия)
График силы продавцов (красная линия)
Скользящие средние для силы покупателей и продавцов
Пороговая линия для определения зон
Настройки индикатора:
Период (Period): определяет базовый период для расчетов (по умолчанию 89)
Порог (Threshold): устанавливает уровень для определения зон давления (от 0 до 2, по умолчанию 0.8)
Тип MA для покупок и продаж: выбор типа скользящей средней (SMA, EMA, RMA, WMA, VWMA, HMA)
Длина MA для покупок и продаж: период для расчета скользящих средних
Цвета для восходящего и нисходящего трендов MA
Скользящие средние:
Помогают сглаживать данные и выявлять тренды
Направление MA (вверх или вниз) дополнительно подтверждает текущий тренд
Цвет MA меняется в зависимости от направления (синий для восходящего, красный для нисходящего)
Теперь вы можете их включить и посмотреть как они помогают в понимании где ослабевает та или иная сила. Именно в этом случае мы видим пересечение сил и сила продавцов идет агрессивно вверх. Также по средней скользящей мы видим затухание силы продавцов. Сила покупателей стояла в боковике потом включилась на откуп и также по средней скользящей видно где пропал основной интерес к покупкам.
Использование:
Наблюдайте за силой покупателей и продавцов относительно друг друга. Они могут двигаться одновременно в одном направлении это расценивается как баланс
могут двигаться в разных направлениях и это будет усиливать восходящую силу продавцов или покупателей
также возможно вы заметите что движение одной из силы будет в узком диапазоне а вторая будет сильно расти - это манипуляция или торговля без сопротивления.
Также можете поиграть с пороговой линией, но она совершенно не главная здесь. В коде я отключил эту функцию.
// Display zones
//bgcolor(buy_zone ? color.new(color.blue, 90) : na)
//bgcolor(sell_zone ? color.new(color.red, 90) : na)
Если захотите включить скопируйте вместо нее
// Display zones
bgcolor(buy_zone ? color.new(color.blue, 90) : na)
bgcolor(sell_zone ? color.new(color.red, 90) : na)
Обращайте внимание на пересечение сил.
Используйте пересечения линий силы и их скользящих средних как потенциальные сигналы
Комбинируйте сигналы индикатора с другими инструментами технического анализа для подтверждения
Ограничения:
Требуется настройка параметров под конкретный торговый инструмент и таймфрейм
Не следует использовать индикатор как единственный инструмент для принятия торговых решений
Помните, что этот индикатор предоставляет дополнительную информацию для анализа рынка, но не является гарантией успешных сделок. Всегда сочетайте его с другими методами анализа и соблюдайте правила управления рисками. Gösterge

Cumulative Net Money FlowDescription:
Dive into the financial depth of the markets with the "Cumulative Net Money Flow" indicator, designed to provide a comprehensive view of the monetary dynamics in trading. This tool is invaluable for traders and investors seeking to quantify the actual money entering or exiting the market over a specified period.
Features:
Value-Weighted Calculations: This indicator multiplies the trading volume by the price, offering a money flow perspective rather than just counting shares or contracts.
Custom Timeframe Adaptability: Adjust the timeframe to match your trading strategy, whether you are day trading, swing trading, or looking for longer-term trends.
Cumulative Insight: Tracks and accumulates net money flow to highlight overall market sentiment, making it easier to spot trends in capital movement.
Color-Coded Visualization: Displays positive money flow in green and negative money flow in red, providing clear, visual cues about market conditions.
Utility: "Cumulative Net Money Flow" is particularly effective in revealing the strength behind market movements. By understanding whether the money flow is predominantly buying or selling, traders can better align their strategies with market sentiment. This indicator is suited for various asset classes, including stocks, cryptocurrencies, and forex. Gösterge

Cumulative Delta [TradingFinder] Volume + Periodic + EMA🔵 Introduction
To fully grasp the concept of Cumulative Volume Delta (CVD), it's essential first to understand Volume Delta. In trading and technical analysis, the term "Delta" typically refers to the difference between two values or the rate of change between two data points.
Volume Delta represents the difference between buying and selling pressure, calculated for each candlestick on a chart. This difference can vary across different timeframes.
A positive delta indicates that buying volume exceeds selling volume, while a negative delta shows that selling volume is greater. When buying and selling volumes are equal, the volume delta equals zero.
🟣 What is Cumulative Volume Delta (CVD)?
Cumulative Volume Delta (CVD) is a powerful tool in technical analysis that aggregates delta values for each candlestick, creating a comprehensive indicator that helps traders assess market trends.
Unlike the standard Volume Delta, which compares delta on a candle-by-candle basis, CVD provides insight into the overall buying and selling pressure during key market swings. A downward-trending CVD suggests that selling pressure is dominating, which is typically a bearish signal.
Conversely, an upward-trending CVD indicates bullish sentiment. This analysis becomes even more significant when comparing CVD with price action and market structure, helping traders to predict asset price directions.
By evaluating market highs and lows, one can determine the market trend. A consistent rise in these points indicates an uptrend, while a consistent fall suggests a downtrend.
🔵 How to Use
Understanding how to detect trend changes using Cumulative Volume Delta is crucial for traders. Typically, CVD aligns with market structure, moving in the same direction as price trends.
However, divergences between CVD and price trends or signs of exhaustion in volume can be powerful indicators of potential market reversals. Recognizing these patterns can help traders make informed decisions and improve their trading strategies.
🟣 Identifying Trend Exhaustion with Cumulative Volume Delta (CVD)
The Cumulative Volume Delta (CVD) indicator is especially effective in identifying weakening trends in the market. For instance, if gold's price hits a new low, but CVD does not follow suit, this may indicate a lack of seller interest despite the new low, signaling potential seller exhaustion.
Most traders interpret this as a possible reversal from a bearish to a bullish trend. Similarly, if gold reaches a new high but CVD fails to do the same, it can suggest that buyers lack the strength to push the market higher, indicating a possible trend reversal.
🟣 Utilizing Cumulative Volume Delta (CVD) Divergence in Price Trend Analysis
Another effective use of CVD is identifying divergences in price trends. For example, if CVD breaks a previous high or low while the price remains stable, this divergence often indicates that buying or selling pressure is being absorbed.
For instance, if CVD rises sharply without a corresponding increase in gold prices, it may suggest that sellers are absorbing the buying pressure, potentially leading to a strong sell-off. Conversely, if gold prices remain stable while CVD declines, it could indicate that buyers are absorbing selling pressure, likely leading to a price increase once selling subsides.
🔵 Setting
Cumulative Mode : It has three modes "Total", "Periodic" and "EMA". In "Total" mode, it collects the volume from the beginning to the end. In "Periodic" mode, it accumulates the volume periodically and in "EMA" mode, it calculates the moving average of the volume.
Period : You can set the period of " Periodic " and " EMA " modes.
Market Ultra Data : If you turn on this feature, 26 large brokers will be included in the calculation of the trading volume.
The advantage of this capability is to have more reliable volume data. You should be careful to specify the market you are in, FOREX brokers and Crypto brokers are different.
🔵 Conclusion
Cumulative Volume Delta (CVD) is a powerful analytical tool in financial markets that helps analysts and traders assess buying and selling pressure by aggregating and combining the volume delta for each candlestick.
CVD can indicate the strength or weakness of a market trend. When CVD moves upward, it signals that buying pressure is dominant and is considered a bullish signal; conversely, a downward movement in CVD indicates that selling pressure is stronger and is viewed as a bearish signal.
This indicator is particularly effective in identifying divergences and exhaustion in market trends. For example, if CVD does not align with price movements, it may suggest a potential trend reversal.
Traders use this information to make more informed trading decisions, especially when identifying entry and exit points in the market.
Overall, CVD is a tool that enables analysts to better understand market fluctuations and more accurately predict future market trends.
Gösterge

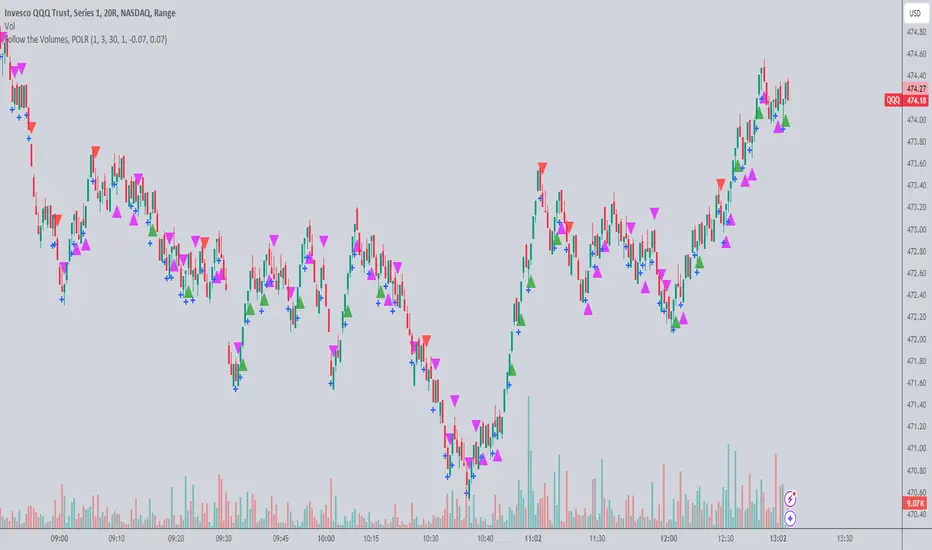
Follow the Volumes / Path of Least ResistanceThis indicator tracks price movements following significant volume increases. It identifies volume spikes by comparing recent average volume to a longer-term average. After a spike, it monitors price changes over a specified number of bars.
In plain English, the point of this is to “let the market show it’s hand”, vs. other common and preemptive methods of execution.
You can think of it as a better version of a volume up/down indicator which only uses opening and closing prices to identify "bullish" or "bearish" behavior.
To optimize this, I used a very small range chart, hence the small values. You will need to experiment with other values, ESPECIALLY the % change. If you do not do this, the indicator will generate a lot of noise.
The indicator has three main conditions:
1. Significant price increase, bullish: A green triangle appears below the bar.
2. Significant price decrease, bearish: A red triangle appears above the bar.
3. Price change within thresholds: A fuschia triangle appears, pointing up or down based on the overall (short-term) trend. This is common behavior during trends. A spike in volume will appear, and price simply does not budge. Volume/price is essentially declaring a new found value, in which case prices tend to follow the impulse movement (see market profile theory).
The color scheme is intuitive: green for positive moves, red for negative, and fuschia for subtle changes following the existing trend. Blue circles mark volume spikes for reference, which I recommend using only for reference, and disabling to remove unneeded noise.
Because this indicator "lags" in the sense of waiting for the market to show its hand, best opportunities are typically found on retests of the volume spikes themselves. On drives, however, the market will unlikely pullback, which (in my view) is one of its best use cases.
Bottom line, you will need to adjust the parameters to the instrument. This is not a plug and play solution, but far more accurate than those which are.
Settings, and what they mean:
Volume spike average bars: length for identification of high volumes. On smaller timeframes, such as my optimization period, you’ll want several bars. But on something such as a 5 minute or higher, only 1.
Lookback period: for identification of high volumes.
Volume Increase Threshold (%): % which constitutes a jump in volume
Bars After Spike: How long to wait for ensuing price movement. Also sensitive to the timeframe you are using. 1-2 recommended for 5m+, more for smaller range-based.
Negative Price Change Threshold (%): For red arrows (Volume + Price Movement)
Positive Price Change Threshold (%): Inverse of above
WMA Period for Stability Function: When price spikes on high volumes but does not move (price is “trapped” between negative and positive price change thresholds) the indicator marks direction (in fuchsia) in the direction of the underlying trend. This short-term MA identifies that trend.
Finally, because this indicator is volume-based, I recommend using primary instruments only and discourage its use on CFDs or other firm-generated instruments. Just use the primary. I would ignore signals off the open, which is subject to erroneous behavior. Other methods are far more effective for that.
This script is purposely uncomplicated. Feel free to play with settings and change code to suit your needs. Gösterge

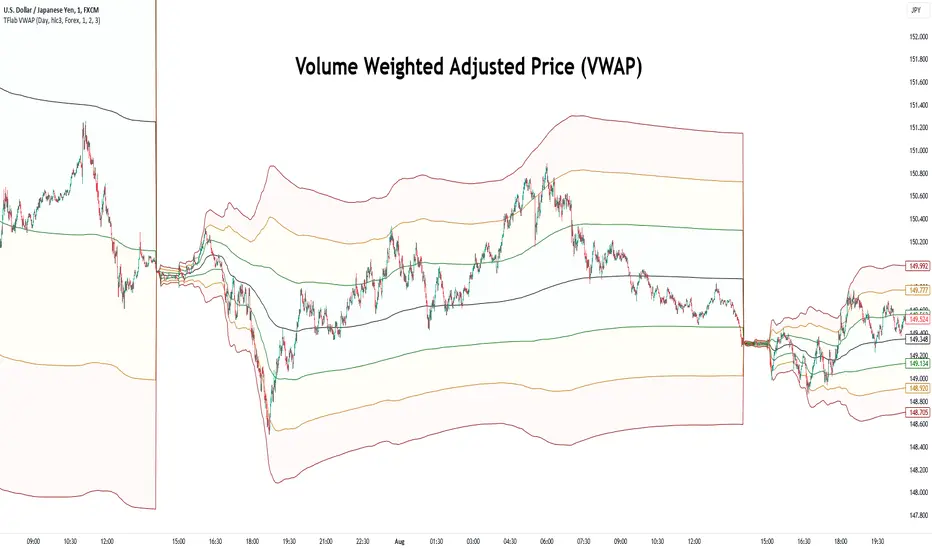
VWAP Bands [TradingFinder] 26 Brokers Data (Forex + Crypto)🔵 Introduction
Indicators are tools that help analysts predict the price trend of a stock through mathematical calculations on price or trading volume. It is evident that trading volume significantly impacts the price trend of a stock symbol.
The Volume-Weighted Average Price (VWAP) indicator combines the influence of trading volume and price, providing technical analysts with a practical tool.
This technical indicator determines the volume-weighted average price of a symbol over a specified time period. Consequently, this indicator can be used to identify trends and entry or exit points.
🟣 Calculating the VWAP Indicator
Adding the VWAP indicator to a chart will automatically perform all calculations for you. However, if you wish to understand how this indicator is calculated, the following explains the steps involved.
Consider a 5-minute chart. In the first candle of this chart (which represents price information in the first 5 minutes), sum the high, low, and close prices, and divide by 3. Multiply the resulting number by the volume for the period and call it a variable (e.g., X).
Then, divide the resulting output by the total volume for that period to calculate your VWAP. To maintain the VWAP sequence throughout the trading day, it is necessary to add the X values obtained from each period to the previous period and divide by the total volume up to that time. It is worth noting that the calculation method is the same for intervals shorter than a day.
The mathematical formula for this VWAP indicator : VWAP = ∑ (Pi×Vi) / ∑ Vi
🔵 How to Use
Traders might consider the VWAP indicator as a tool for predicting trends. For example, they might buy a stock when the price is above the VWAP level and sell it when the price is below the VWAP.
In other words, when the price is above the VWAP, the price is rising, and when it is below the VWAP, the price is falling. Major traders and investment funds also use the VWAP ratio to help enter or exit stocks with the least possible market impact.
It is important to note that one should not rely solely on the VWAP indicator when analyzing symbols. This is because if prices rise quickly, the VWAP indicator may not adequately describe the conditions. This indicator is generally used for daily or shorter time frames because using longer intervals can distort the average.
Since this indicator uses past data in its calculations, it can be considered a lagging indicator. As a result, the more data there is, the greater the delay.
🟣 Difference Between VWAP and Simple Moving Average
On a chart, the VWAP and the simple moving average may look similar, but these two indicators have different calculations. The VWAP calculates the total price considering volume, while the simple moving average does not consider volume.
In simpler terms, the VWAP indicator measures each day's price change relative to the trading volume that occurred that day. In contrast, the simple moving average implicitly assumes that all trading days have the same volume.
🟣 Reasons Why Traders Like the VWAP Indicator
The VWAP Considers Volume: Since VWAP takes volume into account, it can be more reliable than a simple arithmetic average of prices. Theoretically, one person can buy 200,000 shares of a symbol in one transaction at a single price.
However, during the same time frame, 100 other people might place 200 different orders at various prices that do not total 100,000 shares. In this case, if you only consider the average price, you might be mistaken because trading volume is ignored.
The Indicator Can Help Day Traders: While reviewing your trades, you might notice that the shares you bought at market price are trading below the VWAP indicator.
In this case, there's no need to worry because with the help of VWAP, you always get a price below the average. By knowing the volume-weighted average price of a stock, you can easily make an informed decision about paying more or less than other traders for the stock.
VWAP Can Signal Market Trend Changes: Buying low and selling high can be an excellent strategy for individuals. However, you are looking to buy when prices start to rise and sell your shares when prices start to fall.
Since the VWAP indicator simulates a balanced price in the market, when the price crosses above the VWAP line, one can assume that traders are willing to pay more to acquire shares, and as a result, the market will grow. Conversely, when the price crosses below the line, this can be considered a sign of a downward movement.
🔵 Setting
Period : Indicator calculation time frame.
Source : The Price used for calculations.
Market Ultra Data : If you turn on this feature, 26 large brokers will be included in the calculation of the trading volume.
The advantage of this capability is to have more reliable volume data. You should be careful to specify the market you are in, FOREX brokers and Crypto brokers are different.
Multiplier : Coefficient of band lines.
Gösterge

Gösterge

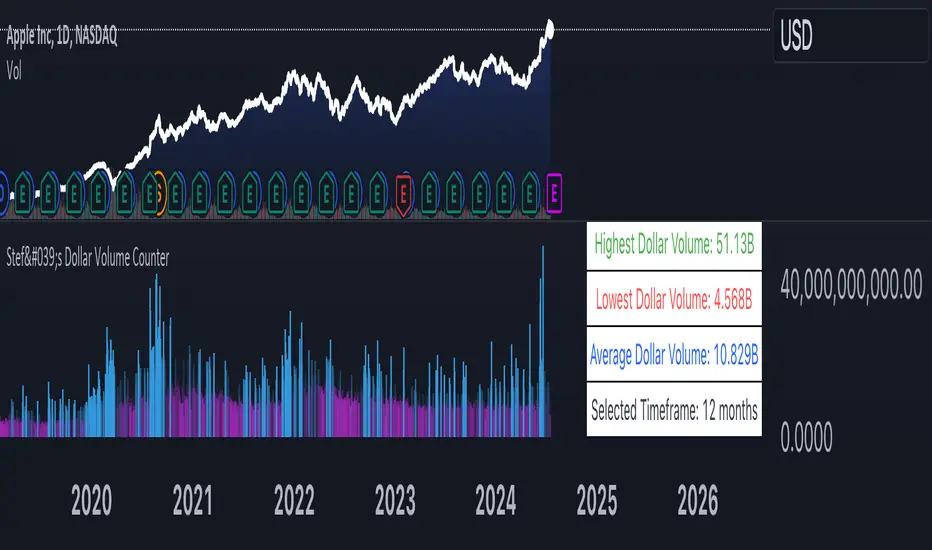
Stef's Dollar Volume CounterStef's Dollar Volume Counter is my second script that I've worked on and coded. I am proud of this script because it does something very, very important: it counts the AMOUNT of money traded, not just the amount shares/contracts traded. This is key for understanding where the big and small money is.
This script is totally different from other Volume scripts because it shows the amount of money traded, NOT the shares/contracts/coins etc. Also, more importantly, it is different from other volume indicators in the same space because this script is specifically focused on showcasing specific dollar volume amounts either as a table or as a label.
Here are the 5 key features you can utilize with this:
1. Customizable Gradient Colors for BIG money and SMALL money: Visually distinguishes between high and low dollar volumes. Change the colors as needed in the indicator settings menu.
2. Dollar Volume Counter Table: Positioned at the bottom right of the chart, this table provides quick insights into the highest, lowest, and average dollar volumes over a specified period. You can customize the time period in the settings menu.
3. "Wow! Much Money!" Labels: Highlights the top three recent highest dollar volumes within the visible chart area, emphasizing significant trading periods. Also, it's hilarious :)
4. Customize the period for volume analysis, ranging from 1 to 12 months or more, with the selected timeframe displayed in the table.
5. It opens as a new pane below the chart so that you can still analyze price and more, as needed.
Thanks for reading! I look forward to hearing your feedback. This script will be updated to expand on more concepts and I'll add some cool features soon. Gösterge

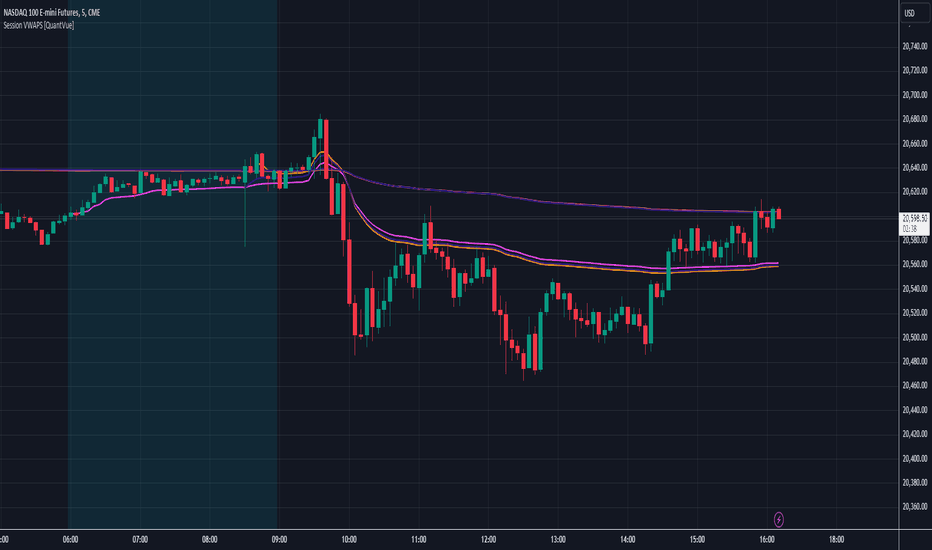
Session VWAPS [QuantVue]The Session VWAPS indicator is a designed for traders to enhance their trading analysis by incorporating Volume Weighted Average Price (VWAP) anchored to custom-defined trading sessions.
This indicator automatically plots VWAPs at three critical points of a user defined session:
🔹session start
🔹session high
🔹session low
Additionally, it provides the option to display the VWAPs from previous sessions, offering a look at potential areas of support and resistance.
Anchored VWAP, or Anchored Volume-Weighted Average Price, is a technical analysis tool used to determine the average price of a stock weighted by volume, starting from a specific point in time chosen by the analyst.
Unlike traditional VWAP, which starts at the beginning of the trading session, the anchored VWAP allows traders to select any point on the chart, such as a significant event, price low, high, or a breakout, to begin the calculation.
VWAP incorporates price and volume in a weighted average and can be used to identify areas of support and resistance on the chart.
Indicator Features:
Custom Session Definition:
Users can define their own trading sessions by specifying start and end times, allowing for tailored analysis according to individual trading strategies or market hours.
Anchored VWAP at Three Key Points:
🔹Session Start VWAP: This VWAP is anchored at the start of the defined session.
🔹Session High VWAP: Anchored at the highest price point within the session.
🔹Session Low VWAP: Anchored at the lowest price point within the session.
Previous Session VWAPs:
The indicator can display VWAPs from the previous session, allowing traders to spot potential areas of support and resistance.
Give this indicator a BOOST and COMMENT your thoughts below!
We hope you enjoy.
Cheers! Gösterge
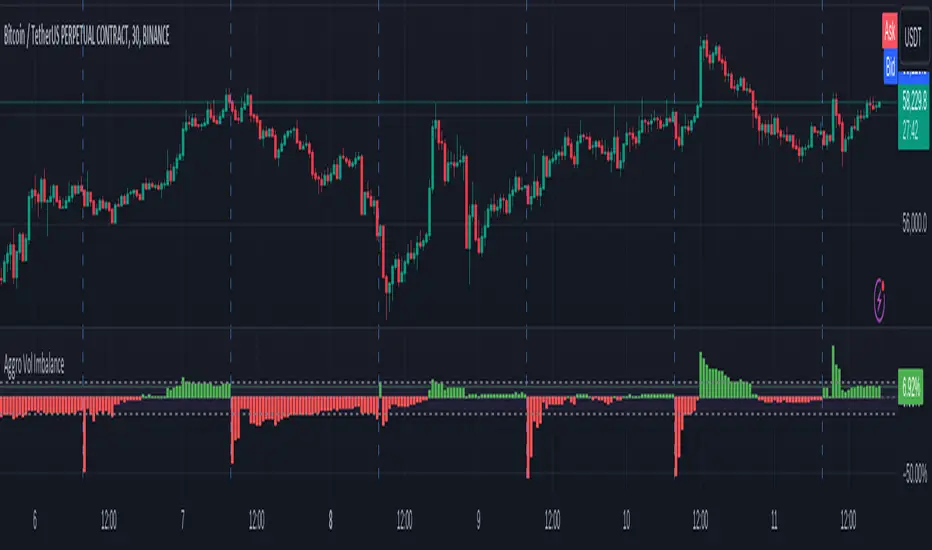
Aggressor Volume ImbalanceAggressor volume imbalance represents the ratio between market aggressor buy volume (market buy orders) and market aggressor sell volume (market sell orders). This ratio enables traders to evaluate the interest of market aggressors and whether aggressive market activity favours the price's direction.
Analysing aggressor volume is critical in understanding market sentiment and aids in identifying shifts in momentum and potential exhaustion points in the market. When the aggressor buy volume significantly exceeds the sell volume, it typically indicates strong buying interest, driving prices higher if the offer-side liquidity cannot contain it, and vice versa.
How it Works
The imbalance ratio is calculated as follows, according to the selected session timeframe (see settings):
imbalance := ((buyVolumeAccumulator - sellVolumeAccumulator)
/ (buyVolumeAccumulator + sellVolumeAccumulator)) * 100
Aggressive Volume Imbalance uses lower timeframe historical data to calculate Historical Aggressor Volume Imbalances, while live data is used for live aggressor volume imbalances.
How to Use It
You can set the indicator to use any historical data timeframe you prefer. However, it is highly recommended to use lower timeframes (e.g., 1 second), as the lower the timeframe, the more granular the data.
The indicator resets to 0% whenever a new session timeframe begins (e.g., a new day) and calculates new values for the rest of the session. This can be configured in the settings. Gösterge

Significant Volume with Price Changes HighlightedSignificant Volume with Price Changes Highlighted
The "Significant Volume with Price Changes Highlighted" indicator by PappyTrading is a powerful tool designed to help traders identify significant volume spikes and price changes in the market. This indicator overlays the volume bars on the price chart and highlights them based on specific volume and price change conditions, providing a clear visual representation of market activity.
What It Does
This indicator calculates the moving average of the volume over a specified period and compares the current volume to this average. It also calculates the daily percentage change relative to the previous day's close and compares this to its moving average. The volume bars are then color-coded based on the following conditions:
Bright Green (#089981): Indicates a significant volume spike with an above-average price increase.
Bright Red (#f23645): Indicates a significant volume spike with an above-average price decrease.
Green with 60% transparency: Indicates a normal up day with a price increase but not a significant volume spike.
Red with 60% transparency: Indicates a normal down day with a price decrease but not a significant volume spike.
Additionally, the indicator plots a 20-period simple moving average (SMA) of the volume, providing a reference point to understand the general volume trend.
How It Works
Volume Calculation:
The indicator calculates the 20-period SMA of the volume and compares the current volume to this average to determine if there is a significant volume spike.
Price Change Calculation:
The indicator calculates the daily percentage change in price relative to the previous day's close and compares this to the 20-period SMA of the percentage change to identify significant price movements.
Color Coding:
The volume bars are color-coded based on the combination of the volume and price change conditions. This visual representation allows traders to quickly identify significant market activities.
How to Use It
Overlay on Chart:
Add the "Significant Volume with Price Changes Highlighted" indicator to your chart. The volume bars will be displayed at the bottom of the chart, color-coded based on the conditions described above.
Identify Market Activity:
Use the color-coded volume bars to identify significant market activities. Bright green bars indicate strong buying pressure, while bright red bars indicate strong selling pressure. Transparent green and red bars indicate normal market activity without significant volume spikes.
Volume Moving Average:
The blue line represents the 20-period SMA of the volume. Use this as a reference to understand the general volume trend and identify deviations from the average.
Concepts Underlying the Calculations
Volume Spikes: Significant volume spikes often precede or accompany major market moves. By highlighting these spikes, traders can gain insights into potential market turning points or continuation patterns.
Price Changes: Large price changes relative to the previous day's close indicate strong market momentum. By comparing these changes to their moving average, the indicator helps traders identify unusually strong buying or selling pressure.
This indicator is ideal for traders who want to gain a deeper understanding of market dynamics by analyzing volume and price changes together. It is suitable for various trading styles, including trend following, swing trading, and scalping. Gösterge

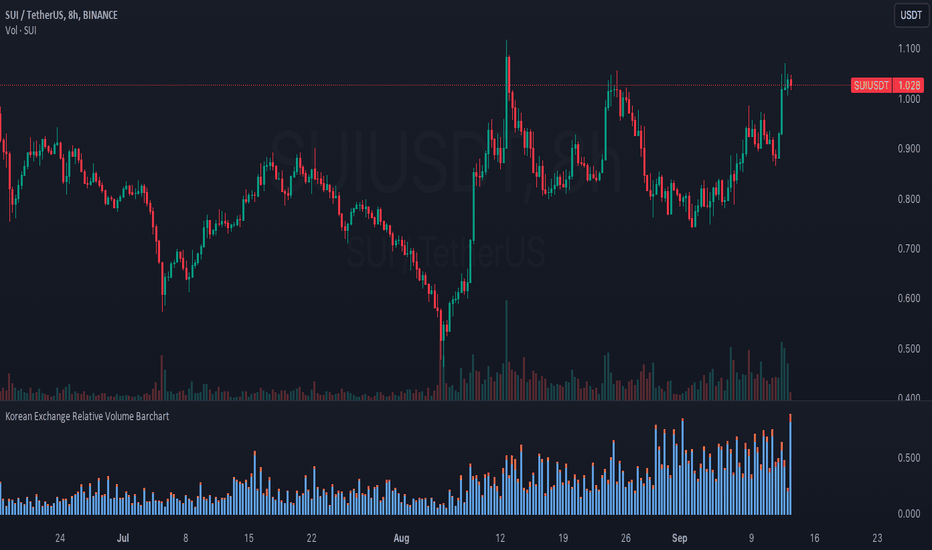
Multi Exchange Relative Volume IndicatorThe Multi Exchange Relative Volume indicator is a powerful tool designed to visualize the relative volume across different exchanges. This is particularly useful for decentralized securities like forex and crypto, where volume data is spread across multiple markets. By aggregating volume data from various exchanges, this indicator helps traders identify trends, spot unusual volume spikes, and make informed trading decisions.
Key Features:
Multi-Exchange Volume Aggregation: Collects and sums the volume data from up to five different exchanges, offering a holistic view of the market activity.
Customizable Inputs: Easily select and configure up to five different exchanges of your choice to monitor their volume activity.
Relative Volume Visualization: Compares the aggregated volume against historical averages to highlight periods of high or low volume.
Color-Coded Volume Bars: Volume bars are color-coded based on the relative volume percentage, providing quick visual cues:
- Red for volume 1.0-1.5 times the average
- Orange for volume 1.5-2.0 times the average
- Green for volume 2.0-3.0 times the average
- Yellow for volume greater than 3.0 times the average
- Grey for below average volume
Dynamic Lookback Period: Adjust the lookback period to suit your trading style and timeframe, allowing for flexible analysis.
Exponential Moving Average (EMA): Includes an EMA of volume to smooth out short-term fluctuations and highlight longer-term trends.
Scalable Layout: The scaling factor allows you to zoom in or out, adjusting the visual representation of volume data to better fit your chart.
Usage:
Configure Exchanges: Select up to five exchanges you want to monitor from the input settings.
Set Lookback Period and Bars: Customize the lookback period and the number of bars to consider for calculating average volume.
Adjust Scaling: Use the scaling factor to zoom in or out on the volume data for better visualization.
Interpret Volume Bars: Analyze the color-coded volume bars to identify significant changes in volume and potential trading opportunities.
Monitor EMA: Use the EMA line to understand the trend and smooth out noise from the volume data.
The Multi Exchange Relative Volume indicator is an essential tool for traders who want to gain deeper insights into market activity across multiple exchanges. By visualizing relative volume, it helps in identifying potential breakout or breakdown points, enhancing your trading strategy. Gösterge

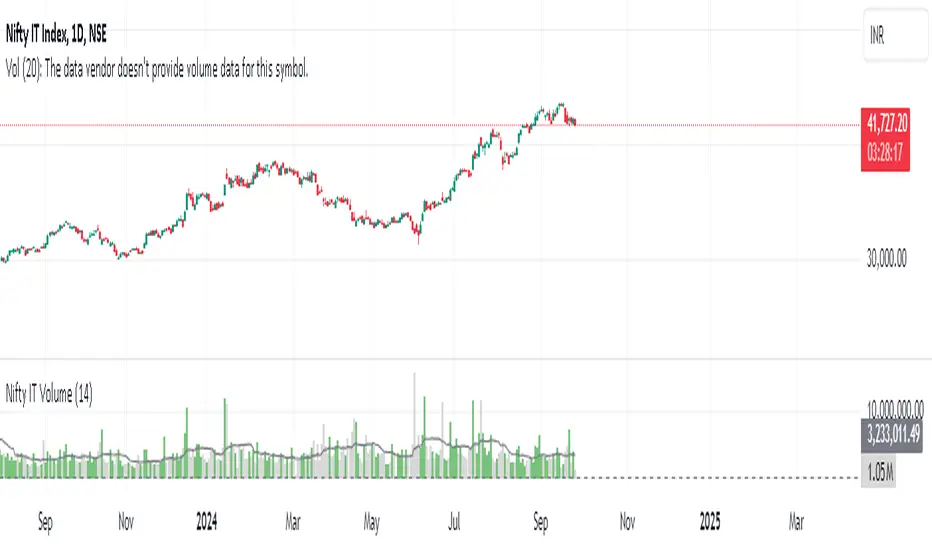
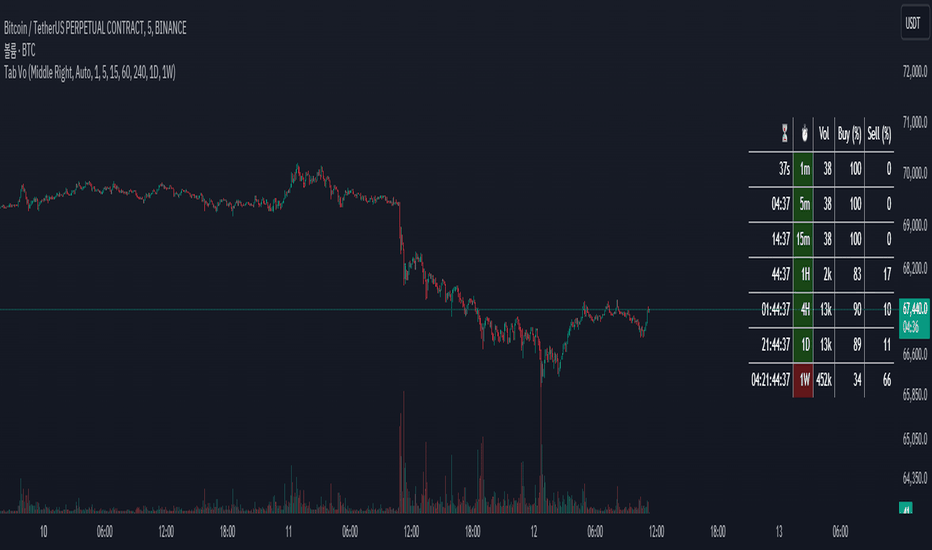
Current and Average Volume Table [CHE]Introduction:
The "Current and Average Volume Table " script is designed as a custom indicator for trading platforms that support Pine Script (specifically Pine Script version 5). This indicator provides a compact and informative table summarizing key volume-related metrics for financial instruments, enhancing traders' ability to analyze buying and selling dynamics over a specified period.
Description:
The script calculates and displays essential volume metrics in a customizable table format. It includes options for positioning the table on the chart (e.g., top-right, bottom-left) and adjusting its visual size (auto, huge, large, normal, small, tiny) to fit user preferences and chart layout.
Analysis:
The indicator computes several critical metrics:
Current Volume Metrics:
Current Volume: Displays the total volume traded in the current bar.
Buy Percentage (%): Indicates the proportion of the total volume attributed to buying activities.
Sell Percentage (%): Shows the percentage of the total volume attributed to selling activities.
Average Volume Metrics:
Average Volume: Calculates the simple moving average (SMA) of the volume over a specified number of bars. This provides a smoothed average volume figure, helping traders identify trends or anomalies in trading activity.
Average Buy Percentage (%): Computes the average percentage of buying volume over the SMA period.
Average Sell Percentage (%): Calculates the complementary percentage of selling volume over the SMA period.
The script uses conditional formatting to highlight cells based on comparative values of buy versus sell percentages and their averages. Green shades indicate higher buying activity, while red shades signify higher selling activity, providing a quick visual cue to traders.
Resume:
The "Current and Average Volume Table " script offers traders a concise and insightful tool to monitor and analyze volume dynamics. By displaying current and average volume metrics alongside buy and sell percentages, traders can quickly gauge market sentiment and potential trends. The customizable table placement and size options enhance usability, adapting to individual trading styles and chart preferences.
This script is ideal for traders seeking to incorporate volume analysis into their technical analysis toolkit, providing both real-time insights and historical trend comparisons to inform trading decisions effectively.
This description outlines the functionality, benefits, and practical applications of the script, catering to traders interested in volume-based analysis within the cryptocurrency and traditional financial markets. Gösterge

Gösterge
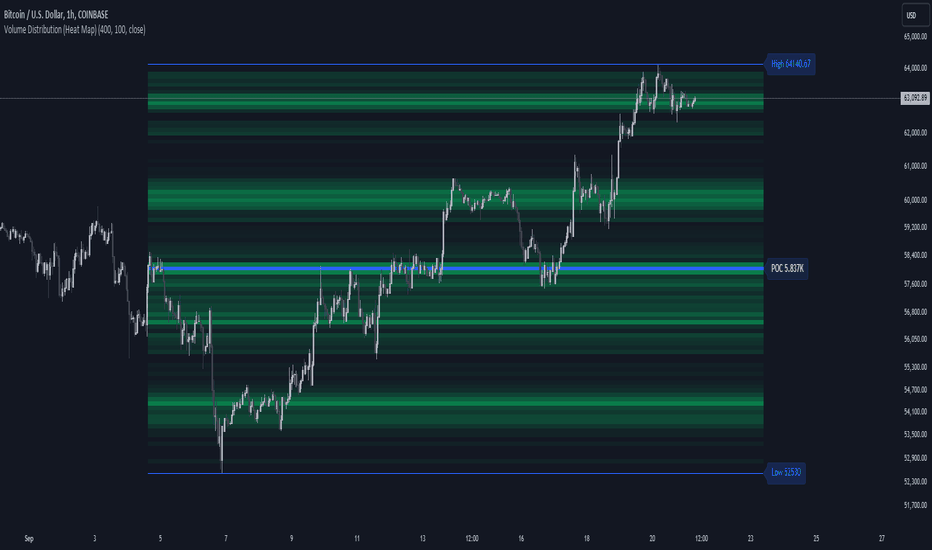
Volume Distribution (Heat Map)This Pine Script indicator, "Volume Distribution (Heat Map)" is designed to visualize the distribution of volume across different price levels over a specified lookback period. Here's a detailed breakdown of its functionality and features:
Indicator Overview
User Inputs
Length: The lookback period for analysis, defaulting to 500 bars.
Source: The price source used for calculations (default is the close price).
Color Intensity: Adjusts the intensity of the heatmap colors, with a default value of 25.
Lines Width: The width of the plotted lines, with a default value of 10.
Main Color: The main color used for the heatmap (default is lime).
Logic
The script iterates through the number of bins, calculates the volume for each bin between highest and lowest prices for length period, and updates the corresponding bin in the freq array if the current bar is allowed.
If the current bar is the last bar, the script plots lines and labels based on the volume distribution.
Heatmap Lines:
Solid lines colored based on the volume in each bin, using a gradient from no color to the main color based on amount of volume.
Highest Volume Line:
A dashed red line indicating the bin with the highest volume.
Labels:
Labels for the highest and lowest prices and the volume at the highest volume bin.
Plots
Highest Price Plot: Plots the highest price within the lookback period if the current bar is within the allowed range.
Lowest Price Plot: Plots the lowest price within the lookback period if the current bar is within the allowed range.
Summary
This indicator provides a visual representation of where trading volume is concentrated across different price levels, forming a heatmap. The highest volume level is highlighted with a dashed red line and a label indicating the volume at that level. This can help traders identify significant price levels where trading activity is clustered.
The "Volume Distribution (Heat Map)" indicator is a valuable tool for traders looking to enhance their technical analysis by incorporating volume data into their price charts. It provides a clear and visual representation of where market participants are most active, aiding in better-informed trading decisions. Gösterge
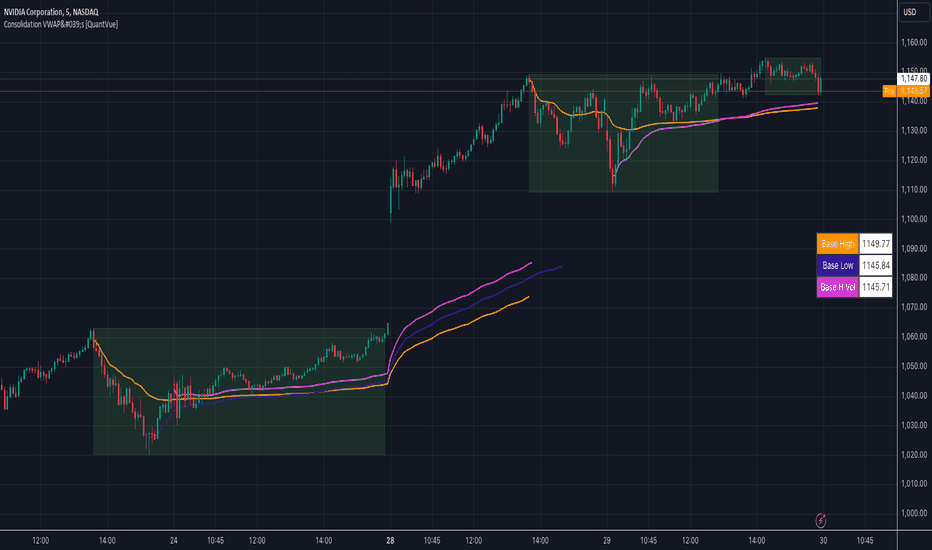
Consolidation VWAP's [QuantVue]Introducing the Consolidation VWAP's Indicator , a powerful tool designed to identify consolidation periods in stock advance and automatically anchor three distinct VWAPs to key points within the consolidation.
Consolidation Period Identification:
The indicator automatically detects periods of consolidation or areas on the chart where a stock's price moves sideways within a defined range. This period can be seen as the market taking a "breather" as it digests the previous gains. Consolidations are important because they often act as a base for the next move, either continuing the previous uptrend or reversing direction.
Consolidation requirements can be customized by the user to match your instrument and timeframe.
Maximum Consolidation Depth
Minimum Consolidation Length
Maximum Consolidation Length
Prior Uptrend Amount
Anchored VWAP, or Anchored Volume-Weighted Average Price, is a technical analysis tool used to determine the average price of a stock weighted by volume, starting from a specific point in time chosen by the analyst.
Unlike traditional VWAP, which starts at the beginning of the trading session, the anchored VWAP allows traders to select any point on the chart, such as a significant event, price low, high, or a breakout, to begin the calculation.
VWAP incorporates price and volume in a weighted average and can be used to identify areas of support and resistance on the chart.
VWAP Anchored to Consolidation High: This VWAP is anchored at the highest price point within the identified consolidation period. It helps traders understand the
average price paid by buyers who entered at the peak of the consolidation.
VWAP Anchored to Consolidation Low: This VWAP is anchored at the lowest price point within the consolidation. It provides insights into the average price paid by
buyers who entered at the lowest point of the consolidation.
VWAP Anchored to Highest Volume in the Consolidation: This VWAP is anchored at the price level with the highest trading volume during the consolidation. It reflects the average price at
which the most trading activity occurred, often indicating a key support or resistance level.
The indicator also allows the trader to see past consolidation areas and previous anchored VWAP's.
Give this indicator a BOOST and COMMENT your thoughts!
We hope you enjoy.
Cheers! Gösterge
OrderFlow Absorption IndicatorWhat it Does
The OrderFlow Absorption Indicator marks areas where the price absorbs a large volume of aggressive market trades. This indicates areas where price may bounce back due to large limit (resting) orders absorbing significant aggressor volume (market orders). Absorption can also be seen as "preventing" or "stopping" the other side from breaking through a price level (e.g. bids stopping an influx of sell market orders). Absorption may signal a change in sentiment, potentially leading to a pullback or reversal.
An Example of Absorption
Of course, it is not always the case that such bullish absorption will initiate a trend as the example above. The OrderFlow Absorption Indicator merely serves as a tool for spotting possible absorption points in the market which you can incorporate into your trading arsenal.
How it Works
The indicator actively monitors price changes and records volume accumulated at a price level. If the price bounces back to at least where it was before the current price move, the indicator records this as absorption, provided it meets the Volume Requirement and optional Time Requirement.
How to Use it
1. Set Parameters
Choose your desired tick size and volume filter value. If unsure, refer to the table on the top right of the chart for recommended values. An automatic volume limit filter mode is also available.
Automatic Limit Mode : Enable this mode to have the indicator automatically select a volume filter value. It calculates the standard deviation of the last n minutes of volume and multiplies it by a volume multiplier. You can adjust these parameters.
Higher Volume Filter : Setting a higher volume filter value results in fewer, but higher quality detections, reducing noise.
2. Enabling the Time Limit
Enabling the time limit further improves detection quality by filtering out price levels that can defend against quick, sudden aggressive orders, acting as confirmation and indicating strong sentiment and resilient liquidity.
3. Enabling Historical Data Absorption
The indicator can also detect absorption in historical data, though less accurately than in real-time due to OHLCV aggregation.
You can select the granularity of historical data.
Lower granularity (e.g., 1 second) : Provides more accurate detections but may slow down the indicator.
Higher granularity : Improves speed but reduces detection accuracy.
Other Features
Hovering : When hovering over an absorption point, the interface reveals the price where the absorption occurred, along with the volume absorbed by the bids and asks, as well as the volume filter value used.
Delta Mode : In Delta mode, the system calculates the difference between the volume absorbed by bids and asks, revealing points only when the absolute value of this difference exceeds the volume filter value. Especially useful for larger tick sizes.
Troubleshooting
If the indicator doesn't mark anything, it means the traded volume hasn't exceeded the set volume filter value within the specified price intervals(tick size) and time limit. Adjust these settings as necessary. Gösterge