Momentum Pro Dashboard | MouryaOverview
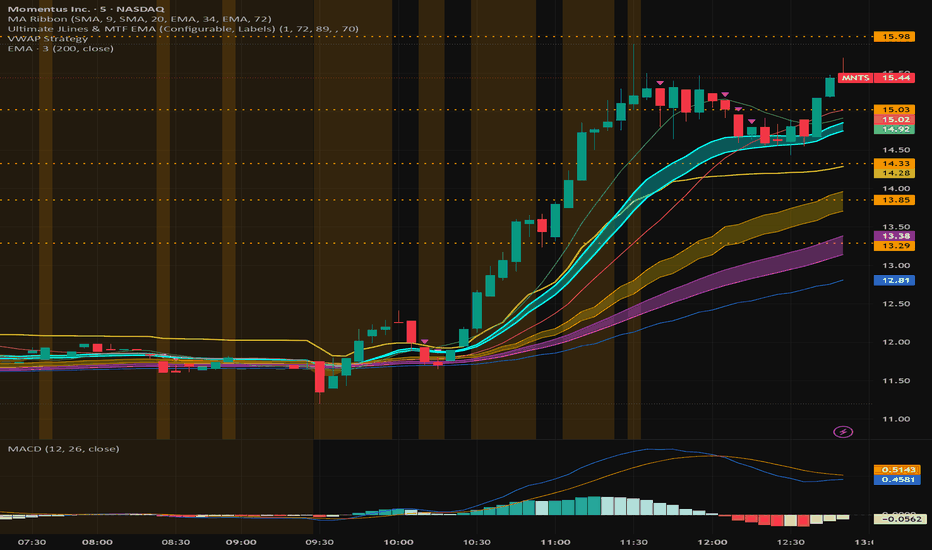
The Momentum Pro Dashboard is an institutional-grade, all-in-one Heads-Up Display (HUD) engineered specifically for active momentum and day traders. Built purely in Pine Script v6, this dashboard consolidates critical tape reading, volume analysis, and dynamic levels into a clean, mathematically balanced 3-column UI, eliminating the need to constantly switch tabs or clutter your chart with multiple indicators.
1. The Layout & Architecture
The script generates a 3-column Heads-Up Display (HUD) directly on your chart. It is completely dynamic—if you disable a feature in the settings, the table automatically shrinks to close any empty gaps.
Top Header: A spanning banner showing the Ticker, Company Name, Country, Exchange, Sector, and Industry. (It includes a manual override in the settings if TradingView tries to label the exchange as "BATS").
Column 1: Core fundamental data, session momentum percentages, and price extremes.
Column 2: Dynamic support/resistance levels (EMAs, VWAP Bands, and Pivots).
Column 3: A real-time, ticking Tape (Time & Sales) for live order flow.
2. Column 1: Core Metrics & Extremes
This column tracks the fundamental setup and the active momentum of the asset.
Current Price: The live price of the asset. The text turns Green if the day is positive, and Red if the day is negative.
Float & Mkt Cap: Formatted cleanly in Millions (M) or Billions (B).
Float Color Code: < 1M (Bright Green), 1M–5M (Standard Green), 5M–10M (Dark Green), 10M–20M (Yellow), > 20M (Red).
Daily % (Close-to-Close): Performance based strictly on yesterday's official Regular Trading Hours (RTH) close.
Intraday %: Performance based strictly on today's open.
GAP %: The difference between yesterday's close and today's open.
Daily Volume & Turnover: Total shares traded today, and the dollar amount of that volume (Volume * Price).
Rel. Vol. (Relative Volume): Compares today's volume pace to the 10-day average.
Color Code: < 1x (Red), 1x to 5x (Yellow), > 5x (Green).
Short %: Calculates true Short Interest by dividing FINRA's reported EOD Short Volume by yesterday's total trading volume.
Color Code: < 5% (Dark Green), 5–20% (Light Green), 20–50% (Yellow), 50–100% (Light Red), > 100% (Dark Red).
Buy/Sell %: A proxy for Bid/Ask hitting, showing the percentage of volume executed on upticks vs. downticks.
Per Lot: Shows the point value multiplier of the asset (crucial for Futures).
Day High & Day Low (Custom Cycle): Tracks the highest and lowest prices of the current session, starting exactly at the Post-Market open and running through the RTH close.
52W High & 52W Low: Rolling 1-year extremes.
ATH & ATL (All-Time High/Low): Dynamically scans all locally loaded chart data to find the absolute extremes without crashing TradingView's servers.
3. Column 2: Institutional Averages & Levels
This column provides your key support and resistance zones. Crucially, these are anchored to standard institutional timeframes so your levels perfectly match what Wall Street algorithms are looking at, ignoring weird pre-market distortions.
EMAs (1-4): Four customizable Exponential Moving Averages (Defaults: 10, 20, 50, 200).
VWAP Engine: A custom-built Volume Weighted Average Price calculator.
VWAP Main: The core session VWAP.
Upper Bands (1, 2, 3): Standard deviation bands above VWAP.
Lower Bands (1, 2, 3): Standard deviation bands below VWAP.
Pivots (P, R1-R5, S1-S5): Mathematical support/resistance levels. You can choose the calculation type in settings (Traditional, Fibonacci, Camarilla, etc.).
(Note: Every single EMA, VWAP band, and Pivot level has its own independent On/Off checkbox in the settings so you can declutter at will).
4. Column 3: The Tape (Time & Sales)
A highly optimized, array-based real-time order tracker right on your chart.
Rows: You can set it to show anywhere from 1 to 20 of the most recent trades.
Standard Colors: Green (Buy/Ask hit), Red (Sell/Bid hit), Gray (Neutral/Absorption).
Neon Block Order Highlights: In the settings, you define a "Large Print" threshold (e.g., 2,000 shares). Any order larger than that size flashes in Neon Green (Buy) or Neon Red (Sell) so you instantly spot institutional sizing.
5. Under-the-Hood Engineering (The "Secret Sauce")
Proximity Alerts: In the settings, there is a "Proximity Alert %" (default 0.15%). If the live price gets within 0.15% of any level in Column 1 or Column 2, that level turns Yellow to warn you. If price touches it directly, it turns Red.
Crash-Proof Data Handling: If you load this script on an asset that lacks certain data (e.g., Forex has no Short Interest or Float), the script will not crash. It will elegantly bypass the calculation and output a clean "—" in the table.
Cumulative Memory: The script utilizes varip arrays. This means it can remember and process data tick-by-tick between official candle closes, allowing the Tape to update instantly in real-time. Gösterge

VWAP + RSI ConfluenceThis indicator merges VWAP and RSI into one clean visual system by coloring candles based on their agreement.
Green candles → Bullish confluence: Price is above VWAP and RSI is above the midline (default 50).
Red candles → Bearish confluence: Price is below VWAP and RSI is below the midline.
White candles (Hold) → Conflict between VWAP and RSI. The market is undecided — best to stay out and avoid choppy, low-quality setups.
The white “Hold” candles act as a powerful filter that helps you avoid trading when the two indicators disagree.
How to Use
Trade in the direction of the colored candles (green = long bias, red = short bias).
Avoid trading during white “Hold” candles.
Best used at key support/resistance levels or in combination with your existing price action or structure.
Works on all timeframes and instruments.
Important Setup Step (Required for Reliable Colors)
For the custom candle colors to display correctly even when the indicator is not selected, you must do the following once:
Add the indicator to your chart.
Right-click anywhere on the chart.
Select Object Tree.
Right-click on VWAP + RSI Confluence.
Go to Visual Order → Bring to front.
After this step, the colors will remain stable. It is recommended to save your chart as a template afterward so you don’t have to repeat this process.
Settings
VWAP Anchor: Choose between Day, Week, Month, or Year (resets the VWAP calculation accordingly).
RSI Length: Default is 21 (adjustable).
RSI Midline: Default is 50.0 (the threshold for bullish/bearish agreement).
Colors: Fully customizable colors for Bullish candles, Bearish candles, Hold candles, and their wicks.
Recommended Use
This indicator is especially useful for day trading and swing trading when you want a clear visual filter that reduces conflicting signals between momentum (RSI) and institutional average price (VWAP). Gösterge
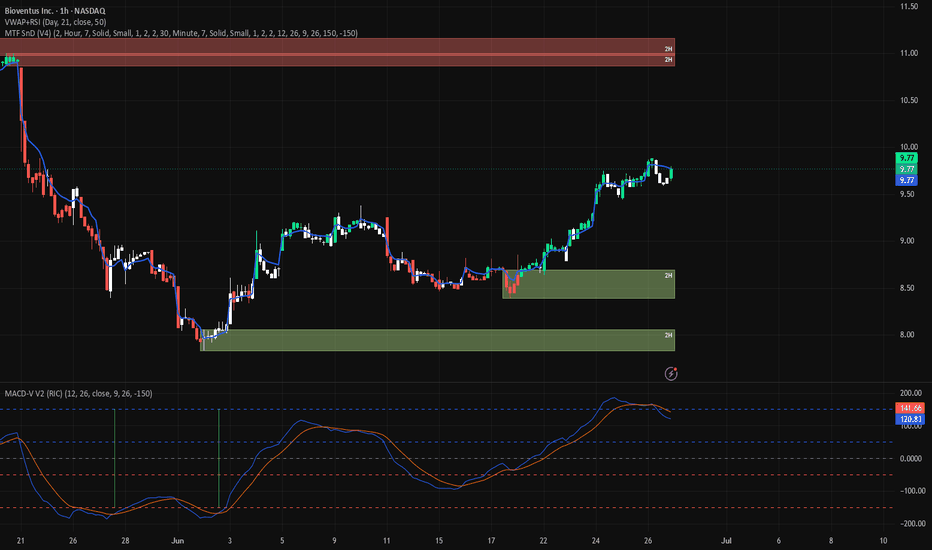
AlphaSpark Levels v6AlphaSpark Levels v6
Complete trading levels indicator with Volume Profile, VWAPs, Liquidity Swings, Previous Session H/L, and Gamma Exposure (GEX) Levels.
Features:
• Volume Profile (periodic + developing)
• VWAPs (Daily/Weekly/Monthly) with naked levels
• Liquidity Swings (15m, 4h, Daily, Weekly)
• Previous Session H/L (Daily, Weekly, Monthly) with labels
• GEX Levels (Gamma Flip, Call Wall, Put Wall, Highest OI, 0DTE Magnet)
• Dashboard widget with level summary
• Alerts for level crosses
How to use GEX Levels:
1. Join Discord for live GEX updates (link in comments)
2. Copy values from Discord posts
3. Paste into indicator inputs
4. Levels appear on chart automatically
Based on market maker hedging mechanics. Free for community members. Gösterge

Edo VWAP CoreEdo VWAP Core — Fair-Value Reading Built on Weekly and Monthly Anchored VWAP with Standard Deviation Bands, Premium/Discount States, Sigma Distance and Information Panel
The volume-weighted average price is, within any given period, the closest thing to an asset's fair value: it is the price every participant has actually paid, weighted by the volume traded on each candle. Whoever buys well above it is paying a premium relative to the market as a whole; whoever buys below is getting a discount. The session VWAP captures only one day and resets too often to be useful for swing work; anchoring the calculation to a higher horizon turns that same idea into a stable reference for positioning.
Edo VWAP Core builds on that principle by anchoring the VWAP to two horizons at once — the current week and the current month — and framing each line with standard deviation bands. On its own, an anchored VWAP is just a line. With Edo VWAP Core, that line gains a premium/discount state classification, a sigma-distance reading, deviation bands that delimit the cheap and expensive zones, a translucent fill between price and VWAP that switches colour with the active state, and an information panel that condenses the whole quantitative reading. Five coordinated layers on a single overlay, designed to answer one question continuously: is price trading expensive or cheap relative to what the market has actually paid?
WEEKLY AND MONTHLY ANCHORED VWAP
The indicator draws two anchored VWAPs simultaneously. The weekly line resets at the start of each new week and accumulates, candle by candle, the volume-weighted typical price up to the current moment; it is the main operational reference, plotted in blue. The monthly line resets at the start of each new month and accumulates the volume of the entire current month, so it runs slower and more stable, plotted in orange and providing the higher-horizon context. Both are calculated internally with the close of each candle of the active timeframe, so they do not depend on higher-timeframe functions and do not repaint: once a candle closes, its contribution to the VWAP is fixed. The default typical price source is hlc3, the standard input for VWAP.
The relationship between the two lines describes the value structure of the asset. Weekly above monthly with price above both reads as premium with buying pressure dominant across both horizons; weekly below monthly with price below both reads as sustained discount; price caught between the two lines is a transition zone with no clear value bias between the week and the month.
STANDARD DEVIATION BANDS
Around each VWAP the indicator draws two pairs of volume-weighted standard deviation bands, calculated consistently with the VWAP itself: the ±1σ pair delimits the normal fluctuation zone, and the ±2σ pair delimits the extreme zone, where price is statistically very far from fair value. The bands are what turn the VWAP from a simple line into a measurable value scale — they quantify how expensive or cheap price is trading in terms of standard deviations. The area between +1σ and +2σ is shaded warm (the premium zone), the area between −1σ and −2σ is shaded cool (the discount zone), and the central ±1σ band carries a faint tone of the VWAP colour to mark the equilibrium region. Band widths reflect the volatility of the period: the wider the bands, the more volatile the move.
PREMIUM / DISCOUNT STATE CLASSIFICATION
The indicator classifies each bar into one of five exclusive states according to the position of the close relative to the reference VWAP and its bands. Premium Extreme: close above +2σ, upside overextension. Premium: close between +1σ and +2σ, price trading expensive. Neutral: close within ±1σ, fair value around the VWAP. Discount: close between −1σ and −2σ, price trading cheap. Discount Extreme: close below −2σ, downside overextension. The colour code follows the classic premium/discount logic — warm tones for the expensive zone, cool tones for the cheap zone — and the state is reflected simultaneously in the price-VWAP fill, in the panel and, optionally, in the chart background and the candle colouring. The panel accompanies the state with a bar counter showing how many consecutive candles price has spent in it; a high counter inside Premium Extreme or Discount Extreme signals a sustained overextension.
By default the state is calculated over the weekly VWAP as the reference. If the corresponding input is disabled, the state is computed over the monthly VWAP instead, and the panel header indicates which one is in use with a "W ref" or "M ref" label.
SIGMA DISTANCE AND PRICE-VWAP FILL
Sigma distance is the central quantitative measure: it expresses how many standard deviations separate the current close from the reference VWAP, computed as the close minus the reference VWAP divided by the reference standard deviation. A positive value means price is above the VWAP (premium), a negative one below (discount). Because it is normalised, it behaves like a z-score — a reading of +2σ means the same on one asset as on any other, regardless of absolute price — which lets the degree of overextension be compared homogeneously across instruments. Between price and the reference VWAP the indicator draws a translucent fill in the colour of the active state, warm in premium, cool in discount, neutral around fair value, so the value condition of the asset is legible at a glance without consulting the panel; its opacity is configurable.
INFORMATION PANEL
The panel condenses the whole reading into a compact three-column table. Its header shows the active reference VWAP. It displays the current State with its colour and consecutive-bar counter; the σ Dist reading in standard deviations; the weekly VWAP value with an up/down arrow depending on whether price is above or below it, plus its ±1σ and ±2σ band levels; and the same block for the monthly VWAP with its own bands. The panel can be placed in any of the four chart corners and resized to Small or Medium, with Dark and Light themes to blend with the chart background. It can also be hidden entirely.
CONFIGURATION
The inputs are grouped by functional block. The Anchors block toggles the weekly and monthly VWAP independently, sets the price source (hlc3 by default) and the line width. The Bands block enables the deviation bands, sets the inner and outer multipliers (1.0 and 2.0 by default), the fill opacity, and which VWAP drives the state classification (weekly by default). The State block governs the visual translation of the state — background colouring, background opacity, candle painting, the price-VWAP fill and its opacity. The Style block exposes the five state colours, the weekly and monthly line colours and the Dark/Light theme, and the Panel block controls panel visibility, position and size. The defaults are calibrated to work without adjustment on stocks, crypto, forex, indices and futures; the only parameter most users touch is the band multipliers when adapting the value scale to a particularly volatile asset.
ALERTS
Nine predefined alert conditions cover every meaningful event: Premium Extreme, Premium, Neutral, Discount and Discount Extreme fire when price enters the corresponding state; Cross Above VWAP and Cross Below VWAP fire when price crosses the reference VWAP; and New Weekly Anchor and New Monthly Anchor fire when a new period begins and the corresponding VWAP resets. The two extreme-state alerts are the most useful for detecting overextensions, the VWAP cross alerts warn of bias changes relative to fair value, and the anchor-reset alerts flag when the reference has refreshed and the context should be reassessed. State-change alerts are best configured on bar close.
HOW TO READ IT
A clean reading combines the layers into common patterns. Mean reversion from an extreme: price reaches Premium Extreme or Discount Extreme beyond ±2σ and the bar counter grows — moves that far from fair value statistically tend to correct back toward the VWAP, so any entry against that direction starts from a high-risk zone. VWAP as dynamic support or resistance: in healthy trends price drifts toward the premium or discount zone, pulls back to the reference VWAP and bounces without losing it, the line acting as dynamic support in an uptrend or resistance in a downtrend, with the fill making the pullbacks visible. Weekly-monthly confluence: when both VWAPs and their bands overlap in the same price zone, that region gains weight — a discount that coincides with the weekly −1σ and the monthly VWAP is a far more solid value zone than one touching a single reference. VWAP reclaim after discount: price trading cheap reclaims the reference VWAP with an impulse candle, the fill flips colour and the state shifts from Discount to Neutral, marking the moment the asset stops trading cheap and returns to fair value — a value-bias change that often accompanies bullish resumptions.
OPEN SOURCE
Edo VWAP Core is published as a free open source indicator. The full Pine Script is publicly accessible on TradingView for study, adaptation and integration into any workflow. Part of the Edolab Markets free tools ecosystem alongside Edo SuperTrend Core, Edo Multi Stoch, Edo Liquidity Zones, Edo Ichimoku State and more available on TradingView.
This indicator is a technical analysis tool for educational and informational purposes only. It does not generate automatic buy or sell signals and should not be considered financial advice. Trading financial markets involves significant risk of capital loss. Past performance does not guarantee future results. Always use proper risk management. Gösterge

Dynamic Visible AVWAPDynamic Visible AVWAP is a visible-range anchored VWAP tool designed to help traders read active price interaction with important visible swing areas.
The script automatically anchors AVWAP lines from the highest high and/or lowest low inside the currently visible chart range. This makes the tool dynamic: when the visible chart area changes, the anchors are recalculated from the new visible range.
Additional AVWAPs can be enabled with the AVWAP Count setting. When more than one AVWAP is selected, the script adds extra anchors from the next valid swing highs or swing lows. This allows multiple AVWAP references to be displayed at the same time, creating a clearer view of potential confluence zones.
Main features:
Dynamic AVWAP based on the currently visible chart range
Long, Short, or All display modes
Optional multiple AVWAPs per side
Optional deviation channels around each AVWAP
Optional channel fill
Separate style controls for AVWAP lines, channels, arrows, and anchor text
Optional anchor arrows and custom anchor label text
Adjustable text size for anchor labels
Optimized line budgeting to keep the script stable when multiple AVWAPs are displayed
How it can be used:
Dynamic Visible AVWAP can help identify areas where price is interacting with volume-weighted mean levels from important visible swing points. These levels may be useful for context, confluence, pullback analysis, trend continuation review, or mean-reversion observation.
Important note:
The anchors are based on the currently visible chart range. If you zoom, scroll, or change the visible area of the chart, the AVWAP anchors may change because the script recalculates the highest high, lowest low, and additional swing anchors from the new visible range.
This indicator should be used together with broader market analysis, such as structure, volume, liquidity, higher-timeframe levels, and personal risk management. Gösterge

Gösterge

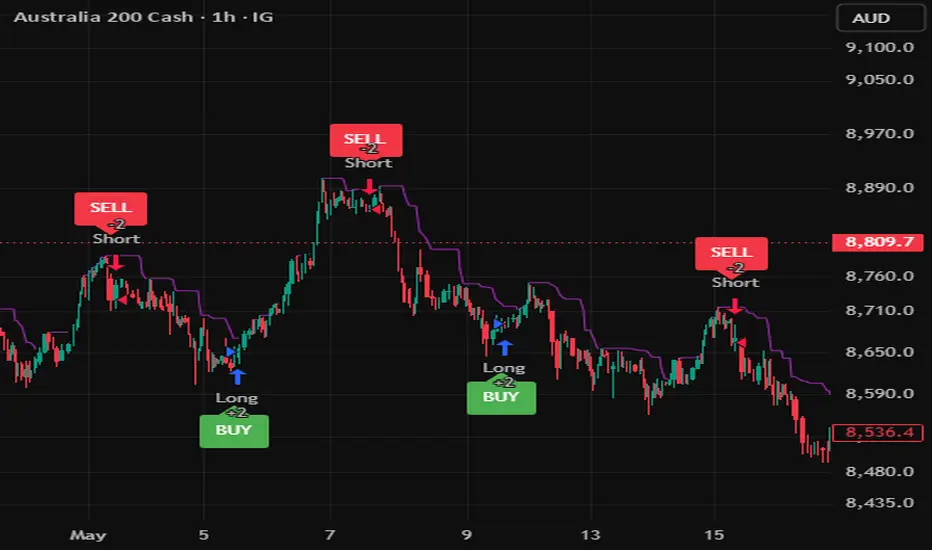
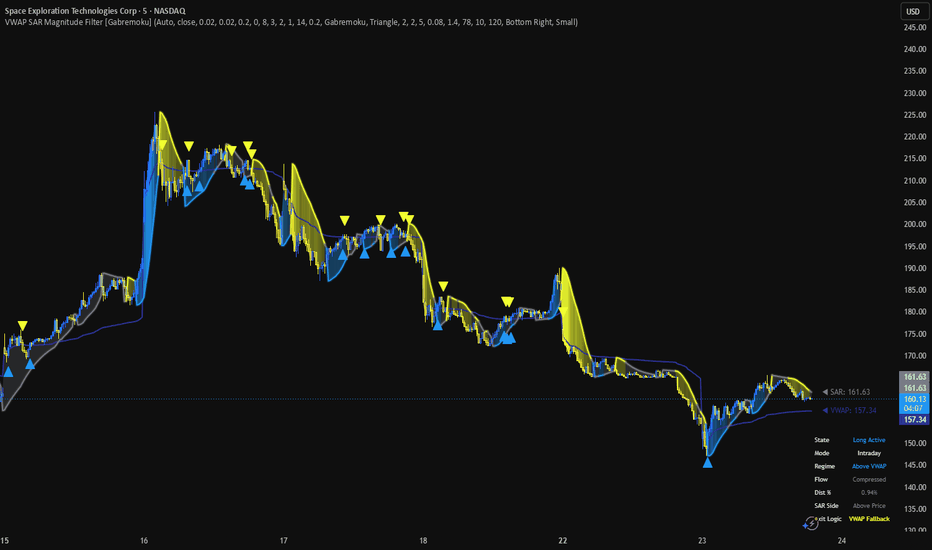
VWAP SAR Magnitude Filter [Gabremoku]VWAP SAR Magnitude Filter
Short description
A state-based long-only trend filter that combines VWAP context with Parabolic SAR structure. It uses VWAP as the main trend and invalidation line, while SAR confirms directional pressure and helps visualize momentum expansion or compression.
Descrizione completa
VWAP SAR Magnitude Filter is a long-only overlay designed to turn two familiar tools, VWAP and Parabolic SAR, into a cleaner operational framework rather than a simple indicator mashup.
The script uses VWAP as the primary market context and invalidation line. When price is above VWAP, the market is treated as having bullish intraday or swing context. When price falls back below VWAP, that context weakens and the script can trigger an exit.
Parabolic SAR is not used here as the primary exit engine. Instead, it acts as a structural confirmation tool. A valid long setup requires price to be above VWAP while SAR remains below the candle, which helps align directional bias and price structure. This reduces the number of signals that would appear if VWAP or SAR were used independently.
The script also includes an Auto mode engine. In Auto mode, lower intraday timeframes are handled with faster behavior, while higher timeframes are treated as swing conditions with additional filters. This makes the indicator adapt its sensitivity without requiring constant manual switching.
In Swing mode, the script becomes more selective by requiring:
persistence of the long condition for a minimum number of bars,
a minimum distance between price and SAR,
confirmed exit behavior below VWAP,
a longer cooldown after exits.
This approach is intended to reduce noise and avoid frequent re-entries during unstable or sideways phases. The indicator is therefore more focused on readable continuation structure than on generating many raw signals.
How it works
Long context: Price above VWAP.
Long confirmation: Parabolic SAR below the candle.
Long entry: The bullish context and structural confirmation align.
Exit logic: Main exit occurs on VWAP fallback; in Swing mode the fallback can require confirmation across multiple bars.
Mode engine: Auto selects Intraday or Swing behavior depending on the chart timeframe.
Visual features
VWAP line as the main reference level.
SAR line and glow for directional structure.
Magnitude fill between price and SAR to visualize pressure expansion and compression.
Optional bar coloring.
Dashboard with State, Mode, Regime, Flow, Distance %, SAR Side, and Exit Logic.
How to use it
This indicator works best when price is developing directional structure away from VWAP. In strong trends, it can help frame cleaner long continuation behavior. In choppy or sideways markets around VWAP, noise is naturally higher because the market lacks clear directional context.
A practical way to use it is:
monitor whether price is holding above VWAP,
wait until SAR is also positioned below price,
use the dashboard to confirm the current regime and state,
treat VWAP fallback as the main warning that the active long structure may be weakening.
Limitations
This indicator is not meant to eliminate all noise, especially in lateral environments where price oscillates around VWAP. In those conditions, repeated context shifts are part of market behavior, so no VWAP-based trend tool can remove all false transitions. The script is designed to reduce that noise, not to make it disappear completely.
It is also a context and structure tool, not a complete trading system. Users should still evaluate market conditions, liquidity, session behavior, and personal risk management before making decisions. Gösterge
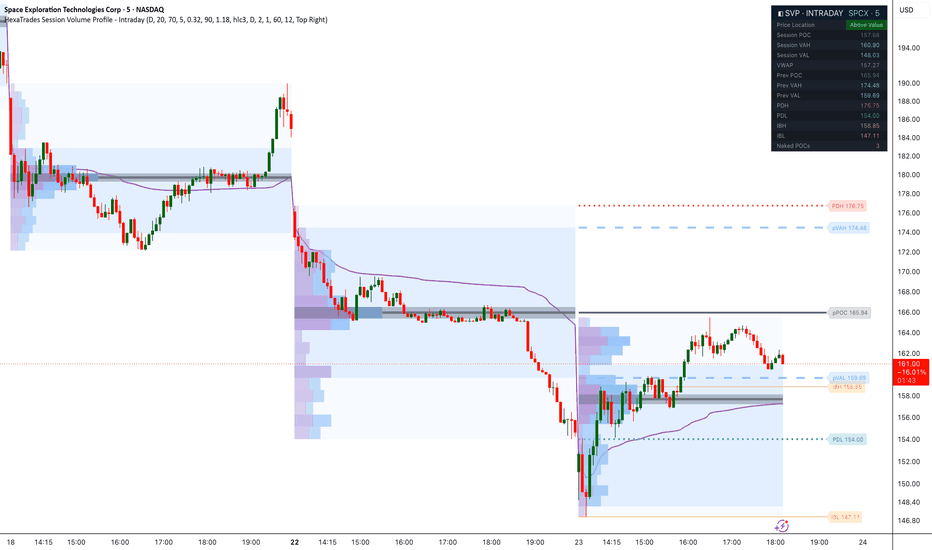
Session Volume Profile - Intraday [HexaTrades]Session Volume Profile Intraday is a comprehensive volume profile indicator designed specifically for intraday traders. It builds a separate volume profile for each session and automatically identifies the most important auction-market levels, including Point of Control (POC), Value Area High (VAH), Value Area Low (VAL), Previous Session Levels, VWAP, Previous Day High/Low, Initial Balance, and Naked POCs.
The goal of this indicator is to help traders understand where the market is accepting price, where major volume has traded, and where important support/resistance or liquidity zones may form during the trading session.
⭐️ How it works
-Binning: the session's price range (highest high to lowest low) is divided into Rows per Profile equal price bins.
-Volume distribution: each bar's volume is spread evenly across every bin its high–low range spans, and tagged buy or sell by candle direction.
-POC: the bin holding the most total volume.
- Value Area: starting from the POC, the algorithm expands outward always toward the heavier of the two neighbouring bins, until the accumulated volume reaches the chosen Value Area % (default 70%). The top and bottom edges of the included bins become VAH and VAL.
-Width: each row's bar length is scaled to its volume relative to the POC row, capped by the width settings.
⭐️What This Indicator Shows
🔷 Session Volume Profile: The indicator creates a horizontal volume profile for each trading session. Each profile shows how much volume traded at different price levels during that session.
The widest part of the profile represents the area with the highest traded volume. Thin areas show low-volume zones where price may move faster.
🔷 POC - Point of Control: POC is the price level with the highest traded volume during the session.
It is one of the most important levels on the chart because it represents the price where the market spent the most activity.
How to use POC:
- Price above POC can suggest buyers are in control.
- Price below POC can suggest sellers are in control.
- A retest of POC can act as support or resistance.
- A strong rejection from POC may create a trade setup.
- A clean reclaim of POC may show a change in intraday bias.
🔷 VAH and VAL - Value Area High / Low
The Value Area represents the price zone where most of the session’s volume traded, usually 70%.
VAH is the upper boundary of the value area.
VAL is the lower boundary of the value area.
How to use Value Area:
- Price inside value area = balanced market.
- Price above VAH = bullish acceptance/strength.
- Price below VAL = bearish acceptance/weakness.
- Rejection from VAH may create a short setup.
- Rejection from VAL may create a long setup.
- Breakout above VAH can indicate trend continuation.
- Breakdown below VAL can indicate downside continuation.
🔷 Previous Session POC / VAH / VAL
The indicator carries forward the previous session’s important profile levels into the current session.
These levels often act as strong support, resistance, or reaction zones.
How to use previous session levels:
- Previous POC can act as a major magnet level.
- Previous VAH/VAL can act as important breakout or rejection zones.
- If price opens above previous value, the market may be bullish.
- If price opens below the previous value, the market may be bearish.
- If price opens inside the previous value, the market may be balanced or rotational.
🔷 PDH and PDL - Previous Day High / Low
PDH means Previous Day High.
PDL means Previous Day Low.
These are important liquidity levels watched by many intraday traders.
How to use PDH/PDL:
- Break above PDH may show bullish momentum.
- Break below PDL may show bearish momentum.
- A fake breakout above PDH followed by rejection can indicate a liquidity sweep.
- A fake breakdown below PDL followed by recovery can indicate a downside liquidity sweep.
🔷 VWAP - Session VWAP
VWAP shows the average traded price of the session based on volume.
How to use VWAP:
- Price above VWAP = bullish intraday bias.
- Price below VWAP = bearish intraday bias.
- VWAP can act as dynamic support or resistance.
- POC + VWAP confluence can create a stronger reaction zone.
🔷 Initial Balance — IBH / IBL
Initial Balance is the high and low of the first part of the trading session. By default, it uses the first 60 minutes.
IBH = Initial Balance High
IBL = Initial Balance Low
How to use Initial Balance:
- Break above IBH may indicate a bullish trend day.
- Break below IBL may indicate a bearish trend day.
- Rejection from IBH/IBL may indicate range continuation.
- IB range helps define early-session structure.
🔷 Naked POCs
A Naked POC is a previous session POC that has not yet been retested by price.
How to use Naked POCs:
- They can act as future price magnets.
- Price often reacts when revisiting them.
- They can be used as target zones.
- Once price trades through a Naked POC, the level is considered tested.
⭐️ Dashboard
The dashboard provides a real-time summary of the current session and key reference levels, helping traders quickly assess market structure, auction location, and intraday bias.
- Price Location: Shows whether the current price is trading Above Value, Inside Value, or Below Value relative to the developing session Value Area.
- Session POC: Current session's Point of Control — the price level with the highest traded volume.
- Session VAH: Current session Value Area High.
- Session VAL: Current session Value Area Low.
- VWAP: Current session Volume Weighted Average Price.
- Prev POC: Previous session Point of Control, often acting as an important support, resistance, or mean-reversion level.
- Prev VAH: Previous session Value Area High, frequently used as a resistance level or bullish breakout trigger.
- Prev VAL: Previous session Value Area Low, frequently used as a support level or bearish breakdown trigger.
- PDH: Previous Day High, a key liquidity and breakout reference level.
- PDL: Previous Day Low, a key liquidity and breakdown reference level.
- IBH: Initial Balance High, representing the upper boundary of the opening range.
- IBL: Initial Balance Low, representing the lower boundary of the opening range.
- Naked POCs: Displays the number of active untested POCs from previous sessions that have not yet been revisited by price.
⭐️ How to Use This Indicator
🔷Step 1: Identify Market Bias
First, check where price is trading compared to VWAP, POC, and Value Area.
Bullish bias:
-Price above VWAP
-Price above session POC
-Price above VAH
-POC shifting higher
Bearish bias:
-Price below VWAP
-Price below session POC
-Price below VAL
-POC shifting lower
Neutral/balanced market:
-Price inside value area
-Price moving around POC
-VWAP is flat
-No clear acceptance above VAH or below VAL
🔷Step 2: Watch Key Reaction Levels
The most important reaction levels are:
- Current Session POC
-Previous Session POC
-VAH / VAL
-VWAP
-PDH / PDL
-IBH / IBL
-Naked POCs
When multiple levels are close together, that area becomes stronger confluence.
Example:
If VWAP, POC, and VAL are near the same price, that zone becomes an important support/resistance area.
🔷 Step 3: Look for Confirmation
Do not take trades only because price touches a level.
Wait for confirmation such as:
- Strong rejection candle
- Close above/below the level
- Retest and hold
- Volume expansion
- Failed breakout
- Market structure shift
- VWAP reclaim or rejection
Example Trade Setups
POC Rejection Setup
Bearish example:
- Price is below VWAP.
- Price rallies back to POC.
- Price rejects from POC.
- A bearish confirmation candle forms.
Possible entry: After rejection confirmation.
Possible stop: Above POC or above VAH.
Possible targets: VAL, PDL, or Naked POC.
POC Reclaim Setup
Bullish example:
- Price trades below POC.
- Price reclaims POC with a strong candle close.
- Price retests POC and holds.
- VWAP is also reclaimed.
- Possible entry: After retest and hold.
- Possible stop: Below POC or below VWAP.
- Possible targets: VAH, PDH, or previous value area.
Value Area Breakout
Bullish example:
- Price trades inside value area.
- Price breaks above VAH.
- Price holds above VAH.
- VWAP supports the move.
- Possible entry: Above VAH after confirmation.
-Possible stop:Back inside value area.
Possible targets: PDH, Naked POC, or next resistance zone.
Value Area Breakdown
Bearish example:
- Price trades inside value area.
- Price breaks below VAL.
- Price holds below VAL.
- Price remains below VWAP.
- Possible entry: Below VAL after confirmation.
- Possible stop: Back inside value area.
- Possible targets:PDL, Naked POC, or next support zone.
Previous Day High / Low Liquidity Sweep
Bullish PDL sweep example:
- Price breaks below PDL.
- Sellers get trapped.
- Price quickly reclaims PDL.
- Bullish candle closes back above PDL.
- Possible entry:After reclaim confirmation.
- Possible stop: Below sweep low.
- Possible targets: VWAP, POC, or VAH.
Bearish PDH sweep example:
-Price breaks above PDH.
- Buyers get trapped.
- Price quickly falls back below PDH.
- Bearish candle closes below PDH.
- Possible entry: After rejection confirmation.
- Possible stop: Above sweep high.
- Possible targets: VWAP, POC, or VAL.
Initial Balance Breakout
Bullish example:
- First 60-minute range forms.
- Price breaks above IBH.
- Price holds above IBH.
- VWAP and POC support the move.
-Possible entry: After the breakout and retest.
- Possible stop: Back inside IB range.
- Possible targets: VAH, PDH, or Naked POC.
Best Timeframes
- 5-minute chart
-15-minute chart
- Intraday futures
- Stocks
- Crypto
- Forex pairs
- For faster entries, the 5-minute can be used.
⭐️Alerts
All alerts are evaluated on confirmed bars only (no repaint):
- POC Cross Up / Down — price crosses the session POC.
- Value Area Breakout / Breakdown — price accepts above VAH or rejects below VAL.
- Prev POC Test — price tests the previous session's POC.
- PDH Break / PDL Break — price breaks the previous day's high or low.
- VWAP Cross — price crosses the session VWAP.
Session Volume Profile Intraday is designed to help traders visualise market-generated support and resistance using volume-based auction principles. By combining Session Volume Profiles, POC, Value Areas, VWAP, Previous Session Levels, PDH/PDL, Initial Balance, and Naked POCs, it provides a complete framework for intraday market analysis. Use it to identify key reaction zones, assess market bias, and improve trade planning. As always, combine it with sound risk management and your own trading strategy for the best results.
We would love to hear your suggestions. If you have ideas for new features, indicators, analytics, or improvements, please share your feedback. Your input helps guide future updates and improve the indicator for all traders.
This indicator is for educational and analytical purposes only. It should not be considered financial advice. Always use proper risk management and make trading decisions based on your own analysis
Gösterge
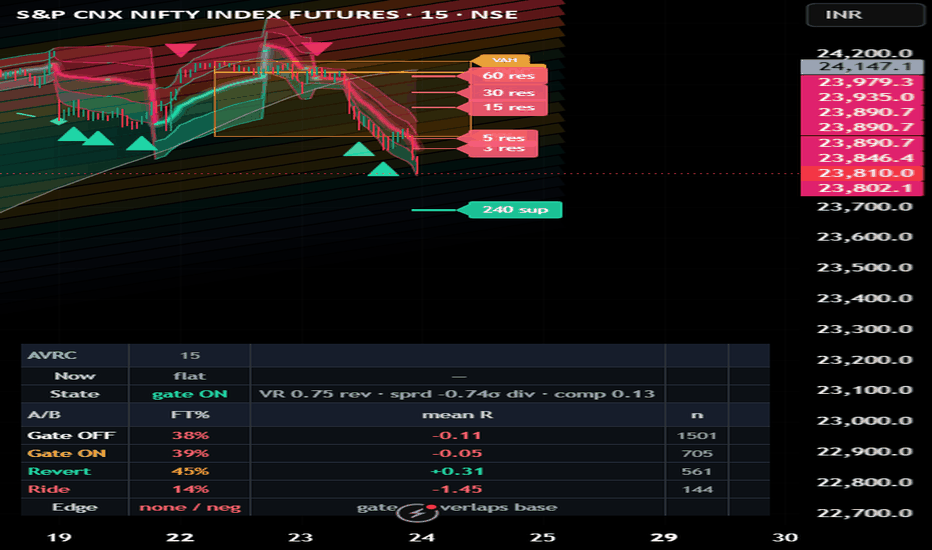
Adaptive Volumetric Reversion Channel Fade ValidatorAdaptive Volumetric Reversion Channel — Fade Validator (AVRC)
What it is
AVRC is an anchored, volume-weighted regression channel that frames mean-reversion ("fade") setups and then gates, scores and validates them — so you can see whether fading stretched price actually has an edge on your symbol and timeframe instead of taking it on faith. It is a study / analysis framework, not a strategy and not a signal service.
Why these components are combined (the mashup rationale)
Fading an extreme asks three different questions, and no single classic tool answers all three. AVRC coordinates several non-redundant lenses on one shared geometry (an anchored regression channel) and one shared volatility unit (residual σ), so each lens can check the others rather than echoing it:
WHERE is price stretched? A volume-weighted regression centerline with residual-σ bands is drawn against a slower macro trend-relative volume map — volume binned by σ-distance from a longer regression line. Whether the tactical band sits in a thin (fast-traversed) or thick (heavily-traded) macro node tells you if a fade is likely clean or absorbed. This cross-read is the connective tissue between the two layers.
Is a reversion ACTUALLY firing? Independent "tells" at the band — a close-back rejection, a band-confluent momentum divergence, an equal-high/low liquidity sweep, and the macro-density read. Because these tells are correlated, their agreement is shrunk by a design-effect correction so echoes can't masquerade as independent confirmation.
Is the market in a reverting STATE? A regime gate (variance-ratio test + a reversion-trust correlation) only passes fades when price increments offset rather than compound. An entry-time ride-risk score (macro-trend alignment, the two-centerline spread, an already-walking band, momentum, mean-reversion half-life, and multi-timeframe trend consensus) flags fades likely to be "walked" rather than reverted.
The components share one geometry and one volatility unit, and each can veto the others. The goal is to suppress low-quality fades more than to generate them.
How the validation layer works (what makes this more than a drawing)
Every fade is logged and, a fixed horizon later, resolved: its forward return is measured in ATR units and tabulated Gate ON vs Gate OFF — follow-through %, a Wilson 95% interval, whipsaw %, and mean R per fade. Outcomes are additionally split Reverted vs Rode, by macro node (thin/thick), and by ride-risk (low/high at the running median). The panel's Edge line synthesizes this into a single read: is Gate ON's follow-through interval clearing the ungated baseline with positive mean R and enough samples? Per-fade rows also export to the Data Window for your own analysis. Every filter has to earn its place against the ungated baseline.
How to use it
Set the Price source (top of settings). Defaults are tuned for an intraday index future; the source is user-selectable so the framework runs on any symbol or market. Volume-based parts (heatmap, profile, POC) need a real volume feed.
Read the panel top-down: Now (live setup) → State (regime + spread + compression) → the A/B scoreboard (Gate OFF, Gate ON, Revert, Ride) → Edge verdict.
A fade arms when price tags the outer band and at least one tell prints, then passes only if the regime (and optional ride-risk) gate agrees. Target is the centerline or the nearest untested POC.
If Gate ON does not beat Gate OFF on follow-through and mean R with non-overlapping intervals and enough samples, the edge isn't there on this symbol/timeframe — change them, don't force it. The signal is clearest on higher intraday timeframes; 1-minute is mostly noise.
What is original here
The original work is the coordination: a shared-σ, timeframe-adaptive regression channel used as a reversion frame; a trend-relative volume map cross-read against the band; decorrelated tells fused by a design-effect shrink; a statistical regime gate; an entry-time ride-risk score; and a built-in A/B + forward-return validation harness — combined so each lens can veto the others and the tool reports its own hit rate. It is not a re-skin of any single indicator.
Concept credits (techniques are standard; this implementation is original)
Volume-weighted least-squares & polynomial regression; residual-σ channels; anchored VWAP (all standard); Volume Profile / Value Area / Point of Control — Market Profile (Steidlmayer / CBOT); Variance-Ratio test — Lo & MacKinlay (1988); design effect / effective sample size — Kish (1965); proportion confidence interval — Wilson (1927); mean-reversion half-life — Ornstein–Uhlenbeck process; ATR, RSI, Parabolic SAR — Wilder; Stochastic — Lane; Supertrend (classic, MTF context). Builds on established open-source regression-channel and anchored-VWAP techniques.
Settings (all defaults are on; tuned for an intraday index future)
Data/Source · Volatility unit · Macro volume heatmap · Tactical channel & bands · Interrelation & band-walk · Ride-risk filter · Density cross-read · Reversion tells · Regime gate · POC targets · Fade signal · Validation & export · Dashboard & theme (auto light/dark) · MTF trend context. The two signal-suppression gates (walk-gate, ride-gate) ship off so the indicator shows its signals and lets the validation panel tell you whether enabling them helps.
Disclaimer
For research and education only. NOT financial advice, NOT a recommendation, and NOT a guarantee of future results. All statistics shown are in-sample on loaded history, close-to-close at the horizon, without costs or slippage — a study aid, not a backtest. Mean reversion fails in trends and during regime breaks. Do your own research and manage your own risk. Gösterge
Gösterge

EWO,RSI advanced Signals Strategy - Exhaustion Filter## EWO, RSI, MFI - Advanced Exhaustion Filter
## Overview
Strategy - Advanced Exhaustion Filter is a comprehensive momentum and mean-reversion trading strategy designed for Pine Script v6. It combines multi-indicator momentum tracking with structural price filters to protect traders from "falling knives" during market capitulation and distribution phases.
By blending the Elliott Wave Oscillator (EWO), Relative Strength Index (RSI), Money Flow Index (MFI), and volume-weighted confirmations, this strategy ensures you only enter a trade when genuine momentum returns to the market.
------------------------------
## How It Works##
1. Core Momentum Engine
The strategy relies on three distinct layers of confirmation before generating a trade:
* Elliott Wave Oscillator (EWO): Measures the displacement of price to determine the dominant market wave. Entries require the EWO to be ticking upward from below zero.
* Relative Strength Index (RSI): Filters structural momentum. A long entry triggers when RSI crosses above the critical 40 line, proving a shift out of bearish territory.
* Money Flow Index (MFI): Adds volume-weighted momentum to ensure asset accumulation is actually taking place rather than a low-liquidity squeeze.
2. The Exhaustion & Structural Filter (Anti-Falling Knife)
Standard momentum strategies often fail during deep market sell-offs because indicators flash "buy" on minor relief bounces while price continues to plummet. This script solves that problem using two proprietary rules:
* The Breakout/Breakdown Barrier: The script dynamically tracks the highest high and lowest low of the last N bars (lookback_len). Even if indicators say buy, the strategy will wait until price physically breaks above this local structural barrier.
* Capitulation Memory Flag: If the market enters a state of extreme panic (RSI drops below rsi_oversold), the strategy flags an "Exhaustion Zone". In this zone, the strategy prepares for an explosive trend reset, overriding standard barriers once momentum reverses.
3. Volumetric Confirmation
Signals are filtered through a volume moving average (Volume MA). Entries and exits are only permitted if market volume is at least 80% of its recent average, keeping you out of choppy, illiquid trading sessions.
------------------------------
## Strategy Parameters
* EWO Fast / Slow (Default: 5, 34): The short and long-term moving averages used to calculate the Elliott Wave Oscillator waves.
* RSI Length (Default: 14): The lookback window for trend and exhaustion momentum.
* MFI Length (Default: 14): The lookback window for volume-weighted money flow tracking.
* Breakout Lookback Bars (Default: 10): The number of historical bars used to calculate local structural highs and lows to prevent premature entries.
* Exhaustion RSI Level (Default: 30): The extreme oversold threshold that triggers capitulation logic.
------------------------------
## Best Practices & Asset Classes
* Timeframes: Optimised for 15-minute, 1-hour, and 4-hour charts where structural highs and lows carry significant weight.
* Markets: Highly effective on trending assets with periodic high-volatility liquidations, such as Crypto (BTC, ETH), major Forex pairs, and Tech Stocks.
------------------------------
## ⚠️ Disclaimer
Financial Risk Warning: Financial trading involves substantial risk of loss and is not suitable for every investor. The information, strategies, and script provided here are strictly for educational, informational, and research purposes.
No Advice: This script is not financial advice, an investment recommendation, or a solicitation to buy or sell any financial instrument. Past performance as demonstrated by historical backtesting is never a guarantee of future results.
User Responsibility: Markets change rapidly, and default settings may not fit all assets or market conditions. You are fully responsible for your own trading decisions. Always thoroughly backtest, forward-test on a demo account, and apply your own strict risk management protocols before risking real capital.
Strateji

VWAP Deviation Score [DYNA]VWAP Deviation Score expresses how stretched price is from the session's VWAP as a single z-score number — the count of intraday standard deviations between the current close and the volume-weighted mean. Zero means price is sitting on VWAP. ±1 is one standard deviation away (~68% statistical envelope). ±2 is the alertable extreme (~95% envelope). Beyond ±2 is a statistically uncommon reading under a normal distribution.
The indicator lives in its own pane below price. The smoothed z-score line is colored by zone — green inside ±1σ, amber between ±1σ and ±2σ, red beyond ±2σ — so the current state is readable at a glance. Three confirmed-bar alerts cover the actionable transitions: extreme bullish stretch, extreme bearish stretch, and the return back to VWAP after an extreme reading.
Unlike rolling-window z-score indicators, this one anchors VWAP and the standard deviation to the session open. The dispersion measurement therefore reflects only today's price action, not yesterday's noise — every session starts fresh.
Key Features
Session-Anchored Z-Score -- True intraday measurement of stretch from VWAP. Resets every session, no carryover from yesterday.
Three-Zone Coloring -- Normal (green), caution (amber), extreme (red). The line color tells you the regime before you read the number.
Configurable Thresholds -- Independent caution and extreme threshold inputs (defaults ±1σ and ±2σ). Adjust per instrument volatility.
EMA Smoothing -- Optional smoothing of the raw z-score (default length 3) to suppress threshold-flicker on noisy timeframes.
Three Alerts -- Extreme bullish deviation, extreme bearish deviation, return to VWAP after an extreme. All confirmed on bar close.
Early-Session Guard -- Configurable minimum-bars filter (default 5) prevents noise alerts when intraday standard deviation has not yet stabilised.
Compact Dashboard -- Top-right table shows current z-score, zone label, and bar count since session open.
Volume-Agnostic -- Works on instruments with or without published volume. Cash indices with no published volume fall back to a flat weight automatically.
No Repainting -- Signal conditions gated on confirmed bars; once an alert has fired, the historical signal does not move.
How It Works
At the start of each session the indicator begins accumulating volume-weighted sums of the source price and the source price squared. From these it derives the session VWAP (Σ src·vol / Σ vol) and the volume-weighted variance (Σ src²·vol / Σ vol − VWAP²). The standard deviation is the square root of the variance.
The raw z-score is then (close − VWAP) / σ — the number of standard deviations between the current close and the session mean. A short EMA is applied to the raw value to produce the smoothed signal line shown on the chart.
The score is classified into three zones: normal (|z| < caution), caution (caution ≤ |z| < extreme), and extreme (|z| ≥ extreme). The line colour, the pane background, and the dashboard all reflect the current zone.
Signals fire only on confirmed (closed) bars. "Extreme bullish deviation" fires the bar the smoothed z-score crosses above the extreme threshold; "extreme bearish deviation" mirrors it on the negative side. "Return to VWAP" fires when the score crosses zero after having been beyond the extreme threshold earlier in the same session — paired with the extreme alerts, it marks the completion of a mean-reversion round trip.
Smoothed z-score (zone-coloured line) plotted in a separate pane with the VWAP at zero, ±1σ caution dotted lines, and ±2σ extreme dashed lines. Triangle markers fire on extreme deviations; the diamond marks the return back to VWAP.
Settings
Session Time (default: 0915-1530) and Timezone (default: Asia/Kolkata) define the session window that anchors the VWAP. VWAP Source (default: hlc3) sets the price used in the weighted average; hlc3 matches TradingView's built-in VWAP.
Extreme Threshold (default: 2.0σ) is the alertable line. Caution Threshold (default: 1.0σ) opens the amber zone but does not fire alerts -- it is purely a visual aid for the colour band. Signal Smoothing (default: 3) is the EMA length applied to the raw z-score. Min Bars Before Signals (default: 5) suppresses signals while the early-session standard deviation is still stabilising.
The Visual toggles control the optional raw z-score line, the zone fills, the extreme background tint, and the dashboard table. The three Alert toggles enable or disable each alert independently.
Alerts
Extreme Bullish Deviation -- Fires on the bar the smoothed z-score crosses above the extreme threshold. Price is in the top tail of the intraday distribution. "VWAP Deviation Score : Z-score crossed above the extreme upper threshold -- price stretched well above session VWAP."
Extreme Bearish Deviation -- Fires on the bar the smoothed z-score crosses below the negative extreme threshold. Mirror of the bullish case. "VWAP Deviation Score : Z-score crossed below the extreme lower threshold -- price stretched well below session VWAP."
Return to VWAP -- Fires when the smoothed z-score crosses zero after having been beyond the extreme threshold earlier in the same session. Marks the completion of a mean-reversion round trip. "VWAP Deviation Score : Z-score returned to zero after an extreme deviation -- mean-reversion to session VWAP confirmed."
To set up alerts: click TradingView's Alerts button, choose "VWAP Deviation Score " from the condition dropdown, pick one of the three alert variants, and select your notification channel.
Best Practices
Read the line colour first, the number second. The zone tells you the regime; the exact value is for fine-tuning entries.
Extreme readings mark the tails of the intraday distribution -- a zone many traders watch for potential mean-reversion. The "Return to VWAP" alert can mark when price has traded back to the session mean.
Tune the extreme threshold per instrument. 2σ is a good default; raise to 2.5-3σ on highly volatile small-caps or crypto, lower to 1.5σ on slow-moving instruments.
Combine with a higher-timeframe trend filter to choose which side of an extreme reading to take. With-trend extreme readings often mark continuation pullbacks; counter-trend extremes mark exhaustion.
Give the indicator at least 5-7 bars after session open before reading it. The minimum-bars guard suppresses alerts but the visible value can still be unstable while standard deviation is stabilising.
On cash-index charts with no published volume, treat this as a session-anchored standardised price oscillator rather than a true volume-weighted z-score. The signal logic is unchanged; only the per-bar weighting falls back to flat.
Part of the DYNA Ecosystem
VWAP Deviation Score is a free indicator built with the same design standards as the DYNA premium suite. For complete trade management with automatic stop loss, break-even, trailing stops, and multi-target systems, explore the full DYNA indicator collection.
Disclaimer
This indicator is a technical analysis and educational tool only -- it is not financial advice and makes no guarantee of any outcome. Past performance does not predict future results. Always do your own research and use proper position sizing and risk management.
Created by Varun Nidhi · varunnidhi.com
A free DYNA indicator — self-contained, no repainting.
Gösterge

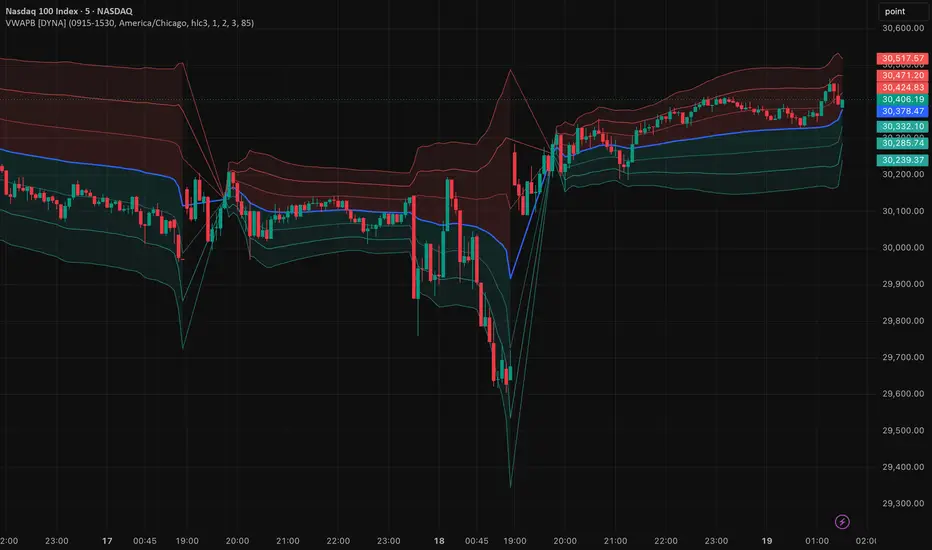
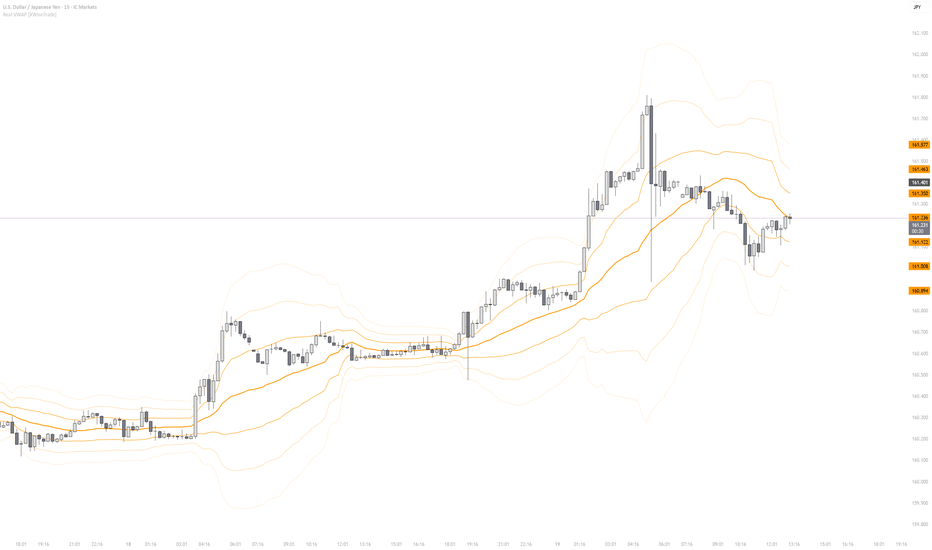
VWAP Bands [DYNA]VWAP Bands plots a session-anchored Volume Weighted Average Price together with three pairs of standard-deviation bands at ±1σ, ±2σ, and ±3σ. VWAP is the session's dynamic fair value, and the bands are its statistical envelope: inside ±1σ is normal, beyond ±2σ is stretched, beyond ±3σ is extreme. The result is a single overlay that tells you where price sits relative to the day's mean and how volatile that session actually is.
Most VWAP indicators give you only the line. Most band indicators (Bollinger, Keltner) use a rolling window that carries yesterday's noise into today. VWAP Bands combines the two: volume-weighted anchoring plus intraday-only σ bands that widen and contract with the current session's realised volatility. At session open the bands reset to zero and fan out as the session develops.
Key Features
Session-Anchored VWAP -- Uses the TradingView session picker plus a timezone dropdown so the same indicator works on any regional market without code edits.
Three Band Pairs -- ±1σ, ±2σ, ±3σ with independently configurable multipliers. Each pair has its own visibility toggle.
Adaptive Volatility Envelope -- Bands widen automatically when intraday volatility rises and compress on quiet sessions. No manual lookback window required.
Gradient Band Shading -- Optional zone fills between adjacent bands, lighter toward the outer bands, so you can read where price is inside the envelope at a glance.
Volume-Agnostic -- On instruments with no traded volume (some cash indices) the indicator falls back to a flat weight, so VWAP and bands still render meaningfully.
Four Alerts -- Bullish VWAP cross, bearish VWAP cross, +2σ touch, -2σ touch. All confirmed on bar close.
No Repainting -- Signal conditions are gated on confirmed bars; once an alert has fired, the historical signal does not move.
How It Works
At the start of each session -- determined by your session window and timezone -- the indicator begins accumulating the typical price weighted by volume: Σ(src × vol) divided by Σ(vol) gives the VWAP. In parallel it tracks Σ(src² × vol) to compute the volume-weighted variance, then the square root is the standard deviation. Bands are plotted at VWAP ± (multiplier × σ) for each of the three multipliers.
Because the sums are cumulative from session open, every bar updates VWAP and the bands. At the start of the session the bands collapse onto the VWAP line; as the session progresses they fan out and reflect the volatility the market is actually producing that day.
When the session ends and a new one begins, all accumulators reset. The lines are drawn only inside the configured session window -- no stale levels during off-hours.
VWAP (blue) with ±1σ, ±2σ, ±3σ bands (green below, red above) anchored to the session open. Bands fan out from VWAP as the session's realised volatility accumulates.
Settings
Session Time (default: 0915-1530) and Timezone (default: Asia/Kolkata) define the session window. VWAP Source (default: hlc3) sets the price used in the weighted average; hlc3 matches TradingView's built-in VWAP.
Band 1 / 2 / 3 Multiplier (defaults 1.0, 2.0, 3.0) set each band pair's offset in standard deviations. The defaults match the statistical convention -- ±1σ covers roughly 68% of in-session variation, ±2σ ~95%, ±3σ ~99.7% under a normal distribution. Adjust upward if the default envelopes feel too tight for your instrument.
Show VWAP Line and the three Show ±Nσ Bands toggles let you hide any line you do not want on the chart. Shade Between Bands enables gradient fills between adjacent bands; Fill Transparency (default: 85) controls how subtle those fills are.
The two alert toggles enable or disable the VWAP-cross and ±2σ-touch alerts independently.
Alerts
Price Crosses Above VWAP -- Fires when close crosses above the VWAP line, signalling a session bias flip to bullish. "VWAP Bands : Price crossed above VWAP -- session bias flipping bullish."
Price Crosses Below VWAP -- Fires when close crosses below the VWAP line. "VWAP Bands : Price crossed below VWAP -- session bias flipping bearish."
Price Touches +2σ Band -- Fires when the bar high reaches the +2σ upper band, marking a stretched upside condition. "VWAP Bands : Price touched the +2σ upper band -- stretched above VWAP."
Price Touches -2σ Band -- Fires when the bar low reaches the -2σ lower band, marking a stretched downside condition. "VWAP Bands : Price touched the -2σ lower band -- stretched below VWAP."
To set up alerts: click TradingView's Alerts button, choose "VWAP Bands " from the condition dropdown, pick one of the four alert variants, and select your notification channel.
Best Practices
Give the bands 3-5 bars to stabilise at session open. Early-session standard deviation is tiny so the bands collapse onto VWAP; wait for the fan-out before reading them.
Use ±2σ and ±3σ as mean-reversion zones. Touches of the outer bands under normal volatility often see a snap back toward VWAP, especially on higher timeframes.
Use VWAP itself and ±1σ as pullback entry zones when price is trending cleanly on one side of VWAP.
On volatile news sessions, bands expand rapidly -- a ±2σ touch there is much less extreme than a ±2σ touch on a quiet session. Let the band width itself inform how much weight to give each touch.
On cash-index charts with no volume, treat the indicator as a session-anchored σ-band system rather than a true VWAP. The bands still reflect intraday dispersion meaningfully; the weighting just falls back to flat.
Match Session Time to regular trading hours only -- including extended hours drags the VWAP and widens the bands unnecessarily.
Part of the DYNA Ecosystem
VWAP Bands is a free indicator built with the same design standards as the DYNA premium suite. For complete trade management with automatic stop loss, break-even, trailing stops, and multi-target systems, explore the full DYNA indicator collection.
Disclaimer
This indicator is a technical analysis and educational tool only -- it is not financial advice and makes no guarantee of any outcome. Past performance does not predict future results. Always do your own research and use proper position sizing and risk management.
Created by Varun Nidhi · varunnidhi.com
A free DYNA indicator — self-contained, no repainting.
Gösterge

VWAP Deviation Divergence OscillatorVWAP Deviation Divergence Oscillator
## Overview
The VWAP Deviation Divergence Oscillator turns the **deviation of price from its session-anchored Volume-Weighted Average Price (VWAP)** into a standardized, bounded oscillator, and then looks for **divergence between price and that deviation**. The idea it tests: when price makes a new extreme but sits less far from VWAP than before, the volume-weighted average is no longer confirming the move.
It is a single-pane oscillator. It requires real traded volume (use a futures contract; cash indices report none, in which case the dashboard shows "no volume"). Every data input is user-configurable, so it runs on any symbol that reports volume, in any market and on any timeframe. Defaults target NSE NIFTY index futures on intraday charts.
## What it plots
- A z-scored **VWAP deviation oscillator** (stretched above VWAP = up, stretched below = down), with a glow line and sigma-based overbought/oversold levels.
- **Extreme-zone bands** (default +/-3 sigma) with a gradient fill that deepens toward the edge.
- **Divergence lines and labels** on the oscillator - regular (reversal) and hidden (continuation), in two colors.
- **In-band reversal dots** where the oscillator turns inside an extreme zone.
- Optional **price-pane marks** at the confirmation bar (all generated by this one indicator).
- A **background-adaptive status dashboard** (oscillator value in sigma, zone, last divergence, last reversal, live distance to VWAP).
## Why these components are combined (mashup rationale)
This script combines a **derived measure**, a **normalization stage**, a **divergence engine** and a **reversal read**, because each answers a question the others cannot and none is useful here alone:
1. **VWAP deviation (price + volume).** VWAP is the volume-weighted "fair value" the session has actually transacted at - it blends price and traded volume, which a price-only oscillator does not. How far price sits from VWAP, in standardized terms, is a mean-reversion read: the deviation = price - session VWAP.
2. **Standardization (rolling z-score).** VWAP deviation differs in scale across instruments. The z-score expresses it in standard-deviation units, so "overbought/oversold" and the extreme bands mean the same thing on NIFTY, on a commodity future, or on a crypto instrument. Without this step the divergence thresholds would not transfer between symbols.
3. **Divergence engine.** The original payload is reading **price-versus-VWAP deviation disagreement at confirmed pivots**. The engine pairs each new price pivot with the oscillator value, then requires: a genuine new price extreme; the measure failing to confirm it; a minimum oscillator gap scaled to the oscillator own stdev; the two pivots within a maximum bar distance; and optionally an overbought/oversold reading at the pivot. These gates make the combination produce signal rather than noise.
4. **Reversal read.** Independently, the engine flags oscillator turns that occur inside the extreme bands - a complementary exhaustion cue.
Together the components form one pipeline: **build the signal -> make it comparable (z-score) -> surface where price and that signal disagree (divergence) and where it exhausts (reversal).** Each is incomplete alone.
## How it works (method)
deviation = price - session-anchored VWAP (which resets each session and requires real volume); this is standardized with a rolling z-score to the oscillator.
Regular and hidden divergence are detected from confirmed pivothigh/pivotlow pivots and filtered by the gates above; reversals are oscillator pivots that print inside the extreme bands. Pivots confirm a few bars after they occur, so a printed signal does not repaint. The confirmation lag equals the pivot length.
## How to use it
1. Add the indicator on a volume-bearing instrument (a futures contract); on a cash index it will read "no volume".
2. Read divergence as **context, not a trigger**: a bearish divergence (price higher high, deviation lower high) says price is less extended above VWAP than at the prior high; a bullish divergence says the opposite at lows. Confirm with your own structure, levels and risk process.
3. Tune the **pivot length**, **max gap** and **min oscillator gap** to your timeframe; raise them for fewer, cleaner signals.
## Originality
This is an original implementation - not a VWAP deviation line and not a generic divergence script, but the specific combination of VWAP deviation, sigma-standardization that makes the read portable across markets, a multi-gate divergence engine (magnitude + distance + extreme-zone), hidden-divergence and in-band reversal detection, and a background-adaptive dashboard. The code is written from scratch; helper functions use only their arguments and built-ins.
## Credits
The **Volume-Weighted Average Price (VWAP)** and **price/oscillator divergence** are standard, publicly documented techniques. This script is not affiliated with, nor endorsed by, any third party.
## Notes / limitations
- VWAP deviation needs real volume and is session-relative; it resets each session and is undefined without a volume feed.
- Divergence is descriptive context, never a guarantee of reversal.
- Confirmation lags each pivot by the pivot length.
## Disclaimer
Research and educational tool only. NOT financial advice and no guarantee of profitability or accuracy. Indicators describe past behaviour; they do not predict the future. Trading carries risk of loss. Test out-of-sample and make your own decisions. The author accepts no liability for any use of this script.
Gösterge

Gösterge
Anchored VWAP Reversion ChannelAnchored VWAP Reversion Channel — Regime-Gated Fade Framework
## What this script does
This is an **analytical study** that frames mean-reversion ("fade") setups around an **anchored, volume-weighted regression channel**, then **gates** those setups by a statistical market-state test and **scores** them against their own forward outcomes. It does not place orders and it is not a signal service — its purpose is to let you see, on your own instrument and timeframe, whether fading a stretched move actually has an edge, instead of assuming it does.
It plots one channel (a centre line plus inner/outer residual-σ bands), marks fade setups at the outer band, draws supporting context (volume-profile POC / value area, untested prior-session POCs, momentum divergences, liquidity sweeps, and multi-timeframe trend lines), and reports a compact validation panel.
## Why these components are combined (mashup rationale)
Fading an extreme is really three separate questions, and no single classic indicator answers all three. Stacking look-alike indicators just echoes one input, so this tool deliberately combines **three non-redundant lenses and makes them check each other**:
1. **WHERE is price stretched?** — A **volume-weighted polynomial regression** anchored at the most recent swing pivot, with **residual-σ bands**. Because the curve tilts with the active leg, an outer-band tag stays meaningful even inside a trend, where a flat cumulative VWAP would not. A **volume profile** anchored to the *same* window supplies POC and value area, and prior-session POCs that have never since been traded through become **reversion targets**.
2. **Is a reversion actually firing here?** — Three orthogonal **tells** evaluated only at the band: a **close-back rejection**, a **band-confluent momentum divergence**, and an **equal-high/low liquidity sweep** (stop-run). Crucially, all three are derived from the same stretch, so their agreement is shrunk by a **design-effect correction** (effective-sample-size): three correlated echoes are not allowed to masquerade as three independent confirmations.
3. **Is the market in a reverting state at all?** — A **regime gate** combining a **variance-ratio test** and a **reversion-trust correlation** only lets a fade through when recent increments are offsetting (mean-reverting) rather than compounding (trending).
The pieces are not bolted together side by side: they share **one geometry** (the anchored channel) and **one volatility unit** (residual σ / ATR), and each can veto the others. A band tag with no tell does nothing; a tell with no reverting regime does nothing. The design goal is to **suppress** low-quality fades — into a trend, mid-range, or backed by a single echoed tell — more than to generate them.
## The honesty layer (what makes this more than a drawing)
Every fade that fires is logged and, a fixed horizon later, **resolved**: its forward return is measured in ATR units and tabulated **with the regime gate ON versus OFF**, reporting follow-through %, whipsaw %, a Wilson 95% confidence interval, and the **mean return per fade**. A per-fade series also exports to the Data Window so you can study the full return distribution offline. The gate has to **beat its own ungated baseline** to justify itself — the framework is built to be tested, not trusted blindly.
## How to use it
1. Set the **Price source** (group 01). It works on any symbol and any market; volume-based parts need a real volume feed.
2. A fade **arms** when price tags the outer band **and** at least one tell prints, then **passes** only if the regime gate reports a reverting state. Solid triangles are gated fades; the target is the centre line or the nearest untested POC.
3. Read the panel top-down: does **Gate ON** beat **Gate OFF** on both follow-through and mean R, with non-overlapping intervals and a reasonable sample size? If not, the edge is not present on this symbol/timeframe — change them rather than forcing the trade.
4. The signal lives on **higher intraday timeframes**; one-minute data is mostly noise.
## Defaults
Shipped tuned for **NSE:NIFTY** index futures on intraday timeframes (sources, pivot lengths, value-area %, and the Tuesday-style weekly session context reflect that instrument). Every value is exposed as an input — change the **Price source** and the relevant lengths to run the framework on any other instrument or market.
## What is original
The original work is the **coordination**, not any single formula: an anchored polynomial-regression channel used as a reversion frame, three decorrelated band tells fused by a design-effect shrink, a statistical regime gate, and a built-in A/B + forward-return validation harness — combined so each lens can veto the others and the whole thing reports its own hit rate. It is not a re-skin of one indicator.
## Concept credits (techniques are standard; this implementation is original)
Anchored VWAP (standard); volume-weighted least-squares / polynomial regression (standard); residual-σ channel (standard); Volume Profile, Value Area and POC — Market Profile, Steidlmayer / CBOT; Variance-Ratio test — Lo & MacKinlay (1988); design effect / effective sample size — Kish (1965); proportion confidence interval — Wilson (1927); ATR trailing stop / Supertrend (classic, used for the multi-timeframe context lines); RSI — Wilder; Stochastic — Lane.
## Disclaimer
For research and education only. This is an analytical study, **not** financial advice, **not** a recommendation, and **not** a guarantee of future results. All statistics shown are **in-sample** on loaded history, close-to-close, without costs or slippage — a study aid, not a backtest. Mean reversion fails in trends and through regime breaks. Do your own research and manage your own risk.
Gösterge

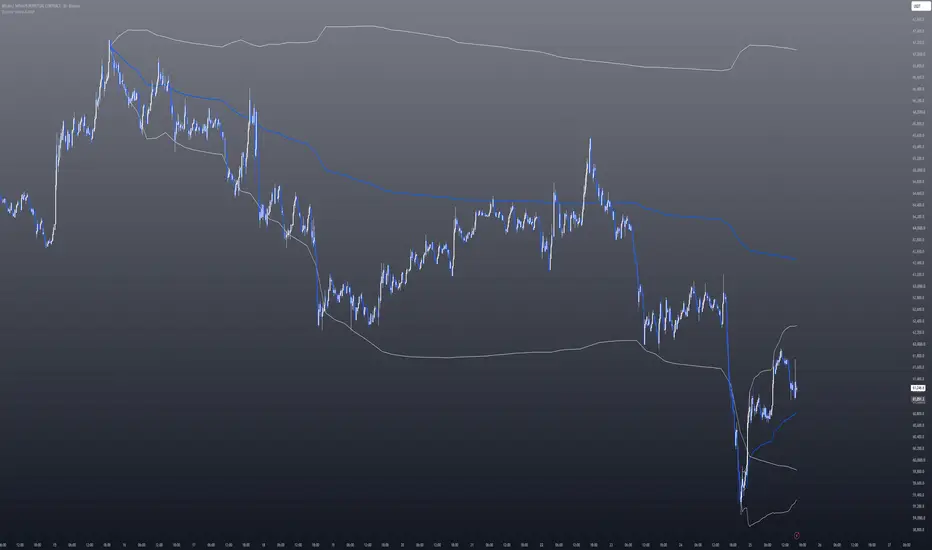
Anchored VWAP Sigma BandsAnchored VWAP Sigma Bands
1. Overview
Anchored VWAP Sigma Bands is a chart-based analysis indicator that plots an Anchored Volume-Weighted Average Price together with volume-weighted standard deviation bands.
The purpose of the tool is to help traders study fair value, price extension, and distance from an anchored VWAP reference point.
This is an indicator, not a strategy. It does not place trades, does not execute orders, and does not produce TradingView Strategy Tester results. All levels are visual analytical references only and should not be treated as guaranteed support, resistance, reversal, or continuation signals.
2. Core Idea
Standard VWAP usually resets by session or period.
Anchored VWAP is different because it starts from a selected anchor point.
That anchor can represent an important market event, such as a major high, major low, selected date, start of a year, start of a month, start of a week, or a new highest/lowest level over a lookback window.
From that anchor point, the indicator calculates the volume-weighted average price.
This creates a reference for the average price traded since the selected anchor.
3. Anchored VWAP Line
The main blue line is the Anchored VWAP.
It represents the volume-weighted average price from the active anchor point.
A price above the anchored VWAP may suggest that price is trading above the volume-weighted fair value from that anchor.
A price below the anchored VWAP may suggest that price is trading below the volume-weighted fair value from that anchor.
This should be interpreted as context only. It does not guarantee future price direction.
4. Sigma Bands
The indicator calculates volume-weighted standard deviation from the anchored VWAP.
The sigma bands show how far price has moved from the anchored VWAP in statistical terms.
The script can plot:
* +1 Sigma
* -1 Sigma
* +2 Sigma
* -2 Sigma
* +3 Sigma
* -3 Sigma
The +sigma bands are above the anchored VWAP.
The -sigma bands are below the anchored VWAP.
These bands can help identify areas where price is statistically extended relative to the anchored VWAP.
5. Band 1
Band 1 is the first standard deviation band.
By default, it uses 1.0 sigma.
This band can help users observe the normal upper and lower range around the anchored VWAP.
6. Band 2
Band 2 is the second standard deviation band.
By default, it uses 2.0 sigma.
This area can represent a stronger statistical extension from the anchored VWAP.
A move into the +2 or -2 sigma area does not guarantee reversal. It only shows that price is extended relative to the anchored VWAP calculation.
7. Band 3
Band 3 is optional and is OFF by default.
By default, it uses 3.0 sigma.
This band is intended for users who want to monitor deeper statistical extensions.
Because 3 sigma areas can be far away from price on some markets, this band is optional to keep the chart clean.
8. Anchor Modes
The indicator includes several anchor modes.
Manual date
The user selects a specific date and time as the anchor.
This is useful when anchoring VWAP to an important event, such as a major low, major high, breakout, earnings date, market cycle start, or a selected analysis date.
Year
The anchored VWAP resets at the start of each new year.
Month
The anchored VWAP resets at the start of each new month.
Week
The anchored VWAP resets at the start of each new week.
Highest high (N)
The anchor resets when price forms a new highest high over the selected lookback window.
This mode can be used to study dynamic resistance-based anchors.
Lowest low (N)
The anchor resets when price forms a new lowest low over the selected lookback window.
This mode can be used to study dynamic support-based anchors.
9. Dynamic Anchor Behavior
Dynamic anchor modes such as Highest high (N) and Lowest low (N) re-anchor when a new selected high or low forms.
This is expected behavior.
These modes are designed to update the anchored VWAP reference when the market creates a new extreme over the selected lookback.
Manual date mode is more static because the user chooses a fixed anchor date.
10. Anchor Marker
The indicator can display an anchor marker on the chart.
The anchor marker shows where the current anchored VWAP calculation begins.
To keep the chart clean, the script keeps only the most recent anchor marker visible.
Users can enable or disable the anchor marker from the settings.
11. Optional Anchor Line
The script includes an optional vertical anchor line.
When enabled, it marks the latest anchor point on the chart.
This option is OFF by default to keep the chart visually clean.
12. Volume-Weighted Calculation
The indicator uses volume in its VWAP and standard deviation calculations.
This means that higher-volume bars have more influence on the anchored VWAP and sigma bands.
If a symbol has no real volume data, the script uses a fallback value so the calculation can still display, but the result should not be interpreted the same way as a true volume-weighted calculation.
For best results, use symbols with reliable volume data.
13. Fill Zones
The indicator can fill the area between the bands.
The center fill helps show the main value area around anchored VWAP.
The upper fill highlights the area above the VWAP between sigma bands.
The lower fill highlights the area below the VWAP between sigma bands.
Users can turn the fill on or off in settings.
14. Alerts
The script includes alert conditions for:
* Price crossing above anchored VWAP
* Price crossing below anchored VWAP
* Price reaching the selected upper sigma band
* Price reaching the selected lower sigma band
Alerts are notifications only. They do not place orders and do not confirm broker execution.
15. How to Use
A practical workflow:
1. Select an anchor mode.
2. Use Manual date if you want to anchor VWAP to a specific event.
3. Use Year, Month, or Week if you want periodic VWAP references.
4. Use Highest high (N) or Lowest low (N) if you want dynamic anchor behavior.
5. Watch the anchored VWAP as the main fair-value reference.
6. Use sigma bands to observe statistical extension from the anchored VWAP.
7. Review +2 and -2 sigma areas as extension zones, not guaranteed reversal zones.
8. Combine the indicator with market structure, volume, support/resistance, trend context, and risk management.
9. Suggested Use Cases
Anchored VWAP Sigma Bands can be useful for:
* Anchored fair value analysis
* Event-based VWAP analysis
* Market cycle reference
* Volume-weighted mean analysis
* Statistical price extension
* Trend pullback context
* Support and resistance context
* Higher-timeframe analysis
* Manual anchor analysis from major highs or lows
17. Important Limitations
This indicator does not predict future price movement.
It does not guarantee reversals.
It does not guarantee continuations.
It does not guarantee profitable trades.
It is not a trading strategy.
It does not place orders.
It does not produce Strategy Tester results.
Anchored VWAP can act as a reference level, but price may move above or below it for extended periods.
Sigma bands show statistical distance, not guaranteed turning points.
Dynamic anchor modes can re-anchor when new highs or lows occur. This is expected behavior.
The quality of the calculation depends on the quality of volume data.
On symbols without reliable volume, the VWAP calculation may be less meaningful.
Users are responsible for their own trading decisions, risk management, and position sizing.
18. Originality and Purpose
Anchored VWAP Sigma Bands combines anchored VWAP analysis with volume-weighted standard deviation bands in a clean chart format.
The script includes:
* Multiple anchor modes
* Manual date anchor
* Periodic anchors
* Dynamic high/low anchors
* Volume-weighted VWAP calculation
* Volume-weighted sigma bands
* Optional anchor marker
* Optional anchor line
* Optional filled zones
* Alerts for VWAP crosses and sigma extension events
The purpose of the indicator is to provide a clear anchored fair-value map and statistical extension zones for chart analysis.
19. Educational Disclaimer
This script is for educational and chart-analysis purposes only. It is not financial advice, investment advice, or a recommendation to buy or sell any financial instrument. Users should perform their own analysis and manage risk independently.
Gösterge

Tomukas Wave VWAP DCA Scalper PRO
A high-probability Gold (XAUUSD) scalping strategy built around trend continuation, momentum confirmation, VWAP positioning, volume pressure, and structured scaling.
What makes this strategy unique is the custom 5-step add-on system:
0.5% → 0.5% → 1% → 2% → 4%
I'm a huge fan of this scaling model because it allows you to stay in quality trades through normal market noise while improving your average entry price. When executed correctly and consistently, this approach has produced exceptionally high win rates during my testing.
The strategy focuses on confirmed entries only:
• Trend aligned setups
• VWAP confirmation
• Momentum confirmation
• Volume confirmation
• Range filter confirmation
• Automatic basket management
• Structured DCA scaling
• Basket TP and protection logic
• Clean chart with zero clutter
Designed primarily for Gold (XAUUSD) on the 5-minute timeframe.
The key is consistency. Follow the rules, trust the process, and avoid emotional decision making. The add-on system is the heart of this strategy and is responsible for much of its edge when used correctly.
If you have questions, ideas for improvements, find bugs, or need help setting it up, feel free to DM me. I'm always happy to talk trading and help where I can.
Good luck and happy trading.
Strateji
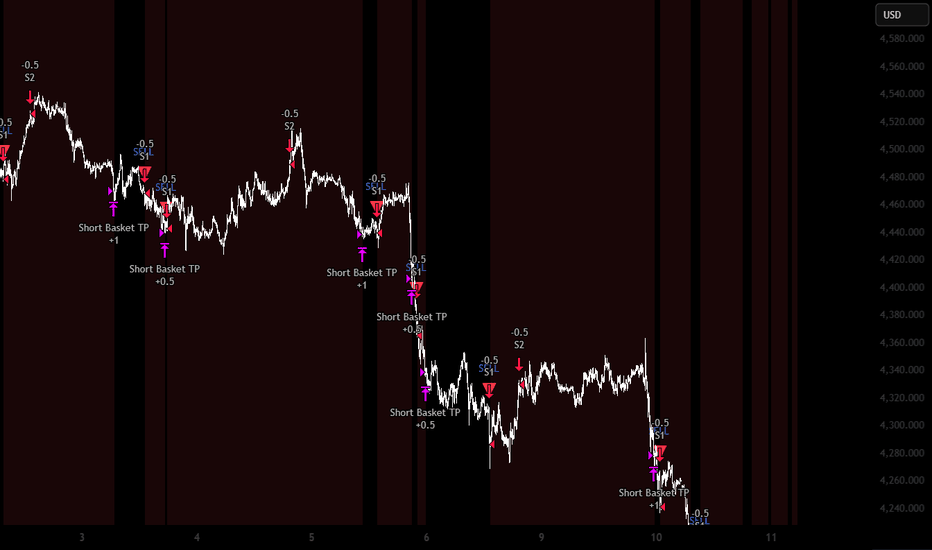
Liquidity Map & Execution Cost# Liquidity Map & Execution Cost
## What this script does
LMX answers three execution questions most indicators ignore: **how expensive is it to get in and out right now, how hard would it be to move size, and where on the chart will price struggle versus travel freely.** It reads only the chart's own price and volume — no symbol is hardcoded, so it runs on any asset and any market (equities, futures, FX, crypto, indices) — and turns the answers into a plain-language trade check: liquidity state, suggested position size, order type, estimated slippage, and a colour-coded map of support, resistance, walls and open gaps.
## Why these components are combined (mashup justification)
This is not several indicators stacked together — it is one liquidity model whose parts each answer a question the others cannot, and they are designed to be read together. Removing any one leaves a specific blind spot:
1. **Cost to cross — effective spread.** Estimated with the EDGE estimator (Ardia, Guidotti & Kroencke 2024) from open/high/low/close, cross-checked against Abdi-Ranaldo (2017) and Corwin-Schultz (2012). This tells you the round-trip cost of entering, which spread-blind tools cannot show. Alone, it says nothing about moving size or about levels.
2. **Cost to move size — price impact.** The Amihud (2002) illiquidity ratio with a high-low refinement, plus a rolling Kyle (1985) lambda computed as a true regression slope. This tells you how far your own order would push price — the question that matters for sizing, and one a spread estimate cannot answer.
3. **Direction of pressure — order imbalance.** A close-location signed-volume imbalance and its persistence. This tells you which side is leaning now, adding direction that the cost measures lack.
4. **The spatial map — volume at price.** A time-decay-weighted, range-distributed volume profile that yields the Point of Control and Value Area (standard 70% method), rendered as directional zones: green support below price, red resistance above, solid = a wall price struggles at, faint = an open gap price slides through. This converts the abstract cost/impact numbers into *locations* on the chart.
5. **Anchored VWAP — fair value.** A volume-weighted average anchored to your chosen reference (last major swing by default; or session/week/month open, or the highest-volume bar), drawn as a trend-coloured line. It is the dynamic counterpart to the static profile: where the average participant is positioned, and whether price is rich or cheap versus that.
Together they form one decision: the spread and impact set the **cost and size**, the imbalance and VWAP set the **direction and fair value**, and the map sets the **location** — so the output is "trade full size with market orders, buyers in control, room to run up to the gap above," not five separate readings.
## How a reading is produced
Each estimator is normalised to a percentile of its own history so thresholds adapt to every symbol and timeframe. The inverted spread, inverted impact and depth combine into a 0–100 **Liquidity Score**, classified as Deep / Normal / Thin / Stressed (a sudden impact spike forces Stressed). The score drives the suggested size multiplier, the order-type advice and the slippage estimate. The map is rebuilt on the last bar from the volume-at-price profile.
## How to use it
- Apply to any symbol. Set the price source and, if you trade very low intraday timeframes, optionally fix the calc timeframe (e.g. Daily) so the spread estimators stay stable. On symbols without real volume the volume modules disable automatically and the score leans on the spread estimators (the panel shows "price-only").
- **Simple mode (default)** gives plain-language guidance: Liquidity, Trade cost, Pressure, Position size, Orders, Watch-out, Fair value, and a one-line verdict. **Pro mode** exposes the full readout (spread in bps, Amihud and Kyle percentiles, depth, imbalance, flow persistence, value-area levels).
- On the chart: trade toward green support, expect resistance at red, size down where the map is thin (price moves fast there), and read the trend-coloured fair-value line for rich/cheap context.
- Alerts: liquidity-state change and sudden liquidity withdrawal.
## Originality
The combination is the original contribution: a single overlay that fuses low-frequency **spread**, **impact** and **imbalance** estimators with a **time-decay, range-distributed volume profile** and an anchored fair-value line, then translates all of it into sizing/order/slippage decisions in plain language. The building blocks are public-domain methods (EDGE, Abdi-Ranaldo, Corwin-Schultz, Amihud, Kyle, volume-profile Value Area, anchored VWAP), each used for the specific job described above and cited in the script header.
## Limitations (please read)
- These are **low-frequency estimators** of quantities normally measured from quote/tick data. They approximate — they do not measure — the true spread, depth, or dealer book.
- Volume-based modules require a real volume feed; they disable on symbols without one.
- Spread estimators were validated on daily-type bars; on very fast intraday timeframes they are noisier — use the calc-timeframe option if needed.
- The on-panel statistics are computed on the loaded chart history.
- This is an analysis tool, **not financial advice.** Test before use and trade at your own risk.
Gösterge

VWAP & Dual MA Ribbon Tracker ProThe Master Trigger Breakdown
* For Longs (Green): The 4 EMA must be above the VWAP. If the 4 EMA is below the VWAP, a long trade is completely blocked, no matter how bullish the rest of the chart looks.
* For Shorts (Red): The 4 EMA must be below the VWAP. If the 4 EMA is above the VWAP, a short trade is completely blocked.
The Complete Logic Chain (How it fits together)
Your indicator only gives a trading color when all three layers of your rules agree with that master trigger:
1. The Structural Trigger: Is the 4 EMA on the correct side of VWAP? (Above for Long / Below for Short)
2. The Momentum Confirmation: Is the 4 EMA accelerating away from the 9 EMA? (Above 9 EMA for Long / Below 9 EMA for Short)
3. The Institutional Force: Is the Elder Force Index (EFI) confirming the volume pressure? (Above 0 for Long / Below 0 for Short)
If any single one of these three layers disagrees, the master trigger pulls the plug and forces the ribbon to stay Blue (No Trading).
How the ATR Cushion Protects Your NASDAQ Trades
In the script, the ATR calculation creates a dynamic "buffer zone" around the VWAP and the 9 EMA.
* For Longs (Green): The 4 EMA can’t just be a fraction above the VWAP and 9 EMA. It must clear both of them by a margin of 0.2 * ATR.
* For Shorts (Red): The 4 EMA must drop below the VWAP and 9 EMA by a margin of 0.2 * ATR.
Why This Asset-Specific Math is Important
The NASDAQ's range changes drastically throughout the day.
* At 9:30 AM EST (NY Open): The market is highly volatile. The ATR expands because the bars are large. The indicator automatically widens the cushion so you don't get trapped by massive, wild price swings.
* At 1:00 PM EST (Lunch Hour): The market slows down. The ATR shrinks because the bars are small. The indicator automatically tightens the cushion so you can still catch a genuine, breakout move if it happens.
How to Tune It in Your Settings
If you feel the indicator is reacting perfectly but missing the exact start of a move, you can adjust the ATR Multiplier Cushion input:
* Lower it to 0.1: Makes the indicator more aggressive, giving you faster entries but a slightly higher risk of a false signal.
* Raise it to 0.3: Makes the indicator more conservative, filtering out more noise but delaying your entry.
* Turn it off: Uncheck the "Use ATR Cushion Filter" box in your settings to see the pure EMA rules without any volatility buffer.
Volume
This upgraded system swaps out rigid, raw volume for the Elder Force Index (EFI). Instead of blindly measuring how many shares were traded, the indicator now calculates true institutional momentum by multiplying volume against net price direction. This ensures you get highly accurate signals on the NASDAQ without missing trades during steady, trending moves.
Visual Layout & Interface
* Upper Main Chart: Your candles, the VWAP line, the 4 EMA, and the 9 EMA remain active here to map structure.
* Lower Separate Panel: Houses your solid color-blocked ribbon, updating instantly as the trend and market force align.
The 3 Market States & Color Codes
* 🟩 SOLID GREEN (Premise to Go Long)
* The Structural Rule: The 4 EMA is above the VWAP AND above the 9 EMA (plus your ATR cushion).
* The EFI Filter: The 13 or 2-period smoothed Elder Force Index must be above 0.
* Market Context: Buyers are in absolute control. The trend has broken out, and it is actively backed by positive institutional buying power.
* 🟥 SOLID RED (Premise to Go Short)
* The Structural Rule: The 4 EMA is below the VWAP AND below the 9 EMA (minus your ATR cushion).
* The EFI Filter: The 13 or 2 setting-period smoothed Elder Force Index must be below 0.
* Market Context: Sellers are dominant. Price is aggressively pushing lower, backed by true institutional distribution force.
* 🟦 SOLID BLUE (No Trading / Neutral Zone)
* The Rule: Triggered if the EMAs conflict OR if the EFI doesn't match the price direction (e.g., the 4 EMA pushes up, but EFI is below 0).
* Market Context: Weak, diverging, or manipulative market action. This protects your capital by sidelining you when the NASDAQ is trying to trap retail breakout buyers.
Gösterge
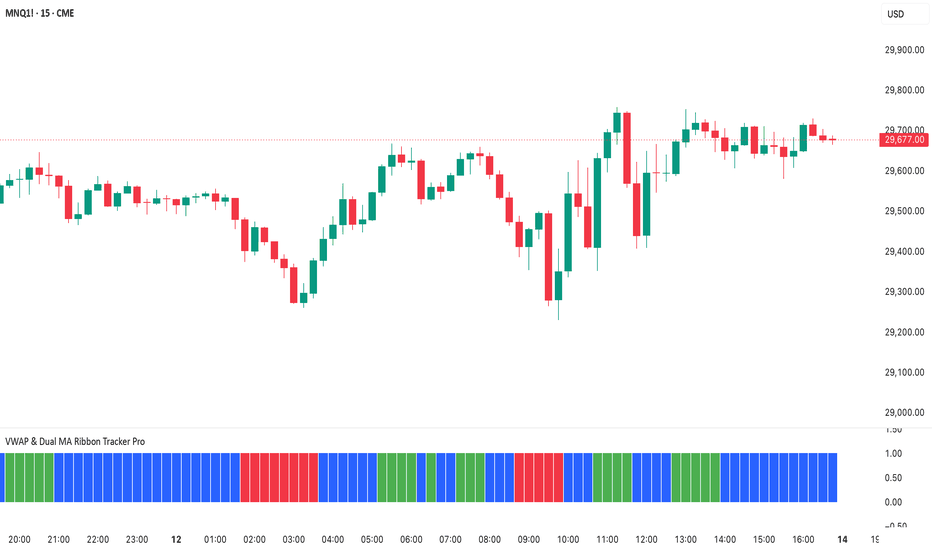
Gösterge

Gösterge

Gösterge