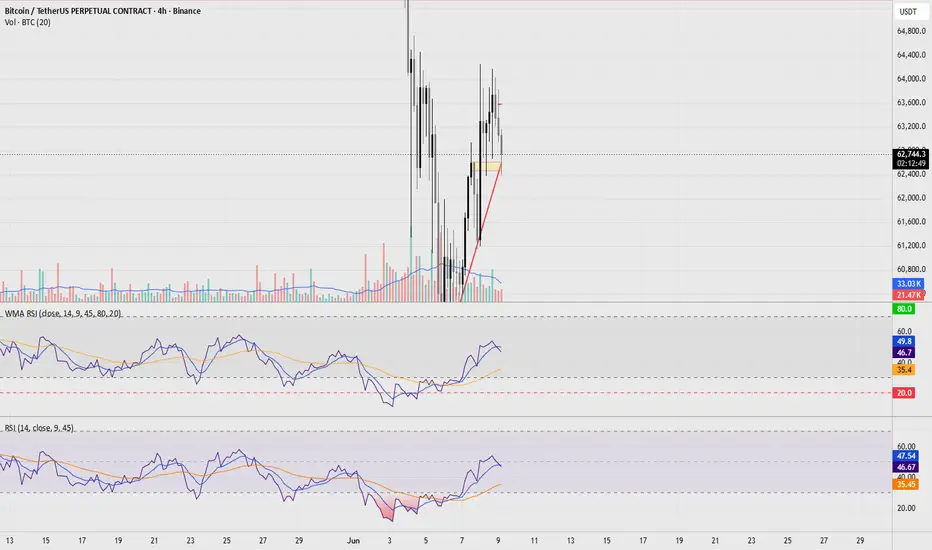
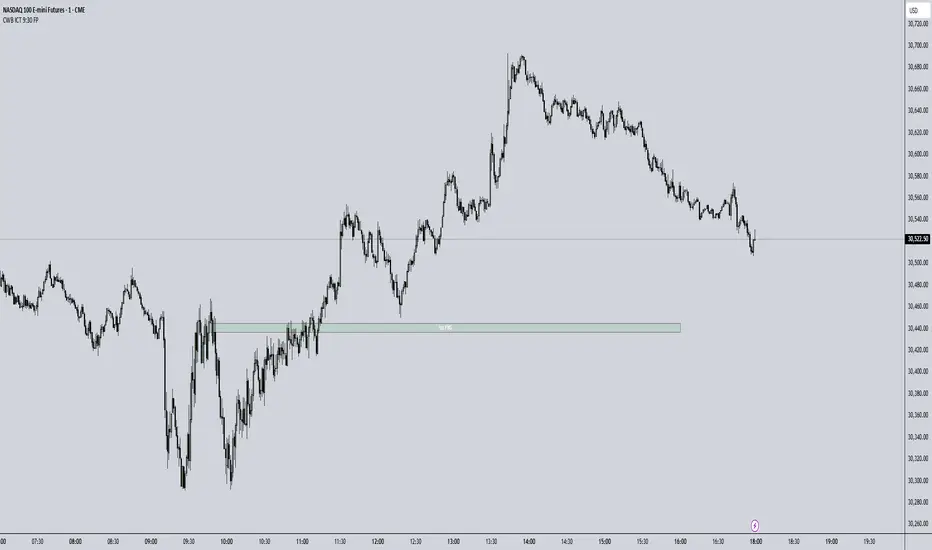
Institutional Fibonacci + Elliott WaveInstitutional Fibonacci + Elliott Wave — Indicator Description
Overview
This indicator combines three powerful technical analysis tools into a single overlay: Fibonacci retracement/extension levels, Elliott Wave detection, and a Volume Point of Control (POC) line. It is designed to help traders identify high-probability entry zones, validate wave structure, and project take-profit targets with institutional-grade precision.
Core Components
1. Fibonacci Retracement & Extension Levels
The indicator automatically detects the most recent confirmed swing high and swing low using a configurable pivot length, then draws the full Fibonacci grid from that range.
Retracement levels (entry/pullback zones):
0.236, 0.382, 0.500, 0.618 (Golden Ratio), 0.705 (Institutional), 0.786 (Deep), 0.886 (Extreme)
Extension levels (take-profit targets):
1.000 (TP1 — equal move), 1.272 (TP2 — Wave 3 target), 1.618 (TP3 — Golden Extension), 2.000 (TP4), 2.618 (TP5)
The Golden Zone (0.618–0.786) is highlighted with a shaded box — historically the highest-probability reversal area in trending markets. A TP1 zone box is also drawn around the 1.000 extension.
Direction is set automatically: if the most recent confirmed pivot was a high, the grid is drawn bullish (low → high); if a low, it draws bearish (high → low). Every level includes an optional price label and percentage distance from the 0.618 entry.
2. Elliott Wave Detection
The indicator scans recent pivot history for a valid 5-wave impulse pattern, applying the three core Elliott Wave rules:
Wave 2 never retraces beyond the start of Wave 1
Wave 3 is never the shortest impulse wave
Wave 4 does not overlap Wave 1's price territory
When a pattern is confirmed, it draws labeled wave points (W1–W5) connected by colored lines — solid cyan for impulse waves, dashed orange for corrective waves. It also projects forward targets:
W5 Min / W5 Max — expected completion range for Wave 5
ABC-C — the likely endpoint of the subsequent corrective wave
Both bullish and bearish impulse structures are detected.
3. Point of Control (POC)
The POC line marks the price level with the highest traded volume over a configurable lookback window (default: 300 bars). It is calculated by dividing the price range into buckets and finding the bucket with the most cumulative volume — similar to a simplified volume profile.
The POC acts as a strong support/resistance magnet. Price tends to revisit and consolidate around it, making it useful for:
Confirming Fibonacci entry zones when POC aligns with the 0.618–0.786 area
Identifying likely reversal points if price is extended far from POC
4. Information Table
A compact on-chart table (position configurable) displays:
All 7 key price levels (0.618 entry through 2.618 TP5) with current prices and % move from the 0.618 entry
Elliott Wave phase status (Scanning / Bullish Impulse / Bearish Impulse)
Wave rule validation confirmation
How to Use It
Entering a trade:
Watch for price to pull back into the Golden Zone (0.618–0.786). If the POC line sits inside or near that zone, confluence is strong. Look for a reversal candle or momentum confirmation before entering.
Setting targets:
Use the extension levels from the table as a tiered take-profit plan — partial exit at TP1 (1.000), scale out at TP2 (1.272), and let runners run toward TP3 (1.618) or beyond.
Elliott Wave confluence:
If the indicator detects a bullish impulse and you are entering near the Wave 4 zone (between W3 and W4 labels), the W5 Min/Max projections give you a forward price target range that aligns with the extension levels.
Alerts:
Five built-in alerts are available — Golden Zone entry, TP1/TP2/TP3 hits, Elliott Wave confirmation, and a POC touch — configurable directly from TradingView's alert system.
Key Settings
Setting Default Notes Pivot Swing Length21Higher = fewer, more significant swings EW Pivot Length21Match to Swing Length for consistency POC Lookback300 bars Increase for longer-term POC Price Buckets200Higher = more precise POC, heavier CPU load Show Golden Zone On Recommended to leave on Show % from Entry On Shows distance from 0.618 for each level
Best Practices
Works on any timeframe and instrument (stocks, forex, crypto, futures)
Higher timeframes (4H, Daily) produce more reliable pivot detections
Elliott Wave detection is most reliable in trending, impulsive markets — use with caution in choppy, ranging conditions
Confluence of a Fibonacci level + POC + Elliott Wave count is the strongest signal this indicator can produce Gösterge

Gösterge
Gösterge

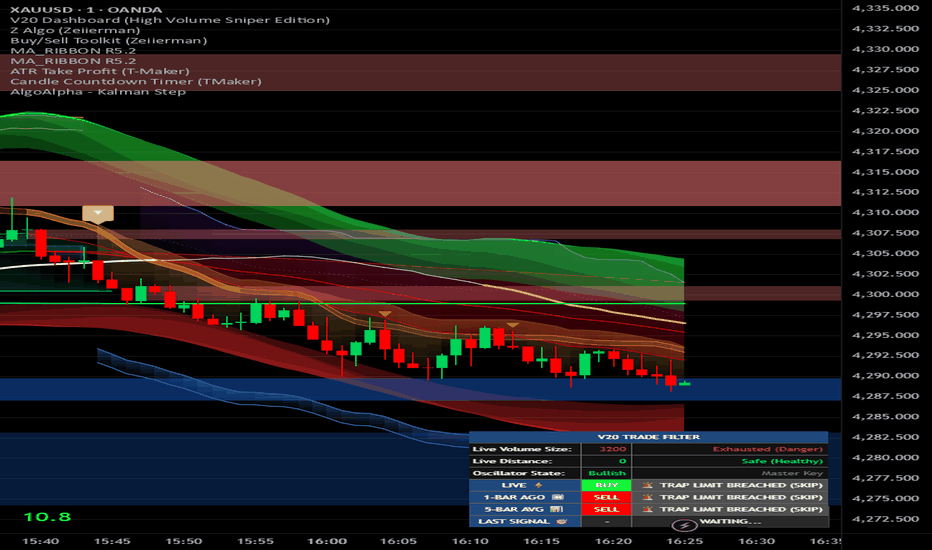
V20 Dashboard (High Volume Sniper Edition)Overview
The V20 Dashboard is a mathematically driven Trap Filter and Signal Management system. Designed for high-volume traders, it abandons traditional "indicator stacking" methods that often lure retail traders into market maker traps. Instead, it measures raw oscillator exhaustion and momentum extension to surgically filter out low-probability trades and highlight high-probability "Sniper" entries.
While it is heavily optimized to work alongside custom volume or momentum oscillators and signal algorithms, its input architecture allows it to use any user-defined data sources.
⚙️ The Core Mechanisms
The script relies on three primary calculations to evaluate market safety in real-time. It reads the raw data lines on your chart and converts them into actionable "Safe" or "Trap" evaluations.
1. The Exhaustion Filter (Volume/Oscillator Size Cap)
When momentum spikes too violently in a single candle, the move is often exhausted. Market makers use these massive spikes to trap breakout traders before aggressively reversing the price.
Mechanism: The script measures the exact physical body size of your input source (e.g., Primary Oscillator Open to Close). If that size exceeds your Size Cap, it immediately flags the setup as an Exhaustion Trap and warns you to skip the trade.
2. The Rubber Band Filter (Distance Cap)
Price and momentum act like a rubber band attached to a baseline. If the data stretches too far away from its baseline, it is destined to snap back violently, hitting tight stop losses.
Mechanism: The script measures the absolute distance between your primary data source (Primary Oscillator Close) and a secondary moving average (Confirmation Line). If this distance exceeds your Distance Cap, it flags the setup as an Overextended Trap.
3. The Master Key (Zero-Trap State Alignment)
Mechanism: The script checks if the physical direction of the current oscillator candle (Bullish/Bearish) perfectly matches the direction of your Buy/Sell signal. When these dynamically align while remaining under the size/distance caps, the dashboard upgrades your signal to a 🔥 SNIPER ENTRY.
📊 Understanding the Dashboard UI
The on-chart table provides a complete, top-to-bottom view of market safety:
Live Metrics (Rows 1-3): Displays the raw mathematical data for Oscillator Size, Distance, and the Current State (Bullish/Bearish). Metrics turn green if safe, and red if a limit is breached.
LIVE ⚡ (Row 4): Evaluates the exact current moment.
🔥 SNIPER ENTRY: Size and Distance are safe, and the state alignment is perfect.
🟢 STANDARD ENTRY: Size and Distance are safe, but state alignment is neutral. (Safe to trade).
🚨 TRAP LIMIT BREACHED: A size or distance cap is broken. High risk of immediate reversal.
1-BAR AGO ⏪ (Row 5): Displays the exact dashboard state from one candle ago. Highly useful for evaluating signals that fired exactly on the previous close.
5-BAR AVG 📊 (Row 6): Prevents fakes from single erratic candles by calculating momentum over the last 5 bars. It averages the size, averages the distance, and uses a "Majority Vote" to determine the smoothed trend direction.
LAST SIGNAL 🎯 (Row 7): The "Memory Lock." When your custom Buy/Sell signal actually fires, the dashboard freezes the exact market conditions at that exact second. It allows you to look back at the chart and see precisely why a previous trade was skipped or taken.
🔧 Settings & Configuration Guide
1. Data Sources
Connect the script to your chart data here.
Select Primary Oscillator (Open/Close): Route this to your primary volume, delta, or momentum indicator.
Select Confirmation Line (MA): Route this to your specific baseline or moving average trend indicator.
2. Signal Triggers
The universal checkbox system. Check the boxes (Buy 1, Sell 1, etc.) and link them to your external signal provider. The "LAST SIGNAL" memory lock will stay asleep until one of these inputs triggers.
3. V20 Trap Limits
Max Size (Exhaustion Trap Limit): The absolute maximum oscillator body size allowed before a trade is considered exhausted. (Default: 2.80).
Max Distance (Rubber Band Trap Limit): The maximum distance allowed between your primary oscillator and your confirmation line. (Default: 16.0).
4. UI Settings
Customize the position (Top Right, Bottom Left, etc.) and the text size of the dashboard to fit your screen perfectly.
5. Alert Settings
Instead of alerting you on useless line crosses, the alerts are actionable and tier-based:
Alert on 🔥 SNIPER ENTRY: Pings when a perfect alignment, zero-trap setup appears.
Alert on 🟢 STANDARD ENTRY: Pings when a safe, high-probability trade fires.
Alert on 🚨 TRAP BREACH: Pings when a signal fires but limits are breached (useful for actively monitoring avoided losses).
⚠️ Risk Disclaimer
Please Note: This indicator is intended strictly as an analytical guide and educational tool. It does not constitute financial or investment advice. Trading financial markets carries a high level of inherent risk, and no mathematical filter or indicator can guarantee future results or eliminate losses. The risk of trading is entirely your own, and you are solely responsible for your own trading decisions, entries, exits, and risk management. Always manage your capital responsibly. Gösterge
Empirical Mode Decomposition Trend Helix [forexobroker]Empirical Mode Decomposition Trend Helix applies a simplified EMD sift to separate price into a trend residual and a high-frequency intrinsic mode (IMF1). Rather than relying on a fixed-length moving average, the trend is built from the mean of local upper and lower envelopes, then re-sifted for smoothness. Trade signals fire only when the high-frequency component crosses zero in the direction of the larger trend slope. The unique angle is bringing a Huang-style adaptive decomposition concept into Pine using rolling extrema as a tractable envelope proxy.
🔶 ALGORITHM
1. Take rolling local maxima and minima of close over the extrema window (default 10) using highest/lowest.
2. Smooth each into an upper envelope and a lower envelope by SMA of the envelope smoothing length (default 5).
3. Mean envelope m_t = (upper + lower) / 2 is the trend residual for this iteration.
4. Repeat the sift the configured number of iterations (default 2), using the previous m_t as the input each round.
5. IMF1 (high-frequency component) = close minus the final trend.
6. Slope of the trend over the slope lookback (default 5 bars) defines direction; bullish if slope greater than zero (plus min-slope threshold), bearish if less than minus the threshold.
7. Signals: IMF1 zero-crossings aligned with trend direction.
🔶 SIGNAL LOGIC
- Buy: IMF1 crosses above zero AND trend slope is positive AND position is not already long AND session filter passes AND cooldown bars elapsed AND barstate.isconfirmed.
- Sell: IMF1 crosses below zero AND trend slope is negative AND position is not already short AND session filter passes AND cooldown bars elapsed AND barstate.isconfirmed.
Cross-direction confirmation prevents trading mean-reversion bounces against the underlying trend residual.
🔶 INPUTS
- EMD Sift group: extrema window default 10, envelope smooth default 5, sift iterations default 2, slope lookback default 5.
- Signal Logic group: cooldown bars default 15, min slope (price units) default 0.
- Filters group: session restriction default 0000-2400.
- Visual group: show trend helix, dashboard, 3-layer glow, helix gradient colors, buy/sell colors, dashboard background.
🔶 ALERTS
EMD Buy, EMD Sell, EMD Any Signal, EMD IMF1 Up, EMD IMF1 Down, EMD Trend Turn Up, EMD Trend Turn Dn, EMD Big Excursion, EMD Close Over, EMD Close Under, EMD Webhook JSON.
🔶 LIMITATIONS
- This is a simplified EMD: rolling extrema and SMA envelopes are not the cubic-spline envelopes of formal Huang EMD; expect smoother but less curvature-aware decomposition.
- The sift uses fixed iterations rather than a stoppage criterion, so it does not guarantee a true zero-mean IMF.
- Trend slope is a local linear estimate; long pauses or gaps can flip the slope sign transiently.
- The envelope smoothing introduces lag of roughly half the envelope window into the trend output.
- Signals require simultaneous IMF zero-cross and slope alignment, so during sideways markets the indicator will be quiet by design.
Gösterge

Gösterge

Gösterge

Gösterge

Open Price Custom % Levels**Open Price % Levels With Session Gap**
This indicator plots the session opening price and automatically calculates percentage-based levels above and below it.
### Features
* Session Opening Price Line
* +0.5%, +1%, +2%, +2.5%, +3% Levels
* -0.5%, -1%, -2%, -2.5%, -3% Levels
* Customizable line colors and thickness
* Session-based plotting with automatic daily reset
* No line connection between trading sessions (clean session gaps)
* Works on all markets and timeframes
Useful for identifying key percentage expansion and retracement zones relative to the session open, helping traders track intraday price movement and potential reaction levels.
**Best suited for:** Index, Forex, Gold, Crypto, and Intraday Trading.
Gösterge

Open Price % Levels With Session Gap by SMTThis indicator plots the session opening price and automatically calculates percentage-based levels above and below it.
Features
Session Opening Price Line
+0.5%, +1%, +2%, +2.5%, +3% Levels
-0.5%, -1%, -2%, -2.5%, -3% Levels
Customizable line colors and thickness
Session-based plotting with automatic daily reset
No line connection between trading sessions (clean session gaps)
Works on all markets and timeframes
Useful for identifying key percentage expansion and retracement zones relative to the session open, helping traders track intraday price movement and potential reaction levels.
Best suited for: Index, Forex, Gold, Crypto, and Intraday Trading. Gösterge

C-Delta Exhaustion DashboardHere is a professional, highly detailed, and compelling description you can copy and paste directly into TradingView when you publish your script.
It explains the math, the strategy, and exactly how users should set it up.
Title: C-Delta Exhaustion Dashboard
Description:
Are you catching a falling knife, or are you entering at the exact moment of exhaustion?
Trading reversal signals on lower timeframes (like the 1-minute chart) requires immense precision. The most powerful tool for confirming a reversal is Cumulative Delta (C-Delta), but trying to manually "eyeball" the exact difference between the Open and Close of a tiny delta candlestick in real-time is nearly impossible.
The C-Delta Exhaustion Dashboard solves this problem. It is a sleek, non-intrusive, real-time tracking panel that calculates the exact mathematical body size of your Cumulative Delta, out to 6 decimal places.
Based on a quantitative analysis of over 600+ mechanical reversal signals, this dashboard doesn't just show you numbers—it actively warns you when the market is setting up for an explosive, 100+ pip reversal.
🌟 Core Features:
Real-Time Delta Body Calculation: Instantly calculates the exact volume shift (C-Delta Close minus C-Delta Open) of the live bar.
Historical Context (Last 4 Bars): Displays the previous 4 minutes of delta data so you can visually track the buildup or exhaustion of order flow leading up to your entry.
Smart Visual Alerts: The live cell will flash Solid Yellow the exact moment the Delta body size enters the mathematically proven "Explosive Win" threshold zones, signaling a highly probable reversal.
Color-Coded Momentum: Bright green text/background for positive (Bullish) delta shifts, and bright red for negative (Bearish) delta shifts.
Fully Customizable UI: Change the position (Top/Bottom/Left/Right), adjust the text size, or tweak the background opacity so it perfectly fits your chart without blocking price action.
🧠 The Strategy: How to Trade the Dashboard
This dashboard is designed to separate "Traps" from "Home Runs" when taking reversal signals.
1. Taking BUY Signals (Hunting Bearish Exhaustion)
When looking for a bottom reversal, you want to see the sellers running completely out of gas.
❌ The Trap: If a Buy signal fires but the Live Bar on the dashboard is printing a massive, heavy red number (e.g., -0.00040), stay out. The selling pressure is still too aggressive.
✅ The Explosive Setup: If a Buy signal fires and the Live Bar is printing a tiny, shrinking red number, or has just barely ticked green (e.g., -0.00010 to +0.00015), enter the trade. The sellers are completely exhausted, leaving a vacuum for the price to rip upwards. (The dashboard will flash yellow when this happens!)
2. Taking SELL Signals (Hunting Bullish Blow-Off Tops)
When looking for a top reversal, the math is actually the opposite. You want to see buyers throwing everything they have at a brick wall.
❌ The Trap: If a Sell signal fires but the Live Bar is printing a tiny red or flat number, stay out. The buyers are just resting; they haven't climaxed yet.
✅ The Explosive Setup: If a Sell signal fires and the Live Bar is printing a massive, thick green number (e.g., +0.00025 to +0.00039), enter the trade. This is a volume blow-off top. Buyers have exhausted their liquidity, and the price is about to collapse. (The dashboard will flash yellow when this happens!)
⚙️ Setup Instructions (IMPORTANT):
Because this is a secondary dashboard, it requires an active Cumulative Delta indicator to be on your chart.
Add this script to your chart.
Open the Settings (Gear Icon) for the Dashboard.
Under the "Data Sources" inputs, click the dropdowns and select the Open and Close outputs from your preferred Cumulative Delta indicator.
Adjust the Alert Thresholds to fit your specific asset and timeframe! (The default thresholds are mathematically optimized for XAUUSD on the 1-minute chart).
Trade smart, trust the data, and stop guessing at exhaustion. Gösterge

Gösterge

Entropic Regime Field [JOAT]Entropic Regime Field is an open-source market state classifier that uses three quantitative measures — Fractal Efficiency Ratio, a synthetic Hurst Exponent approximation, and a Garman-Klass volatility estimator — to classify each bar into one of three entropy states: LOW (predictable, directional structure present), TRANSITION (regime shift underway), and HIGH (chaotic, low-predictability environment). Directional signals from an Adaptive Momentum Oscillator are filtered to fire only during LOW entropy states, where momentum signals have historically more reliable edge than during random or chaotic market behavior.
The foundational premise is that markets alternate between periods of organized directional behavior and periods of disorganized random movement. Trading momentum signals indiscriminately across both environments degrades overall performance because the same signal that has edge in a trending market produces random outcomes in a chaotic one. By measuring the structural organization of price movement directly — rather than relying on ADX alone, which is a lagging momentum derivative — Entropic Regime Field attempts to identify when the market's behavior is organized enough for directional signals to have context.
Core Concepts
1. Fractal Efficiency Ratio (FER)
The FER measures how efficiently price has moved over a lookback period — the ratio of the net directional distance to the total path length of individual bar-to-bar changes. A value near 1.0 indicates straight-line directional movement; a value near 0.0 indicates constant reversals:
float ferNet = math.abs(close - close )
float ferPath = math.sum(math.abs(ta.change(close)), ferLen)
float ferVal = ferPath > 0.0 ? ferNet / ferPath : 0.0
2. Synthetic Hurst Exponent
The Hurst Exponent characterizes the memory of a time series. Values above 0.5 indicate persistence (trending), values near 0.5 indicate randomness, and values below 0.5 indicate anti-persistence (mean-reversion). A simplified Hurst estimate is computed using the variance ratio method:
float var1 = ta.variance(ta.change(close, 1), hurstWindow)
float var5 = ta.variance(ta.change(close, 5) / 5, hurstWindow)
float hurstEst= 0.5 * math.log(var1 / var5) / math.log(5) + 0.5
3. Garman-Klass Volatility Estimator
Standard ATR uses only the prior close and current high/low. The Garman-Klass estimator uses all four OHLC prices, producing a more statistically efficient estimate of true volatility:
gkBar = 0.5 * math.pow(math.log(high / math.max(low, syminfo.mintick)), 2.0)
- (2.0 * math.log(2.0) - 1.0) * math.pow(math.log(close / math.max(open, syminfo.mintick)), 2.0)
The GK estimate is averaged over a configurable period and normalized to a 0-100 percentile rank over the trailing 100 bars.
4. Three-Factor Entropy Classification
LOW entropy requires FER above a threshold AND ADX above a minimum AND Hurst estimate above 0.52. HIGH entropy is triggered when FER falls below a lower threshold OR ADX falls below a minimum. TRANSITION is the state between the two.
5. Adaptive Momentum Oscillator (AMO)
The AMO blends three momentum inputs with fixed weights: RSI(14) centered at 50 (40%), Stochastic(14) centered at 50 (35%), and Williams Percent Range(14) centered at -50 (25%). Directional signals fire only in LOW entropy when AMO crosses zero and KAMA confirms via crossover/under.
Features
Fractal Efficiency Ratio: Net directional move divided by total path length, configurable lookback
Synthetic Hurst Exponent: Variance ratio approximation identifying persistent vs. anti-persistent price behavior
Garman-Klass volatility: OHLC-based volatility estimator normalized to percentile rank over 100 bars
Three entropy states: LOW, TRANSITION, HIGH — each with distinct visual treatment
10-line entropy ribbon: EMA lines colored by entropy state for visual history of regime transitions
Adaptive Momentum Oscillator: RSI + Stochastic + WPR composite with fixed optimal weights
Entropy-gated signals: AMO + KAMA confirmation signals fire only in LOW entropy state
Regime background tint: Background tinted by entropy state, cleared after 10 bars
Trade block on signal: ATR-based TP and stop rendered as boxes on signal bars
12-row institutional dashboard: FER, Hurst estimate, GK volatility percentile, ADX, AMO, entropy state, signal, win rate, bars in current state
Non-repainting: All signals gated by barstate.isconfirmed; no future data referenced
Four color themes: Phantom, Neon, Classic, Solar
Input Parameters
Fractal Efficiency:
FER Lookback (default: 14)
LOW Entropy FER Minimum (default: 0.60)
HIGH Entropy FER Maximum (default: 0.35)
Hurst Exponent:
Hurst Window (default: 20)
LOW Entropy Hurst Minimum (default: 0.52)
Garman-Klass Volatility:
GK Averaging Length (default: 14)
ADX Gate:
Min ADX for LOW Entropy (default: 22)
Signal:
AMO Cross Threshold, KAMA Period, Cooldown Bars
TP ATR Multiple, SL ATR Multiple
How to Use This Indicator
Step 1: Read the Entropy State
Check the dashboard. LOW entropy means the market is behaving in an organized, directional way — this is when momentum signals carry more weight. HIGH entropy means the market is chaotic — avoid directional signals.
Step 2: Watch FER and Hurst Together
FER and Hurst are independent measures of market organization. When both agree (high FER AND Hurst > 0.52 simultaneously), the LOW entropy classification is more reliable.
Step 3: Enter on AMO + KAMA Confirmation
Signals fire only when the AMO crosses zero in the signal direction AND price crosses the KAMA level simultaneously. Both conditions must occur on the same confirmed bar in a LOW entropy environment.
Indicator Limitations
The Hurst approximation via variance ratio is a simplified estimate. It should be treated as a directional indicator of persistence, not a precise statistical measure
The FER computation on every bar may affect chart loading performance for very long lookback periods on large datasets
LOW entropy classifications can persist during slow grinding trends that produce high FER but low volatility. These environments may produce signals with narrower ATR-based targets
The GK estimator can return unreliable values when open equals close (as occurs on some synthetic instruments or during gaps)
This indicator classifies entropy state. It does not predict how long the state will persist or when it will change
Originality Statement
The combination of Fractal Efficiency Ratio, synthetic Hurst Exponent via variance ratio, and Garman-Klass volatility estimator as a three-factor entropy classification system gating AMO momentum signals is not replicated in any existing open-source Pine Script v6 publication as of this writing
The Garman-Klass estimator as a volatility input provides a more statistically efficient OHLC-based volatility measure that captures intraday range information not available in ATR
Gating a composite three-input momentum oscillator by an entropy state derived from completely different mathematical principles (efficiency, persistence, and OHLC volatility) rather than using a single lagging derivative like ADX as the sole filter is an original analytical architecture
Disclaimer
This indicator is provided for educational and informational purposes only. It is not financial advice. Trading involves substantial risk of loss. Entropy classifications are approximations based on historical price data and do not guarantee future market behavior will repeat. The Hurst approximation used is a simplified estimate, not a statistically rigorous computation. Past win rates do not predict future performance. The author accepts no responsibility for trading losses resulting from use of this indicator.
Made with passion by jackofalltrades
Gösterge

Gösterge

PI Radius Energy (PRE)# PI Radius Energy (PRE)
PI Radius Energy (PRE) is a momentum and volatility fusion engine designed to transform traditional ATR data into a dynamic circular energy model.
Instead of treating ATR as a simple volatility measurement, PRE interprets ATR as a radius and converts it into an energy field using the mathematical relationship of a circle:
π × r²
This approach allows market volatility to be expressed as an expanding or contracting energy field rather than a linear value. The resulting energy is then combined with OBV momentum flow, creating a unique representation of market participation, pressure, and directional strength.
The core objective of PRE is not to chase trends after they have already developed, but to identify the moments when energy begins to build beneath the surface. By combining circular volatility expansion, volume flow acceleration, squeeze detection, and momentum confirmation, PRE attempts to highlight areas where market energy is transitioning from compression to expansion.
### Main Components
• PI Radius Engine (πr² volatility model)
• OBV Momentum Flow Integration
• Dynamic Energy Normalization
• Squeeze Compression Detection
• Energy Trend EMA Filter
• ATR Rank & Volume Rank Validation
• Momentum Z-Score Filtering
• 3D Aura Visualization
• Early Bottom Detection Pills
• Bullish Confirmation Signals
### How to Read PRE
**Green Aura**
* Energy is above its average.
* Market pressure is expanding.
* Bullish conditions are strengthening.
**Red Aura**
* Energy is below its average.
* Market pressure is weakening.
* Bearish conditions are dominant.
**Green Pills**
* Early signs of energy expansion.
* Potential transition from compression to movement.
* Designed to appear before major momentum phases whenever possible.
**Yellow Confirmation Pills**
* Additional confirmation that energy has crossed into a stronger bullish state.
**Purple Energy Trend Line**
* Long-term energy trend.
* Helps distinguish temporary spikes from sustained energy expansion.
### Philosophy Behind PRE
Most indicators measure price.
Some indicators measure volume.
PRE attempts to measure something different:
**Market Energy.**
By transforming volatility into a circular energy field and combining it with volume-driven momentum, PRE seeks to provide a different perspective on trend development, accumulation, expansion phases, and emerging directional pressure.
PRE is not intended to predict the future. Instead, it is designed to visualize how market energy evolves, contracts, and expands over time, helping traders identify potential opportunities before they become obvious to the broader market.
Gösterge

Gösterge

Gösterge

Gösterge

Gösterge

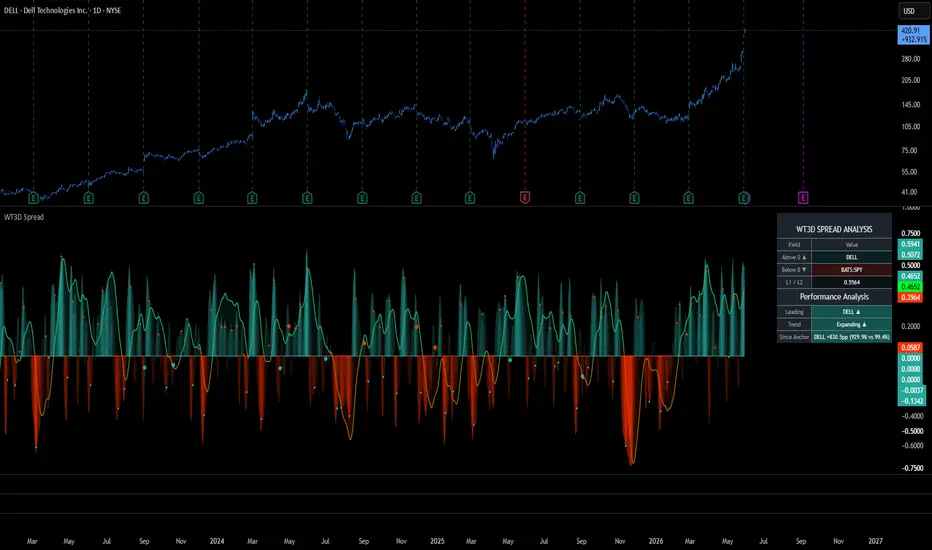
WT3D SpreadWT3D measures momentum on one asset. WT3D Spread measures relative momentum between two — and that's a different signal entirely. Set any second symbol as your reference; the oscillator runs on the spread between the chart and that reference. NVDA/SPY shows when NVDA is outpacing the market. GDX/GLD shows when miners are leading gold. Altcoin/BTC shows when an alt is decoupling. Same WT3D engine, different question.
Watchlist workflow: leg 1 follows the chart, leg 2 stays pinned. Arrow through your list and watch each name update against your fixed reference in succession.
Built on jdehorty's open-source WaveTrend 3D — full credit chain in the description (jdehorty, LazyBear, PineCoders, veryfid). Additions on top: two-symbol spread layer, anchor-lead tracking from the left visible bar, and an optional currency-debasement view using FRED T10YIFR with calendar-time inflation decay (so the math is right on any chart timeframe, not just daily).
Open-source under MPL 2.0. Feedback welcome.
█ TECHNICAL OVERVIEW
WT3D Spread takes a two-symbol spread — either subtract or ratio — and feeds it into the WaveTrend 3D (WT3D) oscillator engine. WT3D operates on tanh-bounded, quadratic-mean-normalised derivatives, which means the absolute scale of the input is irrelevant; only the rate-of-change shape matters. That property makes spreads a natural fit, because pair-trade dynamics, relative outperformance, and cross-asset divergence are all rate-of-change questions on relative price.
This script is not a re-skin of WT3D. The oscillator core is jdehorty's open-source WaveTrend 3D — credited and linked in full at the bottom — but the surrounding machinery is new and addresses problems the original wasn't built to solve.
█ WHAT THIS SCRIPT ADDS ON TOP OF WT3D
1. Two-symbol spread layer
A second symbol is selectable as an input. The script computes either close1 − close2 (Subtract) or close1 / close2 (Ratio) on the chart's timeframe and routes the resulting series through WT3D's normalisation pipeline as the source. Leg 1 is always the chart symbol and is read directly from `close` rather than through `request.security()` — one fewer security call and no exchange-prefix ambiguity.
Leg 2 is the reference you're measuring against. Common patterns: a broad-market benchmark (SPY, QQQ) for relative-strength against the market; a sector index ETF (XLK for tech, XLE for energy, XLF for financials, GDX for miners, etc.) for sector-relative strength; a single peer ticker for direct pair comparison; or a macro proxy (DXY, GLD, BTC) for currency or hard-asset framing. Because leg 1 follows the chart automatically, you can pin leg 2 to a fixed reference and arrow through a watchlist to rip through comparisons in sequence — each chart change reruns the spread, the oscillator, and the info table against the new chart ticker.
Subtract is the right choice when both legs trade at similar absolute prices (FX crosses, sector ETFs in the same band). Ratio is the right choice when prices differ by an order of magnitude (a $30 stock vs a $500 index ETF, or an altcoin vs BTC), and is also the more honest framing for "outperformance" — d(A/B)/dt carries a B term that doesn't cancel under quadratic-mean normalisation, so the signal genuinely responds to relative dynamics rather than to whichever leg happens to have the larger absolute moves.
2. Currency Mode — calendar-time inflation drag
Optional. When enabled, the info table shows the spread's real (inflation-adjusted) value alongside the nominal value, plus a running purchasing-power drag percentage. Inflation can be pulled live from FRED's T10YIFR series (the bond market's 5-year-5-year forward inflation expectation, used in preference to backward-looking CPI because the indicator is forward-anchored) or set manually for non-USD currencies or scenario testing.
The decay is calendar-time-based, not bar-based: pp_value at any bar equals (1 − inflation)^(years_since_anchor), with years_since_anchor computed from wall-clock timestamps. This matters because the conventional approach of compounding a daily decay factor per bar over-applies the drag on intraday timeframes (six 4H bars × one daily decay each per session) and under-applies it across weekends (no chart bars form while inflation continues). The calendar-time formulation works identically on 1H, daily, or weekly charts and correctly accounts for weekend and holiday gaps.
This adjustment is display-only and does not affect oscillator signals.
3. Anchor Lead tracking
Optional. Locks an anchor bar at the left visible edge on first render and tracks each leg's percentage return from that anchor onward. The info table shows which leg is leading "since anchor," by how many percentage points, and the underlying returns of both legs for context. Useful for separating long-baseline winners from short-term noise — the rolling lead/trend rows above answer "who's winning right now," and the anchor row answers "who's actually won over the period you've been watching."
4. Lead and trend analysis
Always on. Two rows in the info table summarise the current state of the spread: "Leading" identifies which leg is currently outperforming, measured against a 20-bar SMA of the spread and gated by a volatility-aware tie threshold so noise doesn't flip the label. "Trend" answers whether that lead is expanding, holding, or contracting versus five bars ago. Helps interpret the oscillator at a glance.
5. Info table
Theme-aware (auto-detects from the chart background, or force Dark/Light). Shows the two legs colour-tinted to match the bullish/bearish oscillator palette, the live spread value, the lead and trend rows, the optional anchor row, and the optional Currency Mode block.
█ READING THE OSCILLATOR
A bearish reading in this script is not a value judgment. It means Leg 2 is currently outperforming Leg 1 — exactly the same information as "Leg 1 is currently underperforming Leg 2," but the colour convention narrates one of those two readings and silences the other. Whether a red oscillator is good news for you depends entirely on which leg you own, are considering rotating into, or are using as a benchmark.
The green/red colour scheme is inherited from absolute-asset analysis, where in jdehorty's original WT3D red = bad makes perfect sense because there is only one asset and one perspective. On a relative-strength indicator the same colours code "which side is currently winning the spread," not "good versus bad." This is the central conceptual difference between WT3D Spread and the original.
Two pieces of the UI exist to keep this explicit. The "Above 0 ▲" and "Below 0 ▼" rows at the top of the info table show, in live tickers, exactly which symbol the convention maps to for your current pair — so the framing stays visible on every glance and you never have to memorise which colour means what. The "Leading" row further down names the actual winner in plain language regardless of the colour shown. If you want to soften the framing visually, the Use Mirror toggle in Signal Settings renders the chart symmetrically, making both perspectives equally weighted.
█ WHEN TO USE WHICH SPREAD MODE
The default is Ratio because it works universally. Stock divided by SPY, altcoin divided by BTC, a sector ETF divided by a broad-market ETF — all are dimensionless, bounded, and read as relative-strength in the conventional way. The oscillator responds to genuine relative dynamics regardless of how differently the two legs are priced.
Use Subtract instead when both legs trade at similar absolute levels and you specifically want the spread in raw price units. EUR/USD vs GBP/USD, two large-caps in the same band, two sector ETFs around the same price — Subtract gives you a clean dollar (or basis-point) reading. With unequally-priced legs, Subtract is misleading: a 2% move on the cheaper leg is dwarfed by a 0.5% move on the more expensive leg, so the oscillator ends up tracking the dominant leg's volatility rather than the actual relative dynamic.
█ WHAT THIS ISN'T
This is a momentum and divergence tool for spreads, not a statistical-arbitrage toolkit. If your workflow requires cointegration testing, residual half-life estimation, rolling hedge-ratio computation, or stationarity diagnostics, this isn't that. Use it for timing relative-strength shifts and spotting divergences within the WT3D framework, applied to a custom spread you've chosen.
Currency Mode is a display feature for showing real-value erosion against an inflation series. It does not feed back into the oscillator, and it makes the most sense when at least one leg of the spread carries fiat-currency exposure (a USD-denominated commodity, a currency index, a real-asset-vs-fiat pair). On a pure equity-vs-equity spread the Real Value row is technically computable but conceptually thin.
Anchor Lead locks to the left visible bar on first render. If you scroll the chart and want to re-anchor, reload the indicator.
█ CREDITS
Built on jdehorty's open-source WaveTrend 3D (WT3D):
WT3D in turn credits and inherits from:
• LazyBear — original WaveTrend port to Pine (2014)
• PineCoders — colour-gradient framework (the getColorGradientFromSource / getColorGradientFromSteps helpers used throughout)
• veryfid — mirrored-signal cycle analysis and multi-lookback timeframe proxies (the Use Mirror toggle and the Fast/Normal/Slow oscillator structure)
The KernelFunctions library used for the optional kernel overlays is also jdehorty's, imported by reference.
Released under the Mozilla Public License 2.0 — the TradingView default for open-source Pine publications.
█ DISCLAIMER
For analytical and educational use. Past behaviour of any spread, oscillator, or signal carries no guarantee about future behaviour. Do your own due diligence.
Gösterge

Gösterge

Gösterge

Gösterge