Gösterge
Zig Zag Göstergesi

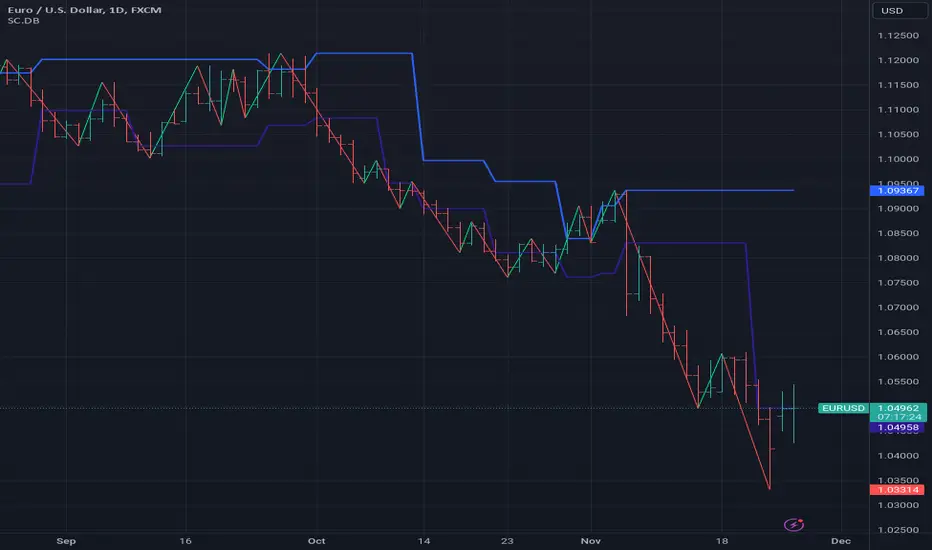
ZigZag Plus [xdecow]A ZigZag Like based on candle close.
A lot of options that can be hide in options.
Triangle/bright - reversal confirmation candle
Circle/dark - higher/lower candle breakout
Square/light - Insidebar
Gösterge

Average True Range PercentageUseful in finding the percent change in the ATR. Google it and see how you can implement it. I use it in a zig zag indicator made by Ricardo Santos.
Happy Trading!
Gösterge

R100 Wave Volume v2 (*v*)This indicator is similar to the Weis Wave Volume indicator in that it shows cumulative volume for each up and down price wave. However it is calculated differently, using the Jurik moving average to determine turning points. Use this in conjunction with the R100 Wave indicator to determine the best fit Jurik length and power settings.
A great indicator to help analyse the strength of pullbacks, continuation moves and changes in behaviour.
I hope you get some value out of it. Only conditions
Gösterge
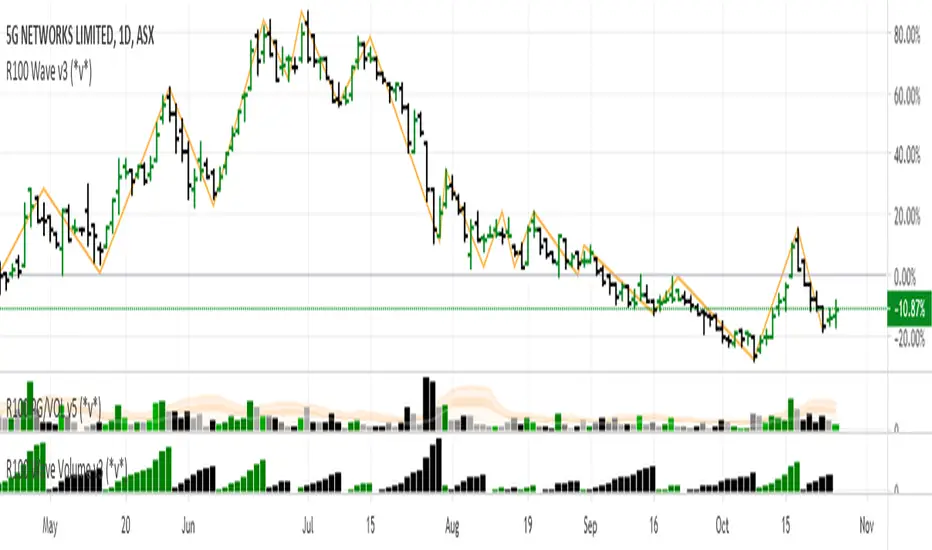
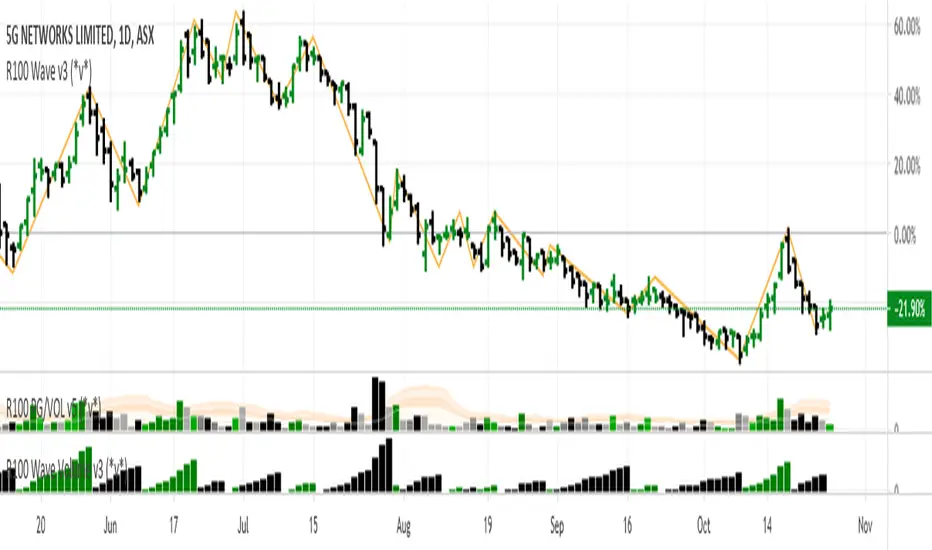
R100 Wave v2 (*v*)This is a Wave (or Zig Zag) indicator I made to use in conjunction with the Wave Volume indicator I use.
It uses the Jurik moving average to determine turning points, and will plot the tops and bottoms of the wave based on the most recent high- so you can also use to quickly find pivot highs and lows. If you are using with the R100 Wave Volume indicator, first adjust the wave to fit better (if required) using the Jurik length and/or power, and then use the same settings on the Wave Volume indic
Gösterge
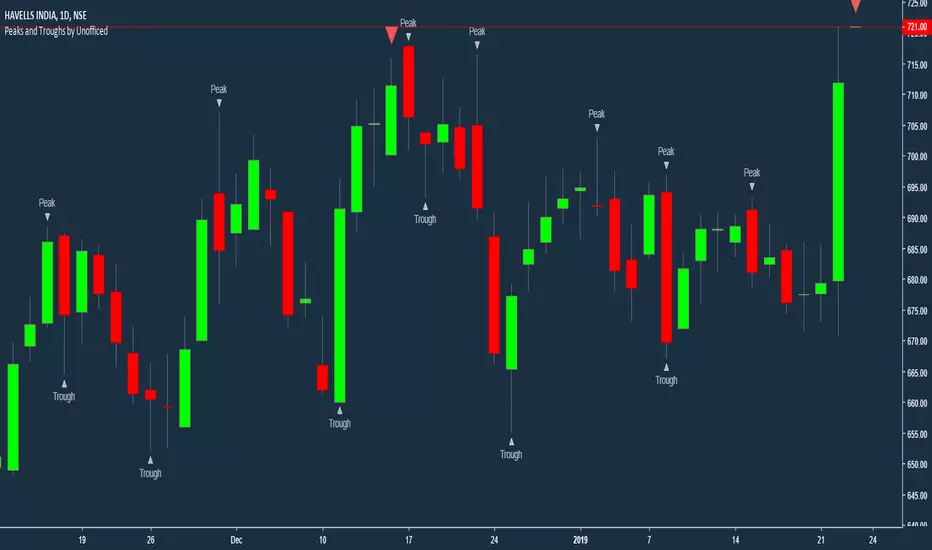
Higher High Lower Low Strategy (With Source Code)This script finds pivot highs and pivot lows then calculates higher highs & lower lows. And also it calculates support/resistance by using HH-HL-LL-LH points.
Generally HH and HL shows up-trend, LL and LH shows down-trend.
If price breaks resistance levels it means the trend is up or if price breaks support level it means the trend is down, so the script changes bar color blue or black. if there is up-trend then bar color is blue, or if down-trend then bar color is black. also as you can see
Gösterge

Fractal Regression Channel V0.1Port of @RicardoSantos' Fractal Regression Channel V0 from pinescript 2 to pinescript 3.
// Source:
// Original Author: @RicardoSantos
Gösterge

Zero Lag - ZigZag - JDThis is a alternative version of the well known "ZigZag indicator" but it uses turning points of the Jurik ma
instead of the traditional "pivot points" that are by definition lagging by a large lookback period, the (almost-) Zero Lag ZigZag lags by about 2 bars on average (depending on the candles forming)
The ZigZag pattern can be used to draw trendlines and S/R lines
It can also be used for "wave counting" in a way that reduces interpretation.
If you find other uses, please leave your ideas
Gösterge

Simple LinesIntroduction
Making lines is great in technical analysis since it can highlights principal movements and make the analysis of the price easier when using certain methodologies (Elliott Waves, patterns).
However most of the indicators making lines (Zig-Zag, simple linear regression) are non causal (repaint), this is the challenge i tried to overcome, making an indicator capable of making lines in a smart way (able to follow price without loosing a linear approach) and with the least lag possibl
Gösterge

zigzag%This is zigzag % , no repaint and no lag as it based on % changes
the main issue is the addition of take profit and stop loss together with trailing (thanks to Yatrader to his code)
set the zigzag% according to best fit of your graph for best results
Gösterge

Kawabunga Swing Failure Points Candles (SFP) by RRBKawabunga Swing Failure Points Candles (SFP) by RagingRocketBull 2019
Version 1.0
This indicator shows Swing Failure Points (SFP) and Swing Confirmation Points (SCP) as candles on a chart.
SFP/SCP candles are used by traders as signals for trend confirmation/possible reversal.
The signal is stronger on a higher volume/larger candle size.
A Swing Failure Point (SFP) candle is used to spot a reversal:
- up trend SFP is a failure to close above prev high after making a new higher high => implie
Gösterge

Gösterge
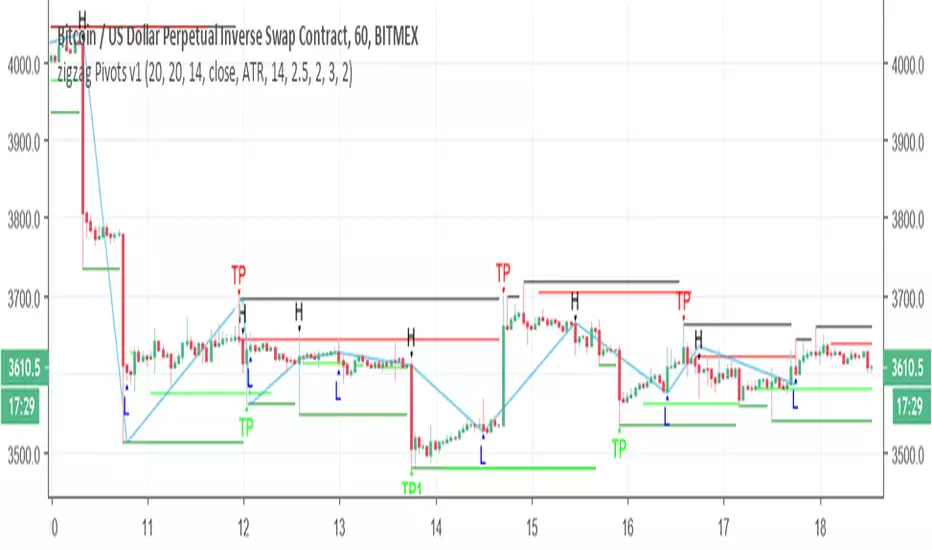
zigzag Pivots v1So I took the zigzag pivot of my last script , i remove the original zigzag and replace it by % zigzag , then i add the TP % 1 and 2 and by the cross of the uptrend of the zigzag % of the pivot points of support and resistance we can make buy and sell signal (H and L) and take the profit out by the trend using the Take profit 1 and 2.
for each time frame you need to set up the % correctly for the best fit to get optimal results
set also the bar length or resistance to best fit (now its on 20) t
Gösterge
zigzag PivotsThis is based on two model : the first is the zigzag model of Ricardo Santos
the second is a pivot system for high and low to find resistance made by jaggedsoft
I try to show the connection between them and to form a cross of when the zigzag model crossing the pivot model
this is seen in show sig
best approach is to find the low based on the pivot system and try to make your buy around that spot . when there is high resistance either exit or buy when the asset cross it above . in case of s
Gösterge

Strateji

Strateji

Weis Wave ChartThis indicator is based on the Weis Wave described by David H. Weis in his book Trades About to Happen: A Modern Adaptation of the Wyckoff Method, more info how to use this indicator can be found in this video . The Weis Wave is an adaptation of Richard D. Wyckoff’s method Wave Charts. It works in all time periods and can be applied to all asset types.
Unlike other implementations I found here on TradingView, this implementation make use of a Renko-like zig zag pattern, very similar to how it
Gösterge

Gösterge

ZigZag VolumeAccumulatorThis script plot a Volume Accumulator Histogram.
It accumulates volume after a price changes direction.
Use it to show how big is the bear or bull force.
I recommend to use Bandsize = 2 or 3 times ATR(300 or bigger)
This script uses the core of my ZigZag Bands indicator,
Use it to adjust Bandsize parameter.
Gösterge

ZigZag BandsThis script plots a central line and top and bottom lines, like a bands.
If the market is up and price still going up then central line follow the last closed "close" value.
If the market is up and price goes down, then central line stop change. If price still going down and cross bottom line, the direction changes and central line start to follow the close value if it is below central line.
I recommend to use Bandsize = 2 or 3 times ATR(300 or bigger)
This script is used in pair with my
Gösterge

[RS]Fractal Auto Gann LinesEXPERIMENTAL:
GANN lines projection based on zigzag tops/bottoms, use at your own risk.
Gösterge

Gösterge

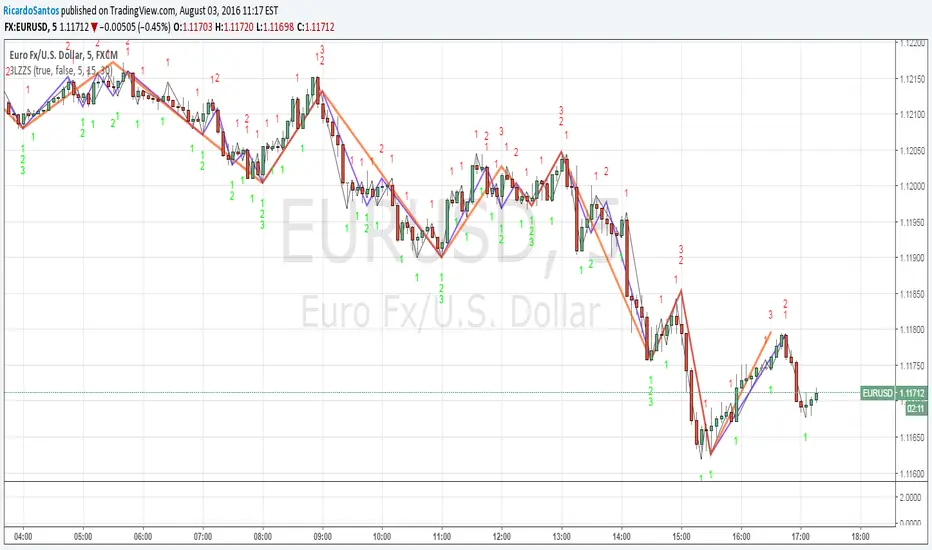
[RS]3 Level ZigZag Semafor V0EXPERIMENTAL:
request for CharanTejaM
zigzag may be adjusted to use other methods.
zigzag repaints, use at your own discretion.
Gösterge
Gösterge