
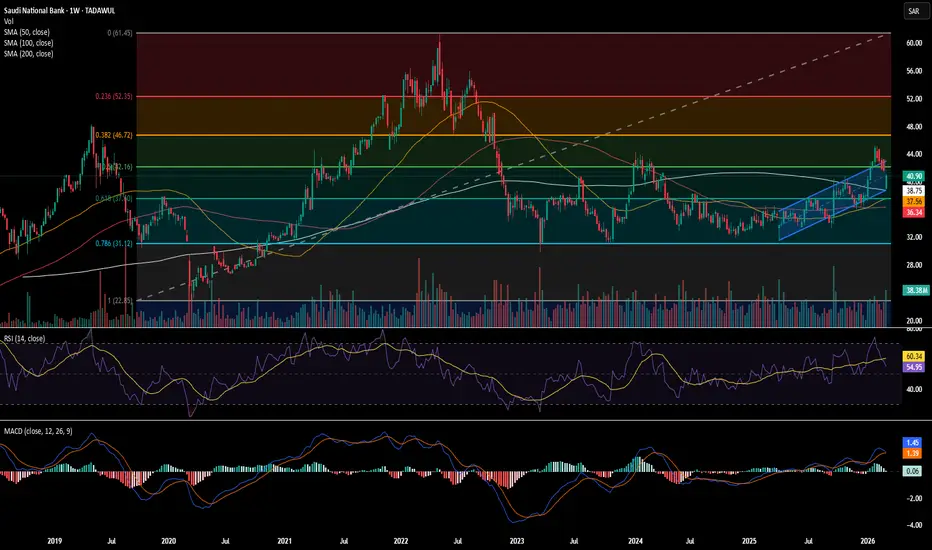
SNB is consolidating within a rising channel on the weekly chart, with the 200 WMA around SAR 39 acting as key support. On the upside, resistance levels cluster at SAR 42, 45 and 47, where prior structure and Fibonacci retracements converge.
The range broadly reflects the current fundamentals for the large Saudi bank accurately: At SAR 39–47, the stock trades on roughly 9–12x 2026E P/E, reflecting robust 7-9% credit growth but increasing competition for system liquidity. A decisive move through the upper end of the range would likely require a meaningful shift in the underlying drivers.
The range broadly reflects the current fundamentals for the large Saudi bank accurately: At SAR 39–47, the stock trades on roughly 9–12x 2026E P/E, reflecting robust 7-9% credit growth but increasing competition for system liquidity. A decisive move through the upper end of the range would likely require a meaningful shift in the underlying drivers.

免責聲明
這些資訊和出版物並非旨在提供,也不構成TradingView提供或認可的任何形式的財務、投資、交易或其他類型的建議或推薦。請閱讀使用條款以了解更多資訊。
免責聲明
這些資訊和出版物並非旨在提供,也不構成TradingView提供或認可的任何形式的財務、投資、交易或其他類型的建議或推薦。請閱讀使用條款以了解更多資訊。