 1585
1585Trade Indicators
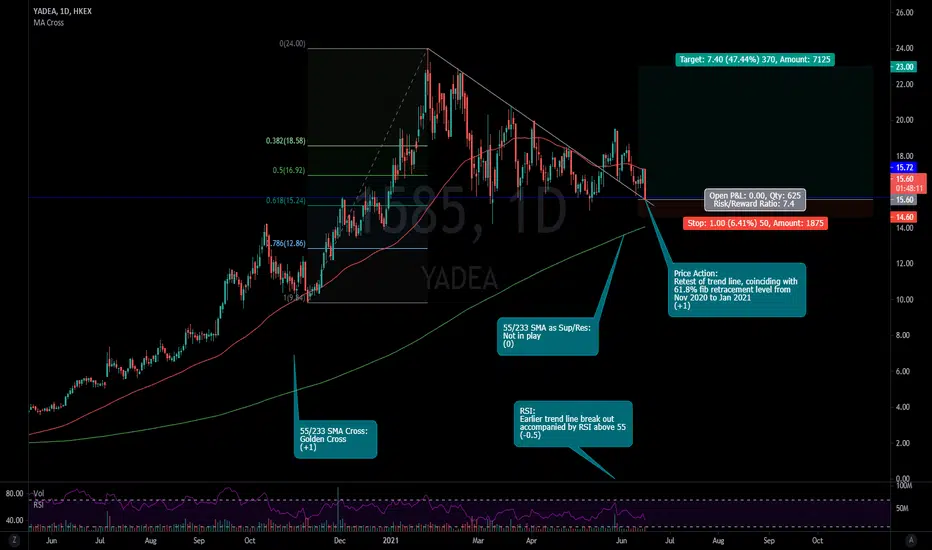
55 & 233 Daily SMA Cross: +1
Using 55 and 233 as Fibonacci versions of 50 and 200 day moving averages
Currently in golden cross.
55 & 233 Daily SMA as Support & Resistance: 0
Currently not in play.
Relative Strength Index: -0.5
Earlier trend line break on May 20 was accompanied by RSI at 58. This shows strength above 55, but not overbought below 70.
Currently weak below 45.
Price Action: +1
Price is retesting the trend line that it broke out of on May 20, and is also sitting on a key support level at around $15.72, which coincides with the 61.8% Fibonacci retracement level of the move from Nov 11 to Jan 26.
Price Levels
Entry: $15-$16
Entry between this area of strong support.
Stop Loss: $14.60
A break below $15 could suggest further downside.
Target: $23.00
Targeting to take partial profits near the all-time highs, and letting the rest run as a continuation of this uptrend that started in March 2020 is expected to continue.
https://finance.yahoo.com/news/yadea-shines-cutting-edge-electric-115000725.html

免責聲明
這些資訊和出版物並非旨在提供,也不構成TradingView提供或認可的任何形式的財務、投資、交易或其他類型的建議或推薦。請閱讀使用條款以了解更多資訊。