
hello
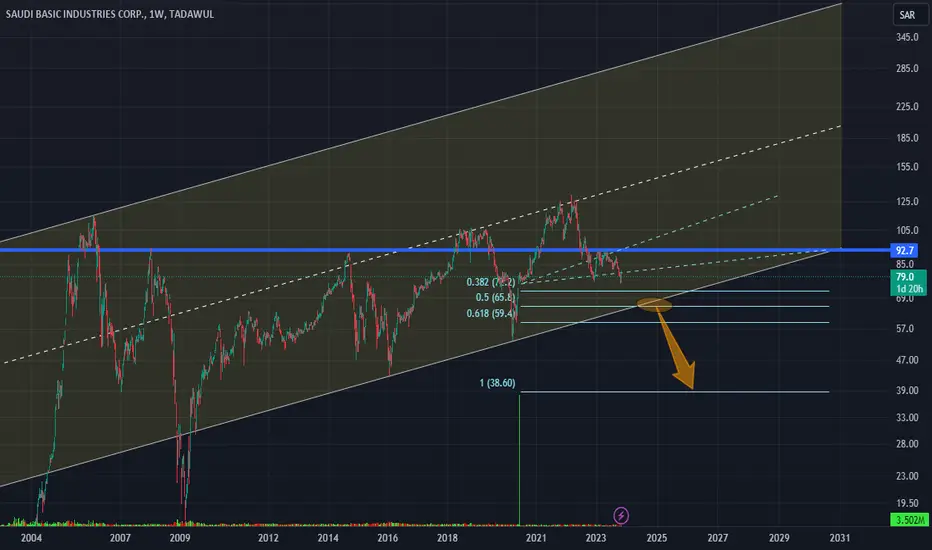
first as you see on my chart resepects its evolution according to the figure so:
- if it breaks the suuport line around 65.8 it will reach 59.4 then maye be pulback toward its broken support then continue its free fall until 38.6 or more.
- otherwise it will rebond on its support and buyers can hold their stocks wishing higher levels
Remember that this support is a critical level so pay attention
NB:the horizontal blue line presents a historical level that retraces history of this stock
Keep in mind that i am not having a cristal ball predicting future but i try to be more efficient and rationnal
first as you see on my chart resepects its evolution according to the figure so:
- if it breaks the suuport line around 65.8 it will reach 59.4 then maye be pulback toward its broken support then continue its free fall until 38.6 or more.
- otherwise it will rebond on its support and buyers can hold their stocks wishing higher levels
Remember that this support is a critical level so pay attention
NB:the horizontal blue line presents a historical level that retraces history of this stock
Keep in mind that i am not having a cristal ball predicting future but i try to be more efficient and rationnal

相關出版品
免責聲明
這些資訊和出版物並非旨在提供,也不構成TradingView提供或認可的任何形式的財務、投資、交易或其他類型的建議或推薦。請閱讀使用條款以了解更多資訊。