
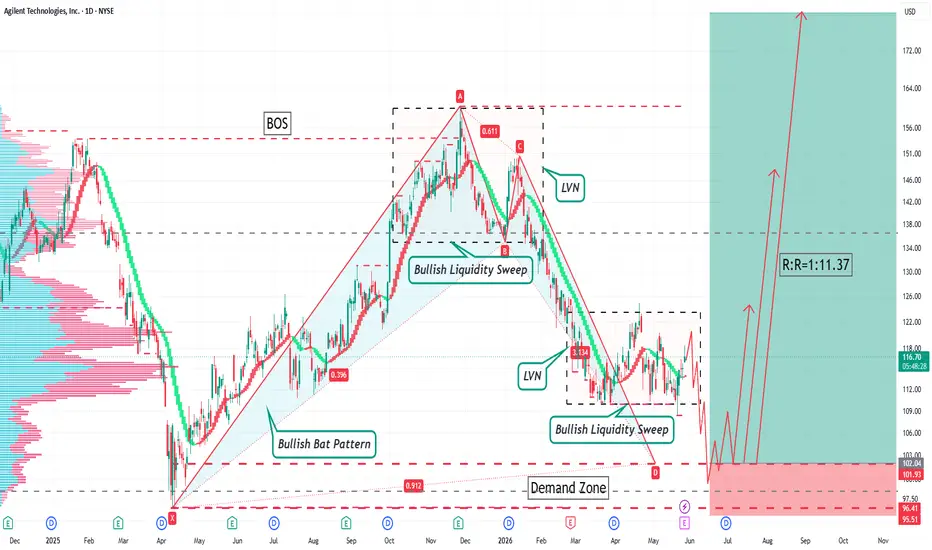
Trading Plan for A
Asset: NASDAQ Stock A
Timeframe: Daily Chart
Current Price: $116.39
Wait for pullback on lower timeframes to go long.
Entry: Around $102.00
Support & Stop Loss: $95.50
Profit Targets & Management
1. TP1: Around $125.00. Reduce half position and adjust stop loss to lock profits.
2. TP2: Around $148.00. Reduce half of the remaining position and trail stop loss.
3. TP3: Around $180.00. Reduce position further and trail stop loss. Hold the last position.
US Stock Trading Risk Disclaimer
Trading US stocks involves substantial risks. Price volatility, market gaps and slippage may occur at any time. Macroeconomic changes, corporate news and regulatory policies can cause sharp price fluctuations. This document is for trading reference only and does not constitute investment advice. All trading decisions and losses shall be borne by the trader. Please strictly implement risk management.
Asset: NASDAQ Stock A
Timeframe: Daily Chart
Current Price: $116.39
Wait for pullback on lower timeframes to go long.
Entry: Around $102.00
Support & Stop Loss: $95.50
Profit Targets & Management
1. TP1: Around $125.00. Reduce half position and adjust stop loss to lock profits.
2. TP2: Around $148.00. Reduce half of the remaining position and trail stop loss.
3. TP3: Around $180.00. Reduce position further and trail stop loss. Hold the last position.
US Stock Trading Risk Disclaimer
Trading US stocks involves substantial risks. Price volatility, market gaps and slippage may occur at any time. Macroeconomic changes, corporate news and regulatory policies can cause sharp price fluctuations. This document is for trading reference only and does not constitute investment advice. All trading decisions and losses shall be borne by the trader. Please strictly implement risk management.

免責聲明
這些資訊和出版物並非旨在提供,也不構成TradingView提供或認可的任何形式的財務、投資、交易或其他類型的建議或推薦。請閱讀使用條款以了解更多資訊。
免責聲明
這些資訊和出版物並非旨在提供,也不構成TradingView提供或認可的任何形式的財務、投資、交易或其他類型的建議或推薦。請閱讀使用條款以了解更多資訊。