
Rev Growth YoY and FWD are 50 and 23% respectively and 307 and 167% above the sector respectively while PE GAAP TTM and FWD are 71 and 65% below sector! This implies a huge discount in growth.
Gross Profit does lag behind the sector by about 12%, but the valuation combined with the outsized growth substantially off-sets this disparity.
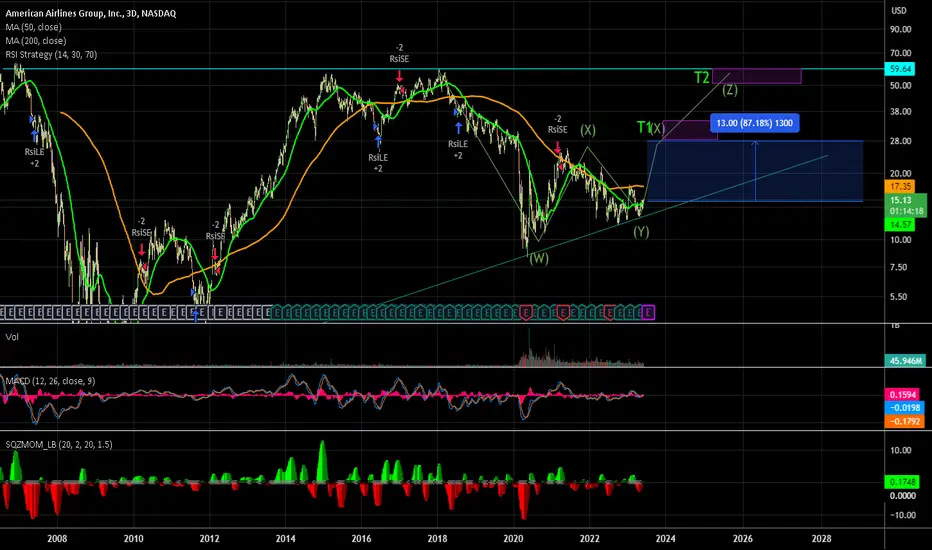
On a technical note, there is an intermediary "W" pattern. Confirmation of this pattern would be realized once the SP closes above the midpoint peak of @25.75 along w/ substantial volume, 3 day rule, etc. Pattern and targets are also correlated with Fibonacci retracement levels and Fib Time series.
Gross Profit does lag behind the sector by about 12%, but the valuation combined with the outsized growth substantially off-sets this disparity.
On a technical note, there is an intermediary "W" pattern. Confirmation of this pattern would be realized once the SP closes above the midpoint peak of @25.75 along w/ substantial volume, 3 day rule, etc. Pattern and targets are also correlated with Fibonacci retracement levels and Fib Time series.

免責聲明
這些資訊和出版物並非旨在提供,也不構成TradingView提供或認可的任何形式的財務、投資、交易或其他類型的建議或推薦。請閱讀使用條款以了解更多資訊。
免責聲明
這些資訊和出版物並非旨在提供,也不構成TradingView提供或認可的任何形式的財務、投資、交易或其他類型的建議或推薦。請閱讀使用條款以了解更多資訊。