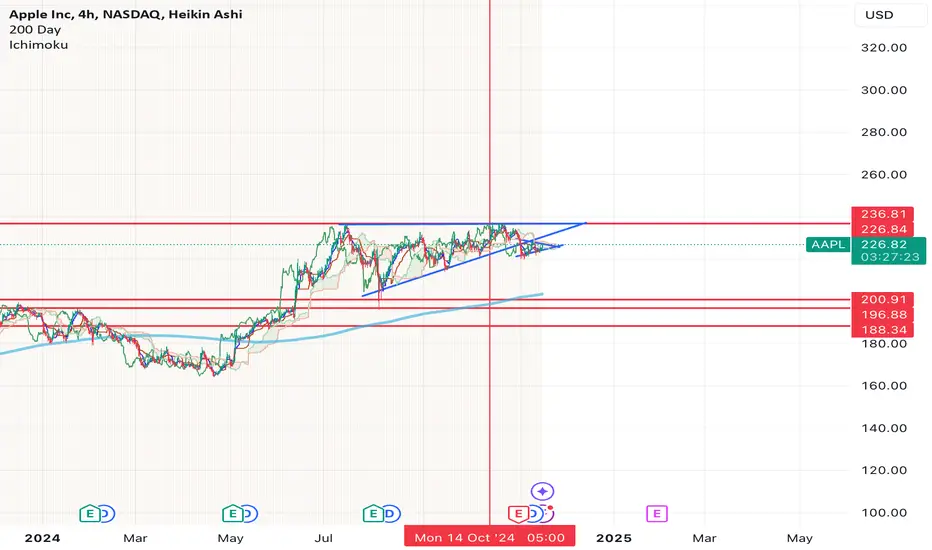
The  AAPL chart looks weak. Since October, you can see price formed a lower high and now has been consolidating in a bear flag.
Should the flag break down, I think we'll see a sharp move down to $200 or one of the supports below it.
Why such a large move? The chart has an imbalance on it from how quickly price rose in the first half of the year.
I think price needs to correct lower to fix the chart imbalance.
The move should play out by Jan 6.
Let's see.
AAPL chart looks weak. Since October, you can see price formed a lower high and now has been consolidating in a bear flag.Should the flag break down, I think we'll see a sharp move down to $200 or one of the supports below it.
Why such a large move? The chart has an imbalance on it from how quickly price rose in the first half of the year.
I think price needs to correct lower to fix the chart imbalance.
The move should play out by Jan 6.
Let's see.
註釋
I'm in 12/20 $200P
免責聲明
這些資訊和出版物並非旨在提供,也不構成TradingView提供或認可的任何形式的財務、投資、交易或其他類型的建議或推薦。請閱讀使用條款以了解更多資訊。