
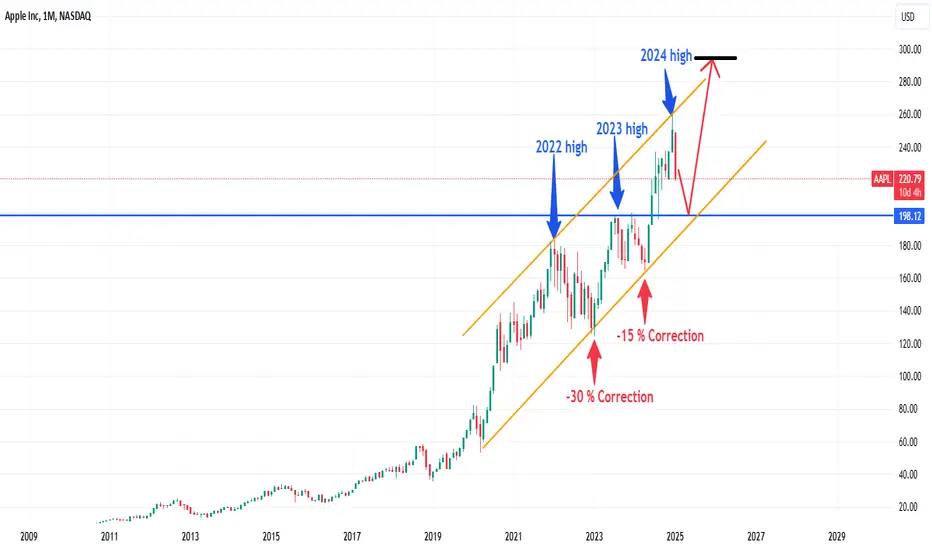
Offcourse the chart is self explanatory.
on daily timeframe where it touches the 200 SMA.
It means that the long term downtrend is gonna start.
Still a big no.... it has to touch the monthly resistance around 200 area.
Dear Traders, Go away and check for another mind.
as investor I already took my position at 240. Will take more position around 200 price.
Let's analyse it again in April-May 2025.
on daily timeframe where it touches the 200 SMA.
It means that the long term downtrend is gonna start.
Still a big no.... it has to touch the monthly resistance around 200 area.
Dear Traders, Go away and check for another mind.
as investor I already took my position at 240. Will take more position around 200 price.
Let's analyse it again in April-May 2025.

免責聲明
這些資訊和出版物並非旨在提供,也不構成TradingView提供或認可的任何形式的財務、投資、交易或其他類型的建議或推薦。請閱讀使用條款以了解更多資訊。