
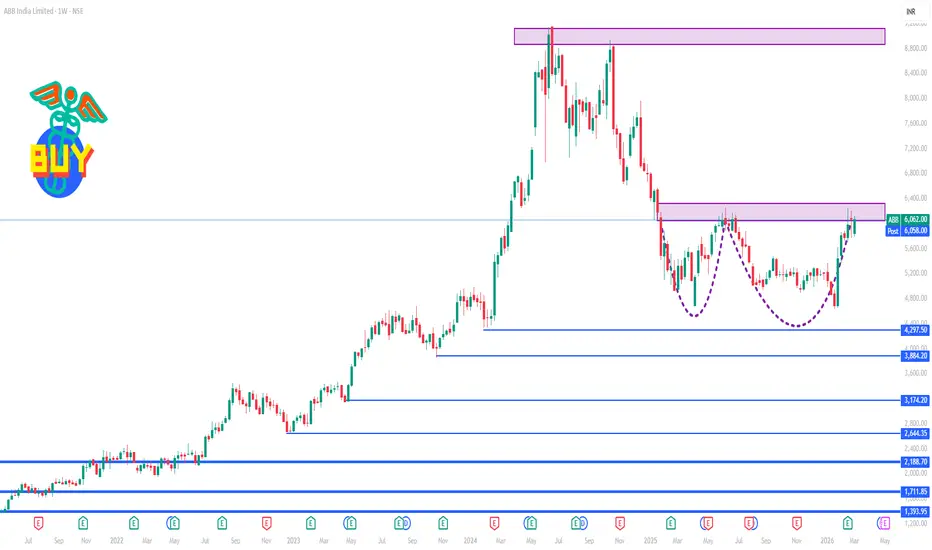
📈 Current Price (Live / Most Recent)
• Latest NSE price: ~₹6,060 – ₹6,080 per share.
This gives us the reference point for weekly levels below.
📊 1‑Week Key Levels
🔼 Upward (Resistance) Levels
These are zones where the stock may face selling pressure or pause going higher:
R1: ₹6,080 – ₹6,110 — immediate resistance (near current price cluster).
R2: ₹6,200 – ₹6,260 — zone around the recent 52‑week high range (~₹6,260).
R3: ~₹6,300 – ₹6,350+ — higher leg resistance before broader breakout level.
📌 Bullish scenario: Sustained weekly closes above ₹6,260 may indicate continuation toward higher levels, potentially ₹6,300+.
🔽 Downward (Support) Levels
These are zones where the stock may find buying support or stop falling:
S1: ₹5,900 – ₹5,930 — near current short‑term pivot zone and weekly support.
S2: ₹5,780 – ₹5,820 — next support seen from recent pivot calculation.
S3: ₹5,650 – ₹5,600 — deeper support if the weekly break happens.
📌 Bearish scenario: A weekly close below ~₹5,900 could see a further test toward ₹5,780 or lower zones.
🔁 Pivot / Mid‑Point
• Weekly Pivot: Around ~₹5,920 – ₹5,950 (central decision zone).
This pivot helps gauge whether bulls or bears are controlling short‑term direction:
Price staying above this pivot → bullish bias
Price below pivot → bearish bias
⭐ Quick Weekly Interpretation
📈 Bullish bias if:
Price holds above ₹6,080 & breaks above ₹6,200 on weekly close.
This signals strength and may target ₹6,300+.
📉 Bearish bias if:
Price loses ₹5,900 convincingly (weekly close).
Then focus shifts to ₹5,780 and eventually ₹5,650.
• Latest NSE price: ~₹6,060 – ₹6,080 per share.
This gives us the reference point for weekly levels below.
📊 1‑Week Key Levels
🔼 Upward (Resistance) Levels
These are zones where the stock may face selling pressure or pause going higher:
R1: ₹6,080 – ₹6,110 — immediate resistance (near current price cluster).
R2: ₹6,200 – ₹6,260 — zone around the recent 52‑week high range (~₹6,260).
R3: ~₹6,300 – ₹6,350+ — higher leg resistance before broader breakout level.
📌 Bullish scenario: Sustained weekly closes above ₹6,260 may indicate continuation toward higher levels, potentially ₹6,300+.
🔽 Downward (Support) Levels
These are zones where the stock may find buying support or stop falling:
S1: ₹5,900 – ₹5,930 — near current short‑term pivot zone and weekly support.
S2: ₹5,780 – ₹5,820 — next support seen from recent pivot calculation.
S3: ₹5,650 – ₹5,600 — deeper support if the weekly break happens.
📌 Bearish scenario: A weekly close below ~₹5,900 could see a further test toward ₹5,780 or lower zones.
🔁 Pivot / Mid‑Point
• Weekly Pivot: Around ~₹5,920 – ₹5,950 (central decision zone).
This pivot helps gauge whether bulls or bears are controlling short‑term direction:
Price staying above this pivot → bullish bias
Price below pivot → bearish bias
⭐ Quick Weekly Interpretation
📈 Bullish bias if:
Price holds above ₹6,080 & breaks above ₹6,200 on weekly close.
This signals strength and may target ₹6,300+.
📉 Bearish bias if:
Price loses ₹5,900 convincingly (weekly close).
Then focus shifts to ₹5,780 and eventually ₹5,650.

Contact Knowledgehub for a detailed consultation: Dm on WhatsApp: [wa.link/a2o0kz]-
Phone No: [+91 93102 26243]-
Email: [tradingviewknowledgehub@gmail.com]---
-- Let’s achieve success together!
Phone No: [+91 93102 26243]-
Email: [tradingviewknowledgehub@gmail.com]---
-- Let’s achieve success together!
相關出版品
免責聲明
這些資訊和出版物並非旨在提供,也不構成TradingView提供或認可的任何形式的財務、投資、交易或其他類型的建議或推薦。請閱讀使用條款以了解更多資訊。
Contact Knowledgehub for a detailed consultation: Dm on WhatsApp: [wa.link/a2o0kz]-
Phone No: [+91 93102 26243]-
Email: [tradingviewknowledgehub@gmail.com]---
-- Let’s achieve success together!
Phone No: [+91 93102 26243]-
Email: [tradingviewknowledgehub@gmail.com]---
-- Let’s achieve success together!
相關出版品
免責聲明
這些資訊和出版物並非旨在提供,也不構成TradingView提供或認可的任何形式的財務、投資、交易或其他類型的建議或推薦。請閱讀使用條款以了解更多資訊。