
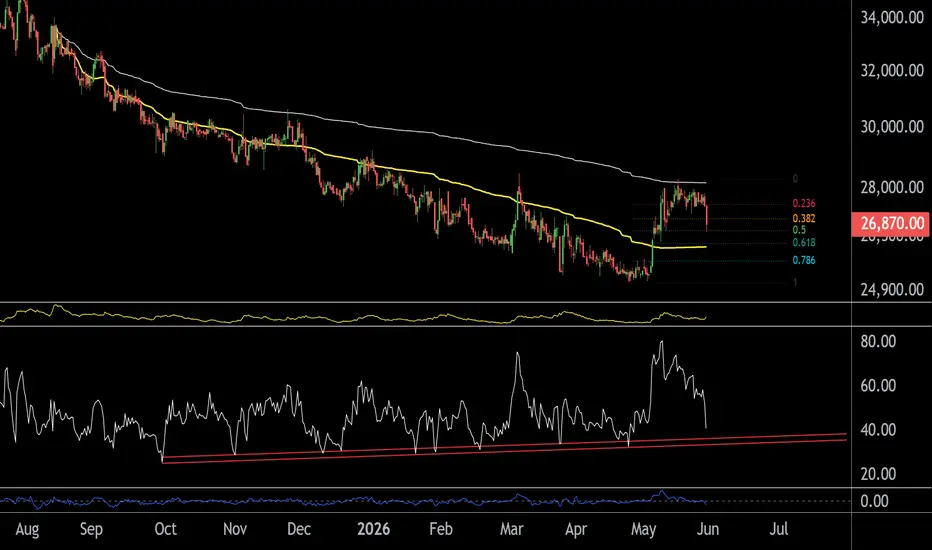
This is the 4-hour timeframe chart of ABBOTINDIA.
The stock is currently holding a strong support zone near 26,250 – 26,500, backed by both trendline and RSI support.
Any positive momentum from this zone may trigger an upside move in the stock. However, if the support zone gets breached, the momentum structure may weaken and the stock could move into a range-bound phase.
View remains invalid below the mentioned support zone.
Thank You !!
The stock is currently holding a strong support zone near 26,250 – 26,500, backed by both trendline and RSI support.
Any positive momentum from this zone may trigger an upside move in the stock. However, if the support zone gets breached, the momentum structure may weaken and the stock could move into a range-bound phase.
View remains invalid below the mentioned support zone.
Thank You !!

@RahulSarawagi
Connect us at optionlab.co.in/
Connect us at optionlab.co.in/
免責聲明
這些資訊和出版物並非旨在提供,也不構成TradingView提供或認可的任何形式的財務、投資、交易或其他類型的建議或推薦。請閱讀使用條款以了解更多資訊。
@RahulSarawagi
Connect us at optionlab.co.in/
Connect us at optionlab.co.in/
免責聲明
這些資訊和出版物並非旨在提供,也不構成TradingView提供或認可的任何形式的財務、投資、交易或其他類型的建議或推薦。請閱讀使用條款以了解更多資訊。