Continuation via Symmetrical Triangle
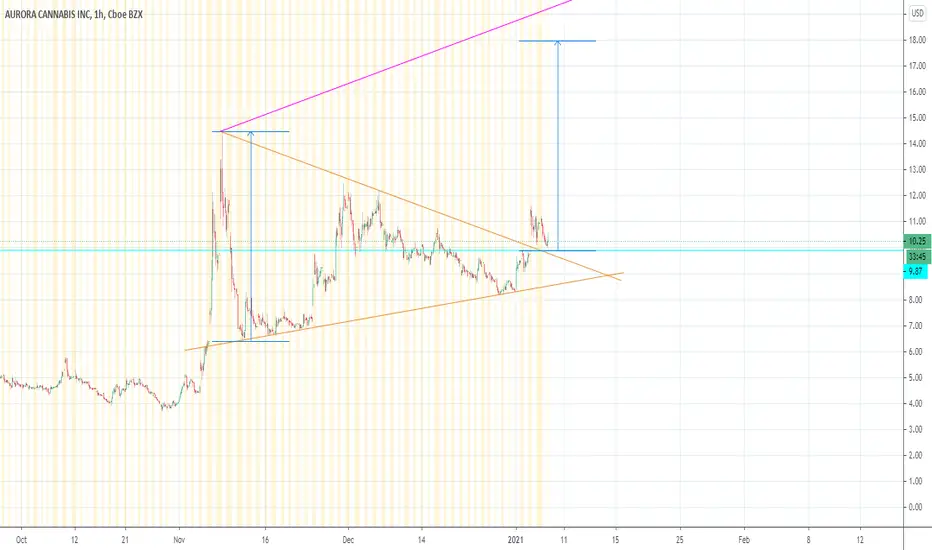
Hourly chart showing ACB making higher lows and lower highs to form a symmetrical triangle. Potential trend continuation following a breakout of the triangle, and back test of the upper trendline of the triangle. See SunRun,  RUN for a similar setup and how it can play out. GLTA!
免責聲明
這些資訊和出版物並非旨在提供,也不構成TradingView提供或認可的任何形式的財務、投資、交易或其他類型的建議或推薦。請閱讀使用條款以了解更多資訊。