
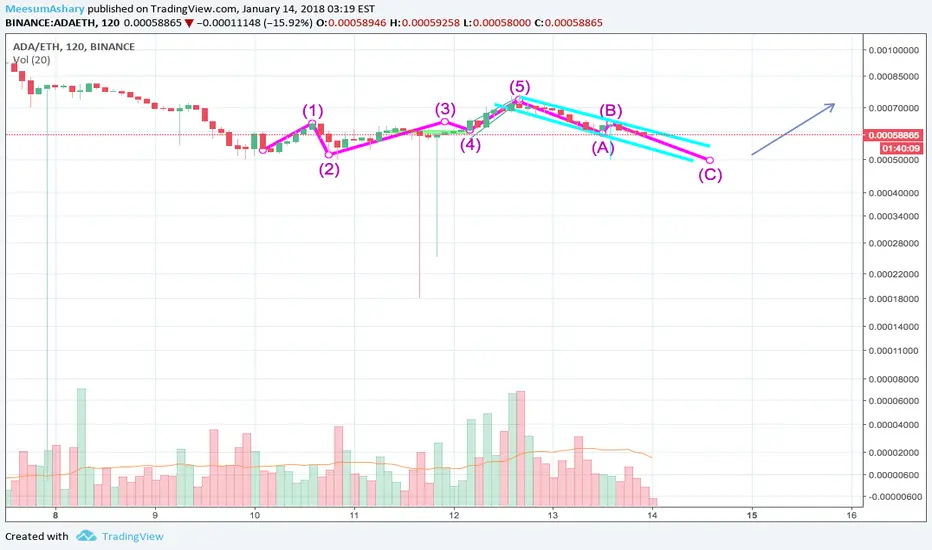
The Elliot Wave pattern shows that, after the ABC correction (Pink), prices will rise again for a while following a 1,2,3,4,5 Elliot wave.
The possible bullish trend is also confirmed by the flag pattern (Teal) seen around the ABC correction. We know that the flag pattern is a continuous pattern. This indicates that after the graph breaks out of the flag, it will resume its previous pattern. Which in this case, was a bullish trend.
Feel free to critique this analysis, as I am still fairly new to this.
The possible bullish trend is also confirmed by the flag pattern (Teal) seen around the ABC correction. We know that the flag pattern is a continuous pattern. This indicates that after the graph breaks out of the flag, it will resume its previous pattern. Which in this case, was a bullish trend.
Feel free to critique this analysis, as I am still fairly new to this.

免責聲明
這些資訊和出版物並非旨在提供,也不構成TradingView提供或認可的任何形式的財務、投資、交易或其他類型的建議或推薦。請閱讀使用條款以了解更多資訊。
免責聲明
這些資訊和出版物並非旨在提供,也不構成TradingView提供或認可的任何形式的財務、投資、交易或其他類型的建議或推薦。請閱讀使用條款以了解更多資訊。