
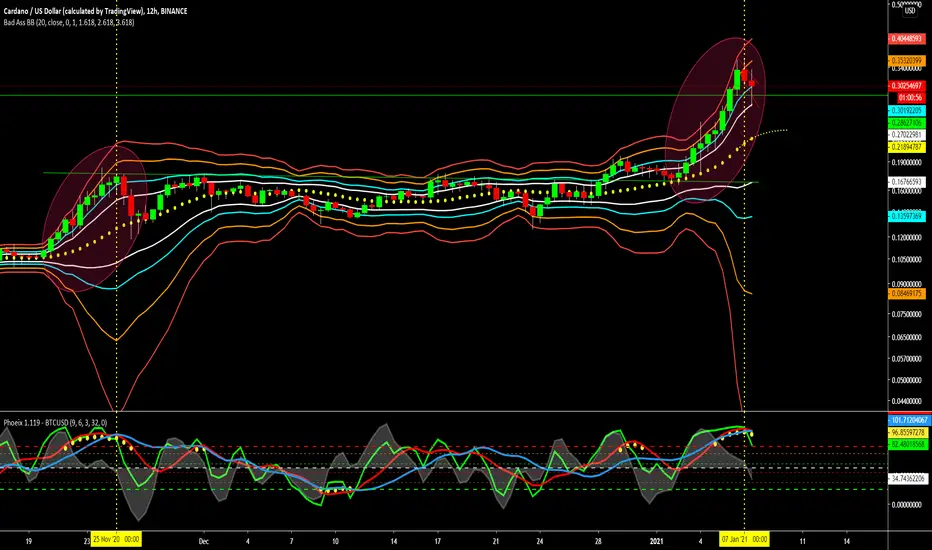
After all the long-awaited green days for most of the alts it might be time for a short correction towards the yellow dotted 20 MA of the bollingerbands or at least the upper white. The situation on the indicators in the 12 and 24-hour chart of today looks very similar to the situation on November 24, 2020. However, in full bullish mode, the market is in right now it could also be possible the correction remains to the upper white of the bollingerbands and move sideways for a while. Either way, don't be greedy when you do decide to short in current market conditions.
註釋
Anyone interested in the indicators I use should take a look at Wyckoffmode on Tradingview. All credits to him for making and explaining these indicators.註釋
註釋
As seen in de 24 hour chart the comparison is very clear with even the pressure dots at the same heights.
免責聲明
這些資訊和出版物並非旨在提供,也不構成TradingView提供或認可的任何形式的財務、投資、交易或其他類型的建議或推薦。請閱讀使用條款以了解更多資訊。