
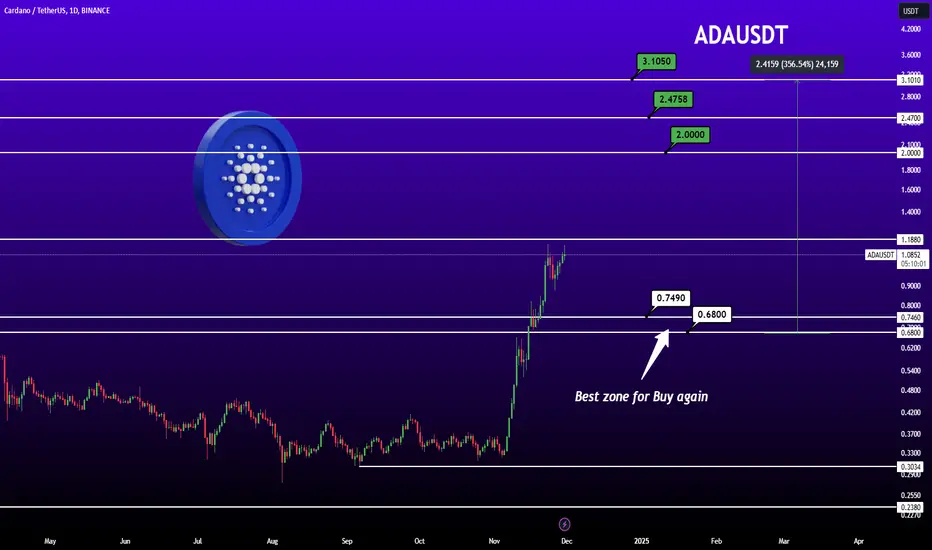
🚀 ADA/USDT Price Analysis
The Cardano (ADA) chart shows strong bullish momentum, with prices climbing steadily. Here's a breakdown of key levels:
🔼 Resistance Zones to Watch:
$2.00 🛑: First major resistance. Breaking this could signal a rally.
$2.4758 🛑: A critical level for medium-term targets.
$3.1050 🛑: Long-term price target if the bullish trend holds.
🔽 Support Zones for Buying:
$0.7490 ✅: A solid support zone where buyers previously stepped in.
$0.6800 ✅: Highlighted as the "Best Zone for Buy Again" – ideal for re-entry during corrections.
📈 Upside Potential:
If the bullish trend continues, ADA has a 356% growth potential, aiming for $2.4159 and beyond!
💡 Takeaway:
The current trend favors bulls, but a pullback to support zones could provide better entry opportunities. Keep an eye on trading volumes and breakout confirmations at resistance levels!

免責聲明
這些資訊和出版物並非旨在提供,也不構成TradingView提供或認可的任何形式的財務、投資、交易或其他類型的建議或推薦。請閱讀使用條款以了解更多資訊。