
Hey Trader!
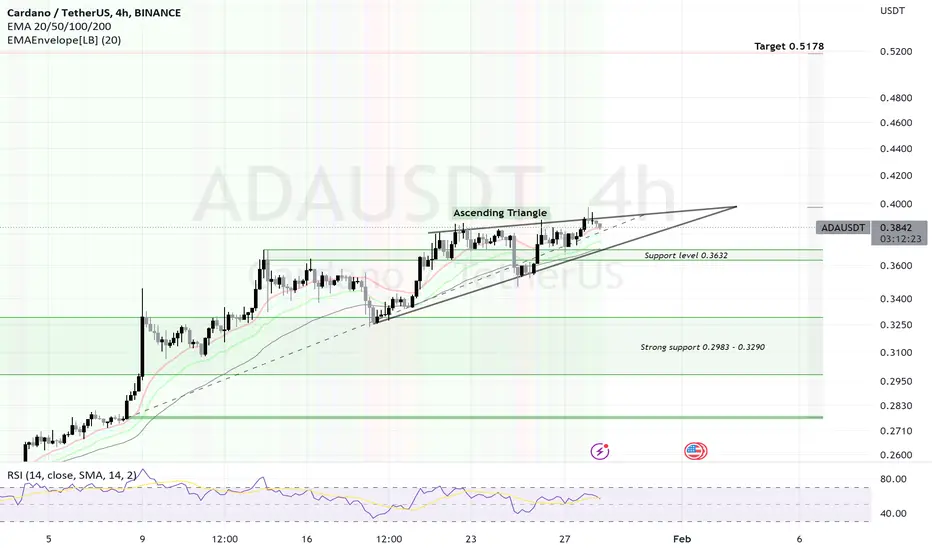
This analysis is based on the Ascending Triangle concept, which is formed by the price of Cardano. In the analysis two support levels are visualized; Strong support at 0.2983 - 0.3290, allocating back to mid-December, and the support level at 0.3632. As the drawn triangle shows, the price follows bullish also called an "Ascending Triangle". This triangle combined with the Fibonacci tool can create a true picture of how the price of Cardano may land at the target at 0.5178.
I hope this analysis helped to give an instructive picture of Cardano's evolution and can be taken into consideration for the current situation as well as the future.

免責聲明
這些資訊和出版物並非旨在提供,也不構成TradingView提供或認可的任何形式的財務、投資、交易或其他類型的建議或推薦。請閱讀使用條款以了解更多資訊。