Descending Channel Breakout for ADN?!?
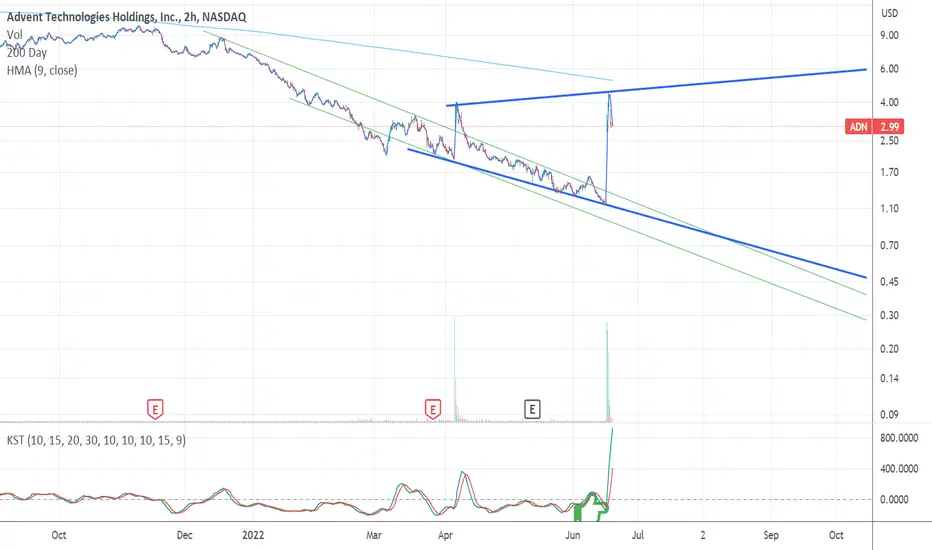
It appears as though ADN has broken flush to the upside of a descending channel which is drawn as two parallel declining lines drawn green on the chart, notice the rejection nearly exactly at the 200DMA.
On the KST there's a bullish cross where I've placed the green finger. More often than not when the KST gets this over-extended there's a sell-off immediately afterward with the rare exception of a continuation of s parabolic breakout on overwhelmingly bullish news.
A retrace to $1.40 is likely to re-test and build support on top of old resistance.
Or we're going to see a re-test of the 200DMA and a blue sky breakout.
Price target & trading range between $9.00 to $0.60c between now and the end of the year.

免責聲明
這些資訊和出版物並非旨在提供,也不構成TradingView提供或認可的任何形式的財務、投資、交易或其他類型的建議或推薦。請閱讀使用條款以了解更多資訊。
免責聲明
這些資訊和出版物並非旨在提供,也不構成TradingView提供或認可的任何形式的財務、投資、交易或其他類型的建議或推薦。請閱讀使用條款以了解更多資訊。