
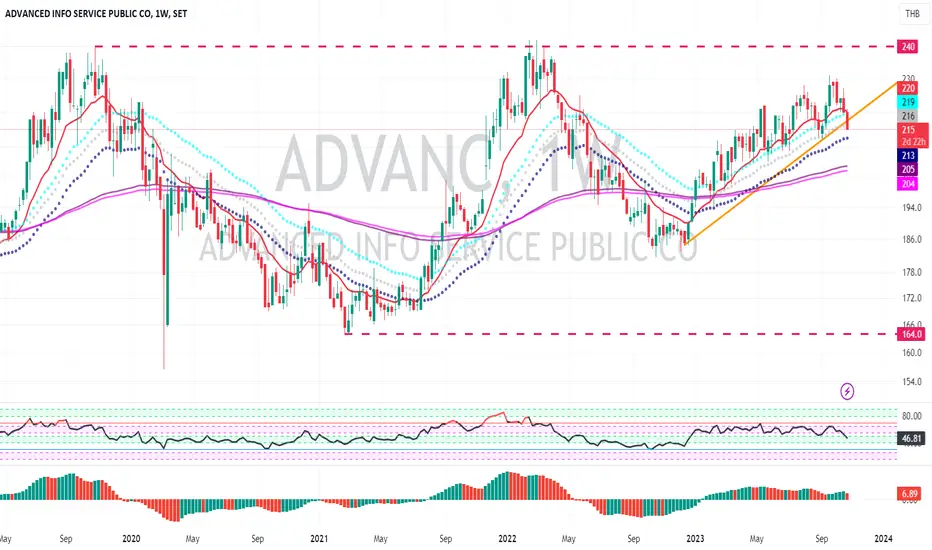
ADVANC , Week Chart , have been sideway in the trading range since 2020
and this week is the first week that price start reverse down and break out the trendline.
RSI and AO show weak momentum signal.
We should monitor how deep that this chart go down by using the daily chart to monitor more detail.
and this week is the first week that price start reverse down and break out the trendline.
RSI and AO show weak momentum signal.
We should monitor how deep that this chart go down by using the daily chart to monitor more detail.

Pragasit Thitaram, CEWA
免責聲明
這些資訊和出版物並非旨在提供,也不構成TradingView提供或認可的任何形式的財務、投資、交易或其他類型的建議或推薦。請閱讀使用條款以了解更多資訊。
Pragasit Thitaram, CEWA
免責聲明
這些資訊和出版物並非旨在提供,也不構成TradingView提供或認可的任何形式的財務、投資、交易或其他類型的建議或推薦。請閱讀使用條款以了解更多資訊。